Trend Following Quant Strategy Based on Hull and LSMA Indicators

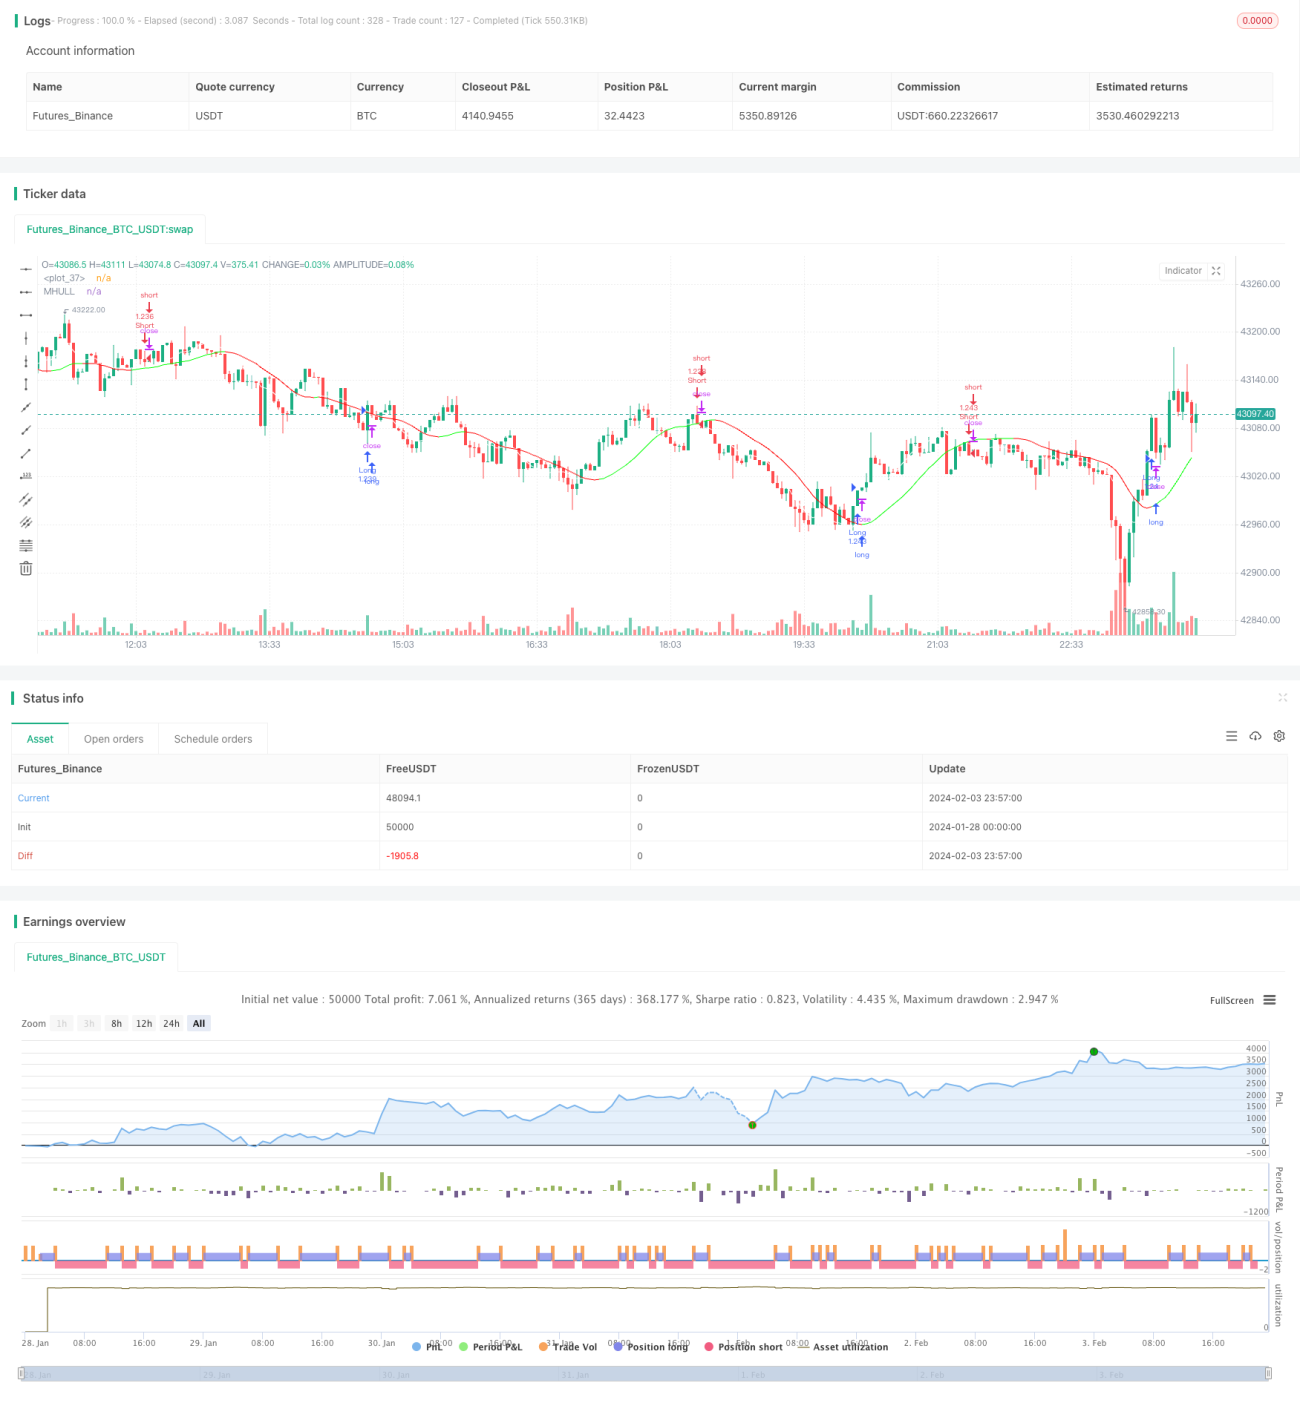
Overview
This strategy identifies trend directions and reversal points by combining the Hull and LSMA (Least Squares Moving Average) indicators to track trends. It goes long when the Hull shows an uptrend and the LSMA crosses above the Hull, and goes short when the Hull shows a downtrend and the LSMA crosses below the Hull. The strategy is suitable for medium-low frequency trading and can be used on the 1-minute timeframe.
Strategy Logic
-
The Hull indicator is used to determine the trend direction of the price. When the middle band (MHULL) is above the lower band (LHULL), it indicates an uptrend; otherwise it indicates a downtrend.
-
The LSMA indicator is used to identify reversal points of the trend. When the LSMA crosses above MHULL, it signals the formation or acceleration of an uptrend; when the LSMA crosses below MHULL, it signals the formation or acceleration of a downtrend.
-
By combining the two, the strategy goes long when Hull shows an uptrend (MHULL > LHULL) and LSMA crosses above MHULL, and goes short when Hull shows a downtrend (MHULL < LHULL) and LSMA crosses below MHULL.
-
The stop loss is set to the latest fluctuation point. For long positions it is the most recent swing low, and for short positions it is the most recent swing high.
Advantage Analysis
The main advantages of this strategy are:
-
The Hull indicator is responsive in capturing trend transitions, while the LSMA is smooth in identifying reversal signals reliably. The combination works effectively.
-
Using LSMA crossings filters out false signals from the Hull indicator and reduces erroneous trades.
-
The use of fluctuation points for stop loss protects funds to the maximum extent.
-
It is suitable for medium-low frequency trading and can be used on timeframes as low as 1-minute, with wide applicability.
Risk Analysis
There are also some risks with this strategy:
-
In ranging markets, there may be excessive crossovers between Hull and LSMA causing over-trading. Parameters should be tuned appropriately to reduce trading frequency.
-
Stop loss set to fluctuation points may be triggered by short-term price adjustments. The distance should be widened appropriately.
-
There may be some risk of misjudgment due to lagging of LSMA. Other indicators like candlestick patterns should be used to confirm signals.
Optimization Directions
The strategy can be optimized in the following aspects:
-
Optimize parameters of Hull and LSMA to match different products and timeframes.
-
Add filters based on volatility, volume etc. to avoid erroneous trades in ranging markets.
-
Incorporate machine learning models to aid in judging trend tendencies.
-
Identify key support/resistance areas with deep learning techniques for more reasonable stop loss placement.
Conclusion
By combining Hull and LSMA, this strategy effectively judges trend direction changes for trend following trading. It has the advantage of being simple to implement, responsive and widely applicable to medium-low frequency algo trading. Further improvements in filtering conditions, auxiliary judgements and stop loss algorithms can potentially yield better strategy performance.
- 1