Linear Regression Channel Breakout Trading Strategy

Overview
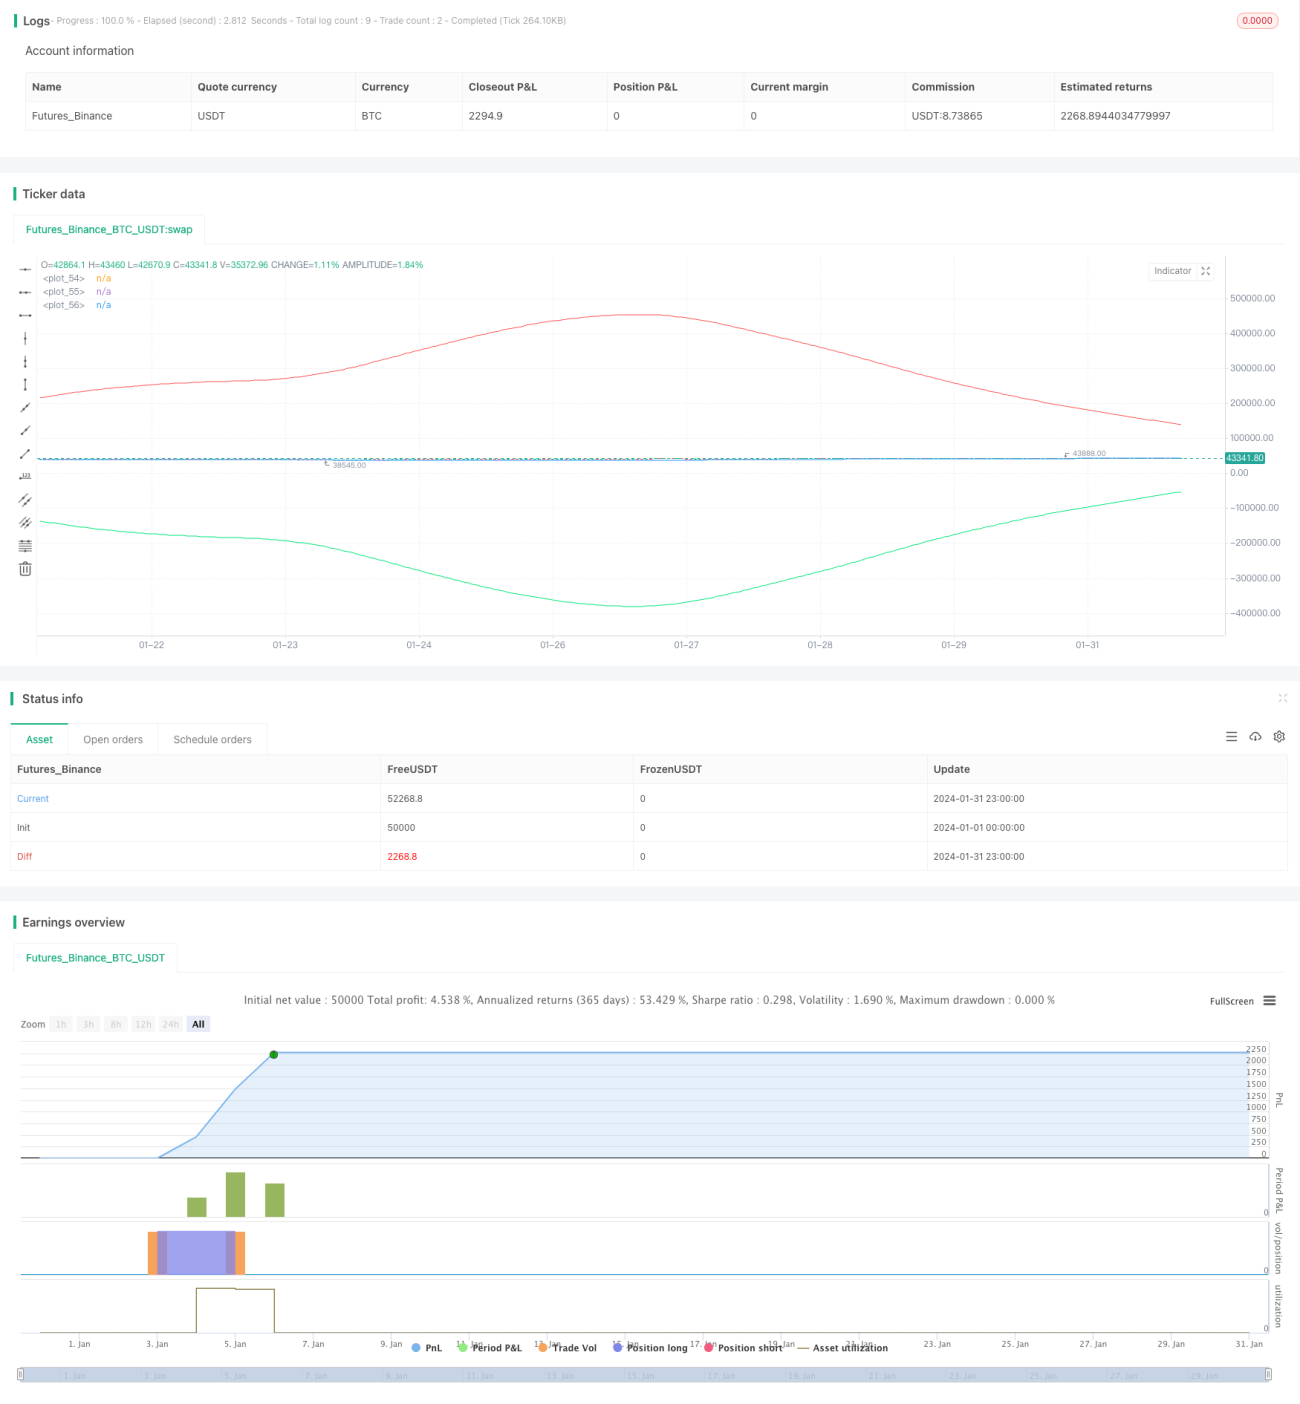
This strategy uses the upper and lower bands of the linear regression channel, combined with double standard deviation to set breakout buy and sell signals, to establish positions when prices break out. It also uses the crossover of the middle line of the channel as the profit-taking signal to lock in profits.
Strategy Logic
The core logic of this strategy is based on the upper band, lower band and middle line of the linear regression channel. The specific calculation process is as follows:
-
Calculate the linear regression value linreg of prices, and the next period's linear regression value linreg_p
-
Calculate the slope slope and intercept intercept of the linear regression line based on linreg
-
Calculate the deviation deviation of prices relative to the regression line
-
Set the multiple dev of the deviation to get the offset of the upper and lower bands
-
When price breaks out upwards from the lower band, set buy signal buy
-
When price breaks out downwards from the upper band, set sell signal sell
-
When price reverses from the middle line of the channel, set take profit signal exit
-
Set up trading logic based on buy, sell and exit signals
Advantage Analysis
The biggest advantage of this strategy is that it utilizes the medium and long term trend reflected by the linear regression channel. Specifically:
-
The upper and lower bands can effectively reflect the normal range of price fluctuations. Using them to set trading signals can reduce false signals.
-
The middle line crossover as the profit-taking signal can maximize profits and avoid losses caused by reversals after making profits.
-
The linear regression channel has some lag, which can effectively filter out short-term market noise and make trading signals more reliable.
-
This strategy has few parameters and is easy to implement, suitable for algorithmic trading.
Risk Analysis
There are some risks to this strategy:
-
The lag of the linear regression channel may miss trends after drastic short-term changes. The period can be shortened to optimize.
-
Improper setting of the deviation multiplier can also lead to false signals. Parameters can be optimized through backtesting.
-
Relying solely on breakout signals can lead to whipsaw losses. Other indicators can be used for signal filtering.
-
There are some curve fitting risks. Combining with other channel indicators or testing different data sources may help.
Optimization Directions
The main optimization directions for this strategy:
-
Optimize the length of the linear regression channel to balance lag and sensitivity.
-
Optimize the deviation multiplier to improve signal quality while maximizing risk control.
-
Add other indicators for signal filtering to improve win rate, e.g. EMA, KDJ etc.
-
Add stop loss mechanisms such as ATR trailing stop loss.
-
Test the impact of different data sources on the strategy, e.g. adjusted close, index data etc.
-
Dynamically adjust parameters or signal weights based on market conditions.
Conclusion
In summary, this is a breakout system using linear regression channel as the signal indicator. The strategy logic is clear and easy to understand, with few parameters, making live trading relatively easy to implement. However, how to dynamically optimize parameters based on changing market conditions and combine other indicators for signal filtering is key to the success of this strategy. Through continuous testing and optimization, this strategy can become a stable profit-generating quantitative system.
/*backtest
start: 2024-01-01 00:00:00
end: 2024-01-31 23:59:59
period: 1h
basePeriod: 15m
exchanges: [{"eid":"Futures_Binance","currency":"BTC_USDT"}]
*/

//Robotrading
//@version=4

strategy("robotrading linreg", "linreg", overlay=true, default_qty_type = strategy.percent_of_equity, default_qty_value = 10, commission_value = 0.1)- 1