Momentum Moving Average Reversal Strategy

Overview
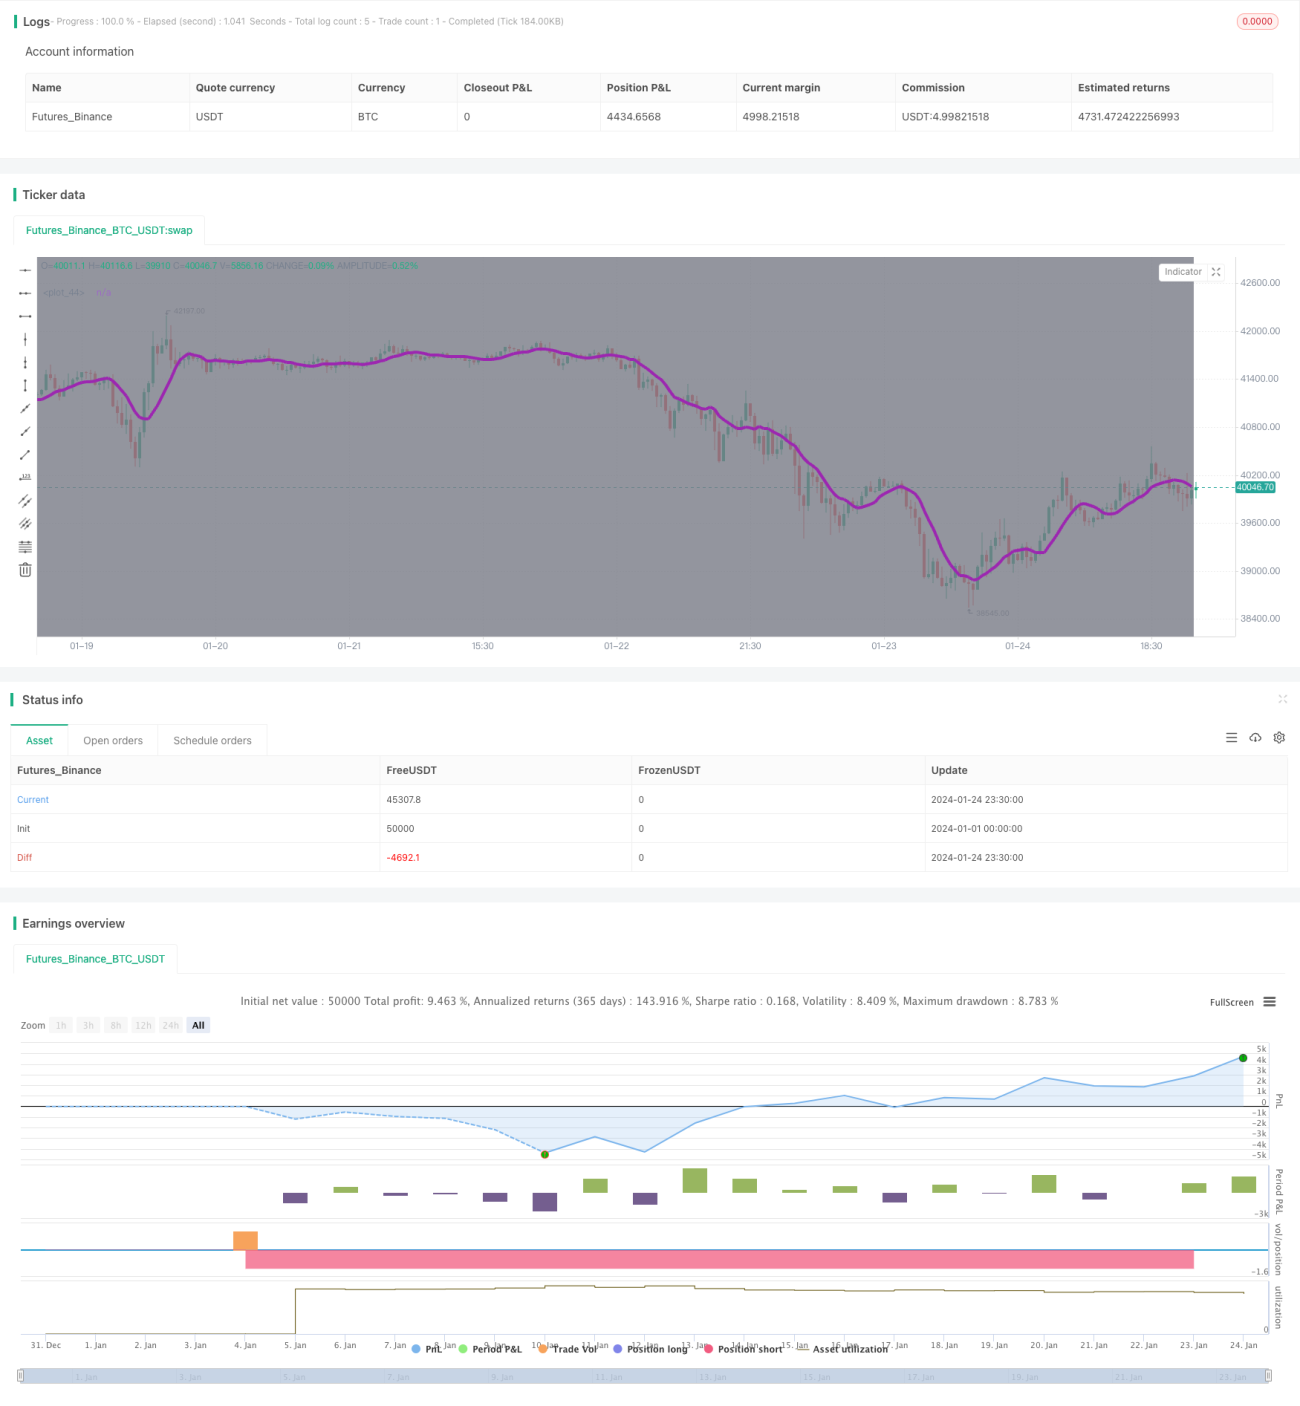
The core idea of this strategy is to combine the RSI indicator and moving average to find opportunities for stock price reversals and achieve buying low and selling high. When the RSI indicator shows that the stock is oversold and the short-term moving average crosses below the price, it serves as a buy signal. After setting the stop loss and take profit, wait for the price to reverse upward.
Strategy Principle
This strategy mainly uses the RSI indicator to judge oversold and overbought conditions, and the golden cross and dead cross of the moving average to determine price trends. Specifically, the RSI indicator can effectively judge whether a stock is oversold or overbought. When the RSI is below 30, it is in the oversold range. And when the short-term moving average (set to 9-day in this strategy) crosses below the price, it means the price is falling.
So when the RSI indicator is below 40, nearing the oversold state, and the 9-day moving average crosses below the price, it can be judged as a possible timing for the stock price to reverse, going long to buy. Then set the stop loss and take profit to exit, waiting for the stock price to reverse upward before selling to take profits.
Advantage Analysis
This strategy combines the RSI indicator and moving average, which can effectively determine the timing of buying. Compared with a single judgment of oversold, the added condition judgment of the moving average avoids fluctuation in the oversold area. The setting of stop loss and take profit is flexible and can vary from person to person.
Risk Analysis
This strategy relies on parameter settings such as RSI judgment threshold, moving average time window, etc. Different parameters may lead to different results. And under certain market conditions, stop loss is still possible.
In addition, transaction fees will also have a certain impact on profits. It is worth considering incorporating trading volume or fund management modules later for optimization.
Optimization Direction
Consider dynamically adjusting moving average parameters, selecting different parameters for different cycle; or introducing other indicators to judge, such as KDJ, MACD, etc., to form a comprehensive judgment based on multiple conditions.
It is also possible to establish a trading volume or capital management module to control the proportion of funds occupied by a single trade and reduce the impact of a single loss.
Summary
In general, this strategy uses RSI indicators and moving averages to determine buy timing and can effectively determine price reversals. Buying in oversold and locking in profits with stop loss and take profit can yield good results. For future optimizations, it is worth considering incorporating more Indicators or adding additional trading/fund management modules to make the strategy more robust.
- 1