Dual Moving Average Pressure Rebound Strategy

Overview
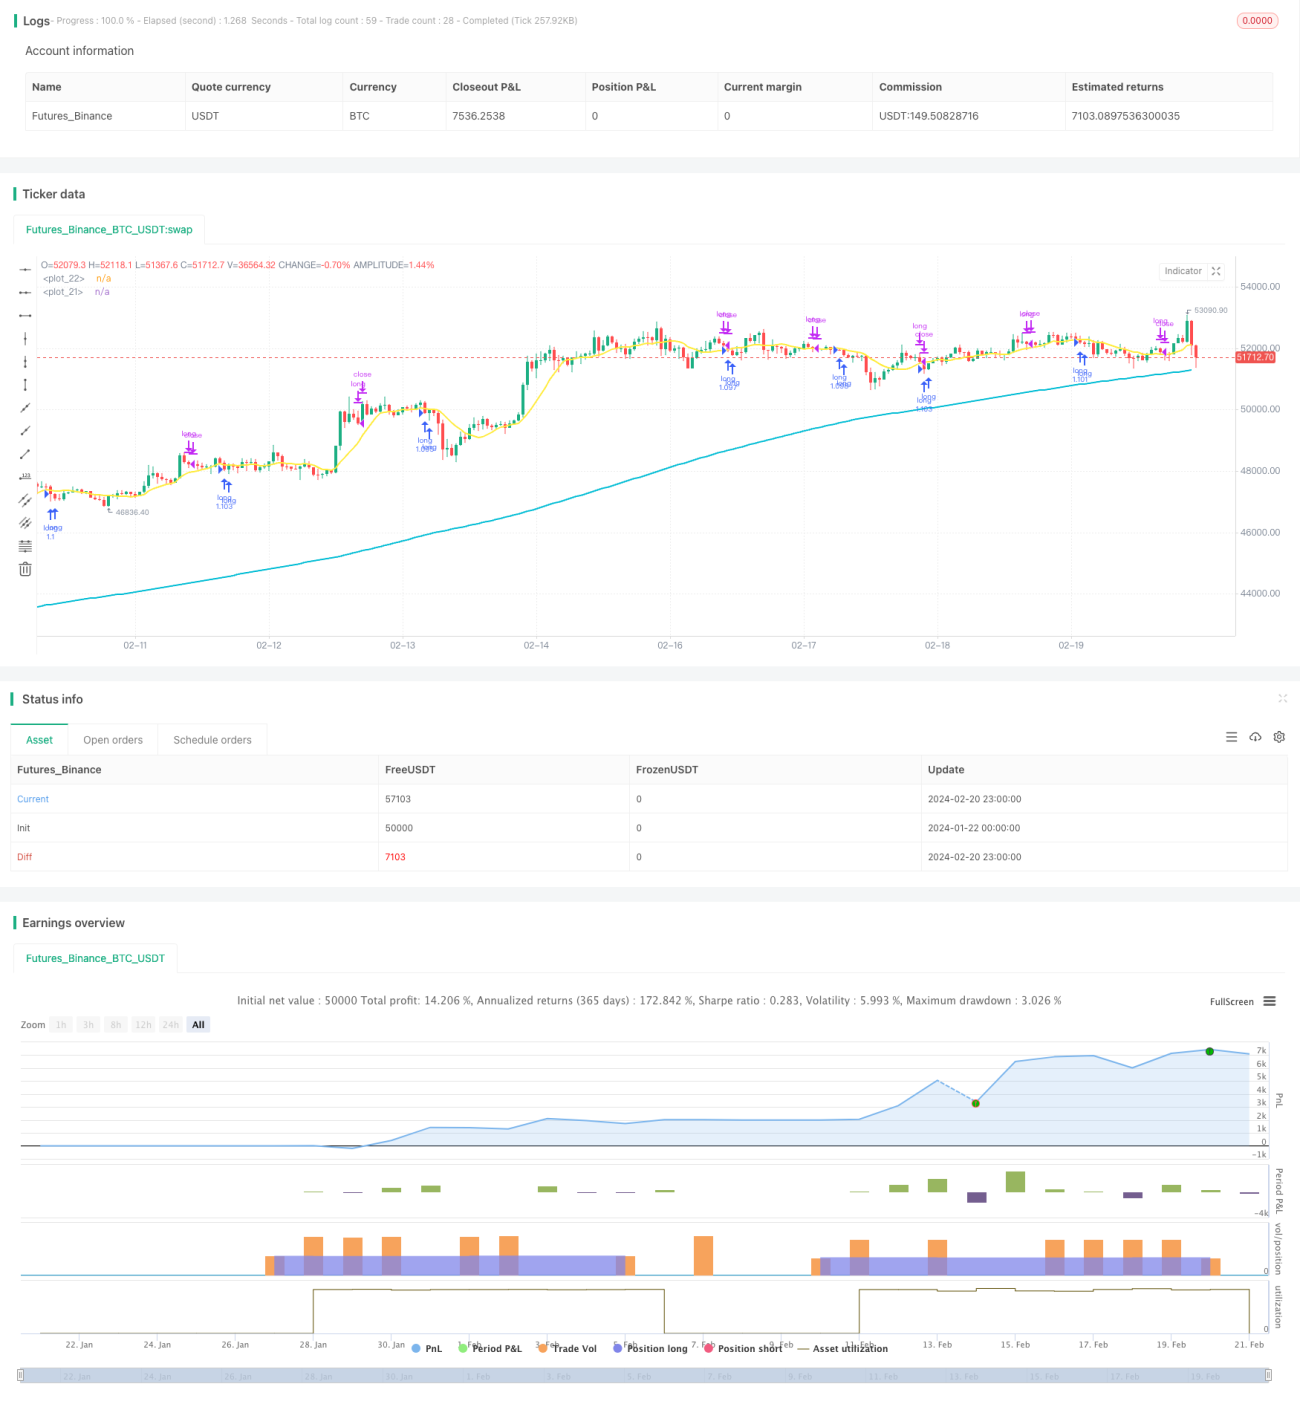
The dual moving average pressure rebound strategy is a very simple hedge strategy for stock indices. It only conducts long positions. When the price approaches the pressure level during an uptrend, it opens positions to avoid entering the market after a major breakthrough of the pressure level and lock in a better purchase price.
Strategy Principle
The strategy uses both the long-term 200-day moving average and the short-term 10-day moving average. Positions can only be opened when the closing price is above the 200-day line, that is, the long-term trend is up. When the closing price is below the 10-day line, it means that the stock index is in a pressure zone. At this time, if the RSI indicator is less than 30, it indicates that stock prices may rebound. Then go long to open a position.
Once the position is opened, set a 5% stop loss and 10% take profit to exit the trade. In addition, if the price breaks through the 10-day line upwards, take profit proactively.
Advantage Analysis
The biggest advantage of the dual moving average pressure rebound strategy is its strong trend-following capability. By adopting dual short and long moving averages, it can effectively judge the direction of the long-term trend. Long positions will only be considered when the long-term trend is up. This avoids the risks of blindly going long.
Secondly, the timing of entry this strategy chooses is very precise. It takes advantage of the pressure brought by the moving average zone and judges the overbought and oversold indicator to select the optimal timing for a rebound. This enables a relatively superior entry price and allows more room for profit.
Risk Analysis
The biggest risk of the dual moving average pressure rebound strategy is that it is prone to multiple small stop losses. When the price oscillates back and forth in the pressure zone, it is very likely to trigger stop loss repeatedly. In this case, there is a risk of multiple small losses.
In addition, if the long-term trend is incorrectly judged, which leads to a major break-out upon entry, the stop loss here may be larger, posing greater risks.
To control risks, properly loosening the stop loss range and increasing the holding period can be adopted. At the same time, the long-term trend must be judged prudently to avoid risks brought by incorrect long positions.
Optimization
The strategy can be optimized in the following aspects:
-
Add more factors to judge the long-term trend. In addition to simple moving averages, more indicators such as fundamentals and trading volume changes can be introduced to make more accurate judgments on long-term trends.
-
Optimize entry timing. Judging whether there is a significant amplification of energy before breaking through the pressure level is beneficial for judging the intensity and amplitude of the rebound.
-
Optimize the take profit method. The existing take profit method is relatively passive and cannot continuously capture the increase. More dynamic take profit methods such as trail stops can be studied. While ensuring controllable risks, more gains can be obtained.
-
Optimize position management. The position size can be adjusted in real-time according to the fluctuation range of the broader market. This can reduce P&L fluctuations and achieve more stable returns.
Summary
The dual moving average pressure rebound strategy is a simple and practical hedging strategy. It can effectively track long-term trends and choose high-quality rebound timing to open positions. By setting stop loss and take profit to lock in profits, risks can be avoided. The theoretical basis of this strategy is simple and suitable for most people. It is a good hedging strategy.
There is still great potential for the strategy to be improved in aspects like optimizing entry timing, dynamic take profit methods and position management. It is worthwhile to investigate further.
- 1