Multi-EMA, RSI and Standard Deviation-Based Exit Candlestick Height Breakout Trading Strategy

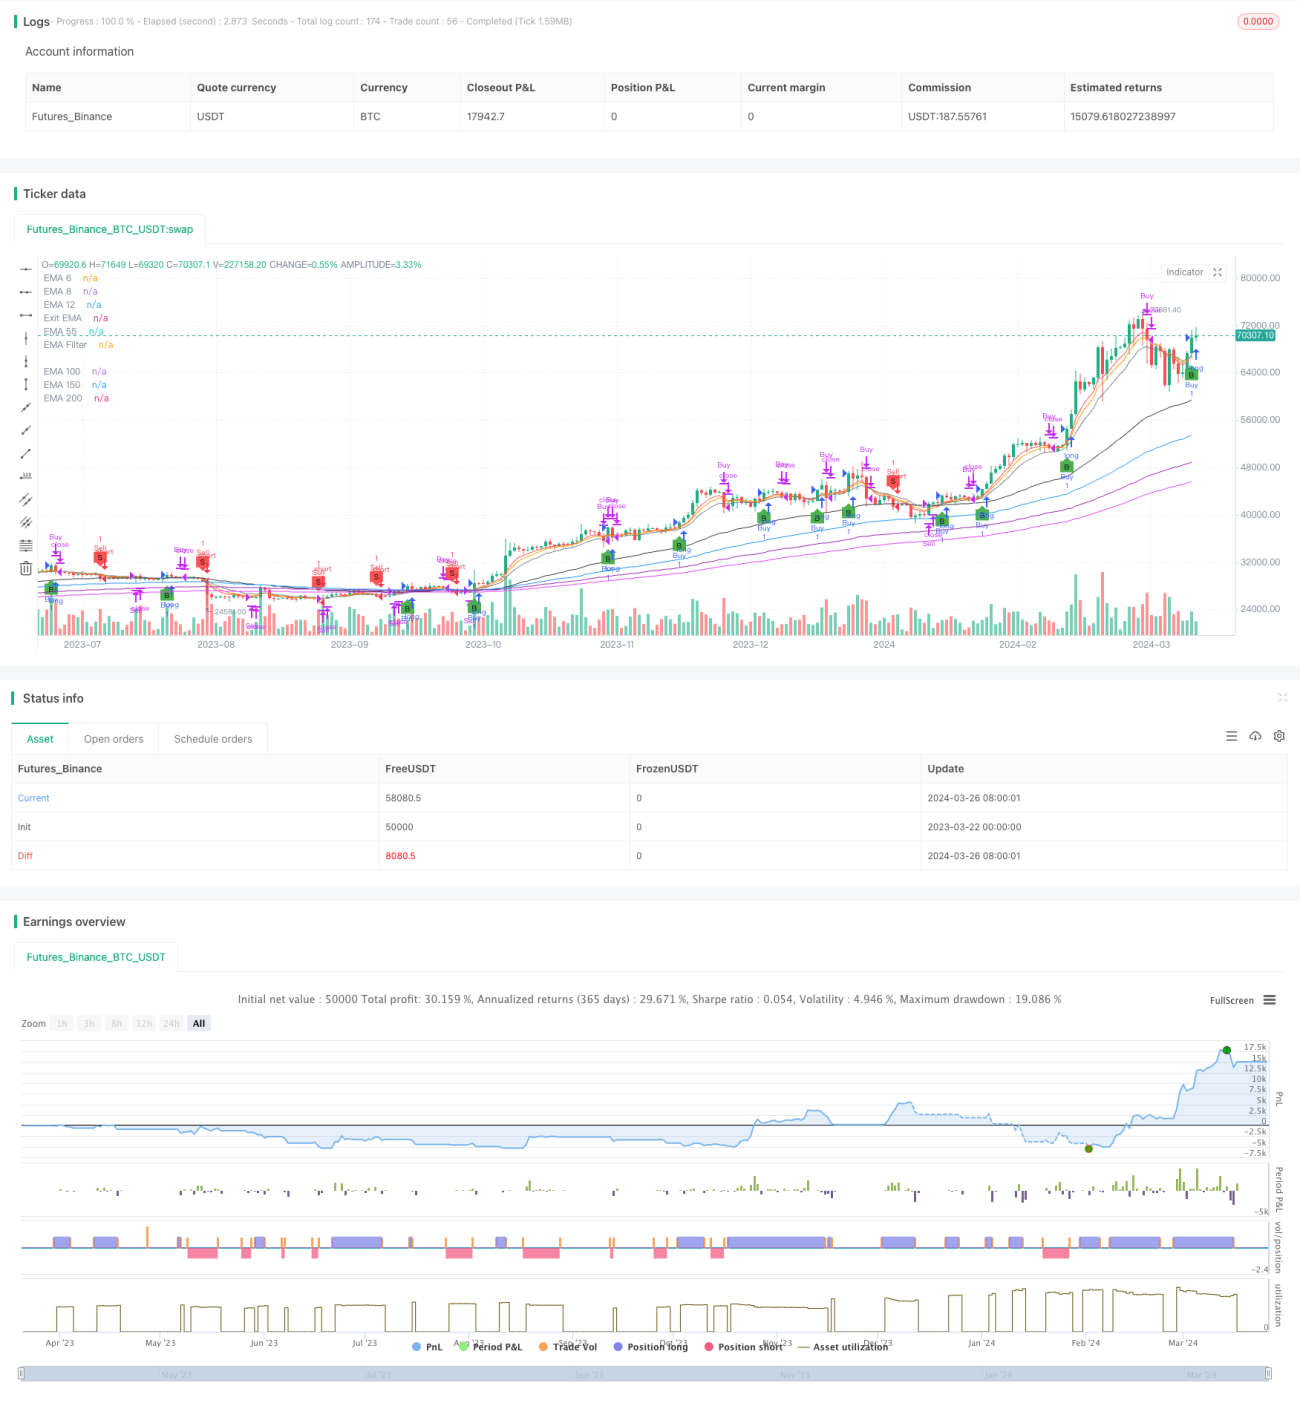
Strategy Overview
This strategy combines multiple Exponential Moving Averages (EMAs), the Relative Strength Index (RSI), and a standard deviation-based exit condition to identify potential buy and sell opportunities. It uses short-term (6, 8, 12 days), medium-term (55 days), and long-term (150, 200, 250 days) EMAs to analyze the direction and strength of market trends. The RSI, with configurable buy (30) and sell (70) thresholds, is employed to assess momentum and identify overbought or oversold conditions. The strategy also features a unique exit mechanism that triggers when the closing price reaches a configurable standard deviation range (default 0.5) from the 12-day EMA, providing a method for potentially protecting profits or minimizing losses.
Strategy Principles
- Calculate multiple EMAs (6, 8, 12, 55, 100, 150, 200) as visual references to assess market trends.
- Determine the highest high and lowest low of the most recent N candles based on user input (3-4 candles).
- Entry Long: The current close is higher than the highest high of the recent N candles and above the EMA filter (if enabled).
- Entry Short: The current close is lower than the lowest low of the recent N candles and below the EMA filter (if enabled).
- Exit Long: The current close is below the 12-day EMA + 0.5 standard deviations, or below the 12-day EMA.
- Exit Short: The current close is above the 12-day EMA - 0.5 standard deviations, or above the 12-day EMA.
- Use RSI as a supplementary indicator with a default period of 14, an oversold threshold of 30, and an overbought threshold of 70.
Strategy Advantages
- Combines both trend-following (multiple EMAs) and momentum (RSI) dimensions for a more comprehensive market analysis perspective.
- Unique standard deviation-based exit mechanism can balance protecting profits and controlling risks.
- Highly modularized code with key parameters configurable by users for strong flexibility.
- Applicable to multiple instruments and timeframes, especially daily stocks and Bitcoin trading.
Risk Analysis
- Frequent false signals during market consolidation or early trend reversals, leading to consecutive losses.
- Default parameters may not be effective for all market conditions; optimization based on backtesting is necessary.
- Relying solely on this strategy for trading is risky; it is recommended to combine with other indicators, support/resistance levels for decision-making.
- Slow to respond to trend reversals triggered by sudden major events.
Optimization Directions
- Optimize EMA and RSI parameters: Perform exhaustive searches for optimal parameter ranges based on instruments, timeframes, and market characteristics.
- Introduce stop-loss and take-profit mechanisms: Set reasonable stop-loss and take-profit levels with reference to volatility indicators like ATR to control single-trade risks.
- Implement position sizing: Adjust position sizes based on trend strength (e.g., ADX) or proximity to key support/resistance levels.
- Combine with other technical indicators: Such as Bollinger Bands, MACD, moving average crossovers to improve the reliability of entry/exit signals.
- Optimize for different market states: Fine-tune parameter combinations for trending, ranging, and transitioning markets separately.
Summary
This article proposes a candlestick height breakout trading strategy based on multiple moving averages, RSI, and a standard deviation exit. The strategy analyzes the market from both trend and momentum dimensions while employing a unique standard deviation exit mechanism to capture trend opportunities and manage risks. The strategy logic is clear, rigorous, and the code implementation is concise and efficient. With proper optimization, this strategy has the potential to become a robust intraday medium-to-high frequency trading strategy. However, it is important to note that any strategy has its limitations, and blind usage may introduce risks. Quantitative trading should not be a mechanical "signal-order" process but rather be built upon a grasp of the overall market situation and prudent risk management. Traders also need to continuously evaluate strategy performance, make timely adjustments, and combine it with their own trading styles and risk tolerance to achieve long-term success.
/*backtest
start: 2023-03-22 00:00:00
end: 2024-03-27 00:00:00
period: 1d
basePeriod: 1h
exchanges: [{"eid":"Futures_Binance","currency":"BTC_USDT"}]
*/

//@version=5
strategy("Candle Height Breakout with Configurable Exit and Signal Control", shorttitle="CHB Single Signal", overlay=true)

// Input parameters for EMA filter and its length- 1