Bollinger Bands and RSI Trading Strategy

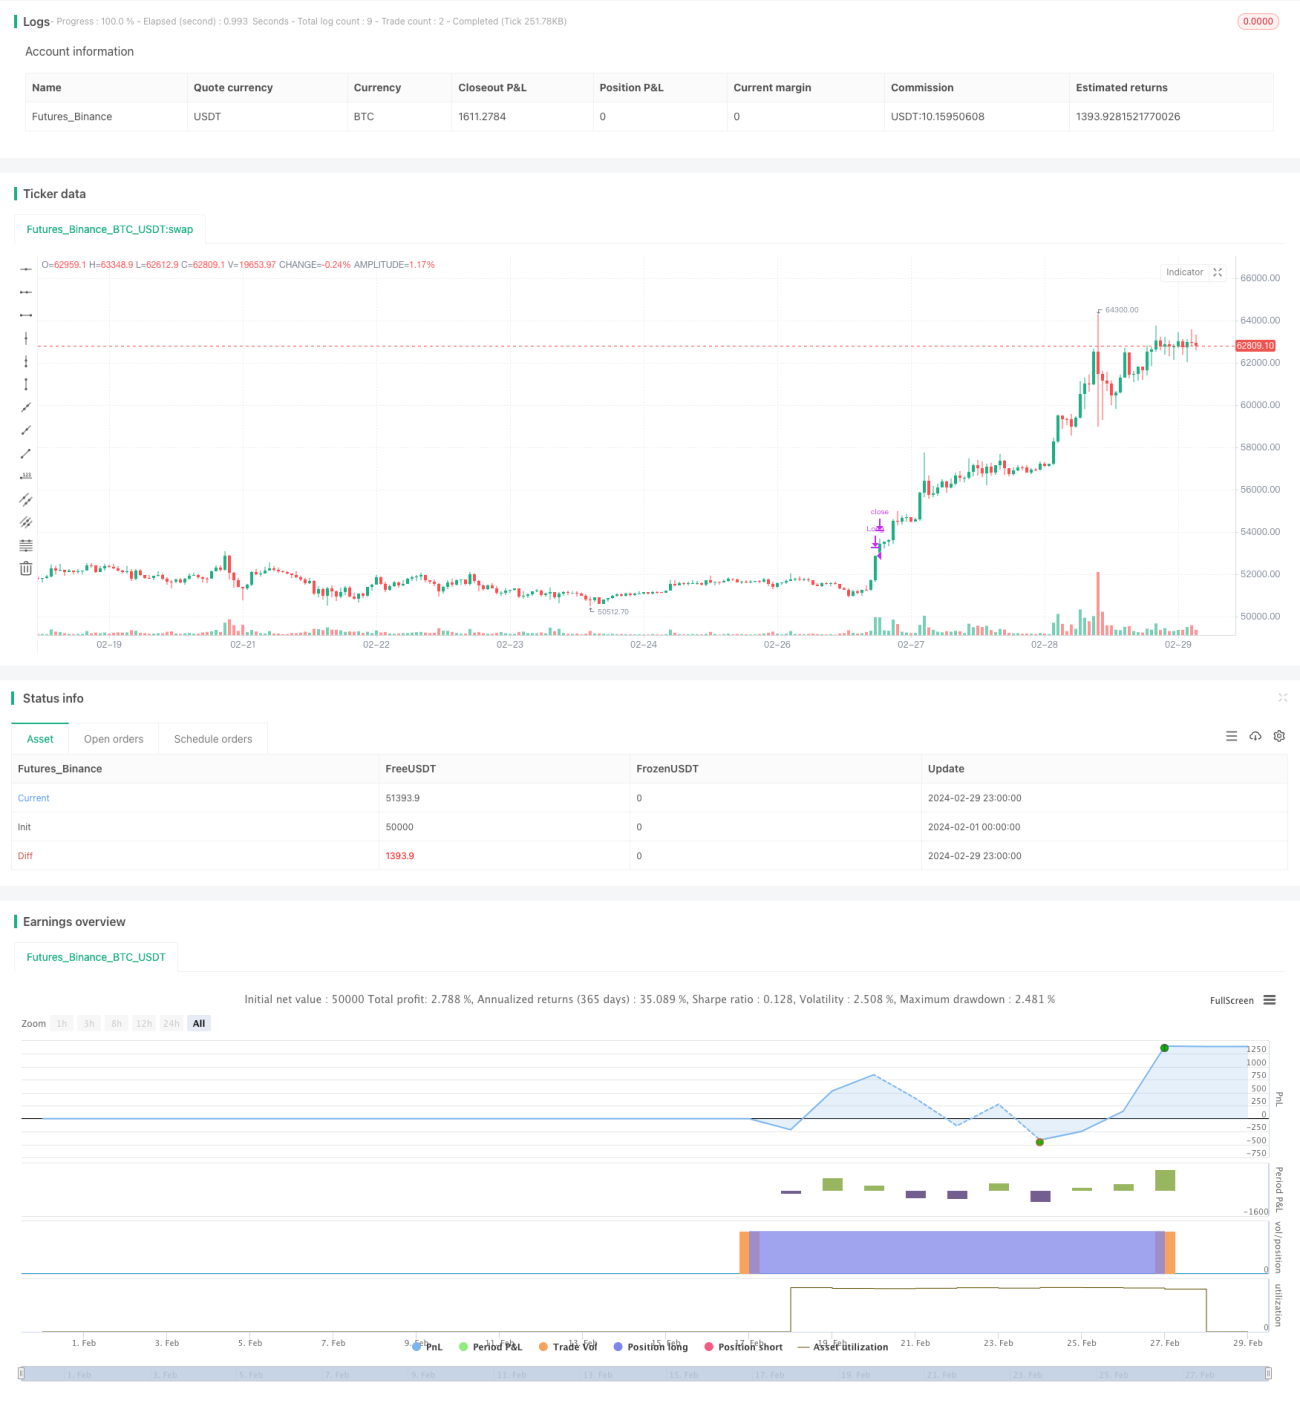
Overview
This strategy combines Bollinger Bands and the Relative Strength Index (RSI) to generate buy and sell signals. A buy signal is triggered when the price breaks below the lower Bollinger Band and the RSI is below a specified lower level. A sell signal is triggered when the price breaks above the upper Bollinger Band and the RSI is above a specified upper level. Additionally, the strategy introduces a buy interval parameter to avoid frequent trading, which is conducive to pyramid position management.
Strategy Principles
- Calculate the RSI indicator to measure overbought and oversold conditions.
- Calculate the upper and lower Bollinger Bands to determine price breakouts.
- Set buy and sell signals based on RSI and Bollinger Bands:
- A buy signal is generated when the closing price is below the lower Bollinger Band and the RSI is below the specified lower level.
- A sell signal is generated when the closing price is above the upper Bollinger Band and the RSI is above the specified upper level.
- Introduce a buy interval parameter to limit the frequency of consecutive buys, facilitating pyramid position management.
Strategy Advantages
- Double confirmation: The strategy uses both Bollinger Bands and RSI indicators, providing more reliable trend reversal detection and reducing false signals.
- Pyramid position building: By setting a buy interval parameter, the strategy gradually adds positions as the trend is established, which helps control risk and optimize returns.
- Flexible parameters: Users can flexibly set RSI upper and lower levels and buy interval parameters according to market characteristics and personal preferences.
Strategy Risks
- Trend continuation risk: If the price experiences a short pullback after breaking through the Bollinger Bands, the strategy may close positions prematurely and miss subsequent trends.
- Parameter optimization risk: The optimal parameter combination may vary significantly in different market environments, and the strategy may face overfitting risks.
- Black swan events: The strategy is built based on historical data and may not effectively handle extreme market conditions.
Strategy Optimization Directions
- Introduce stop-loss and take-profit: Add trailing stop or fixed stop-loss and take-profit logic to the strategy to further control individual trade risks.
- Dynamic parameter optimization: Dynamically adjust parameters such as RSI upper and lower levels and buy intervals based on changes in market conditions to improve strategy adaptability.
- Combine with other technical indicators: Introduce other trend or oscillator indicators as auxiliary judgments to enhance strategy robustness.
Summary
This strategy cleverly combines two classic technical indicators: Bollinger Bands and RSI. It utilizes a double confirmation mechanism to capture trending opportunities. At the same time, the strategy introduces a pyramid position-building method to control risk while optimizing returns. However, the strategy also faces risks such as trend continuation risk, parameter optimization risk, and black swan event risk. In the future, the strategy can be further optimized by introducing stop-loss and take-profit, dynamic parameter optimization, and combining with other indicators. Overall, this is a clear-cut and logically rigorous quantitative trading strategy that is worth further exploration and practice.
/*backtest
start: 2024-02-01 00:00:00
end: 2024-02-29 23:59:59
period: 1h
basePeriod: 15m
exchanges: [{"eid":"Futures_Binance","currency":"BTC_USDT"}]
*/

// This source code is subject to the terms of the Mozilla Public License 2.0 at https://mozilla.org/MPL/2.0/

//@version=4
strategy(overlay=true, shorttitle="cakes'Strategy For RSI", default_qty_type = strategy.percent_of_equity, initial_capital = 100000, default_qty_value = 100, pyramiding = 0, title="cakes'Strategy", currency = 'USD')- 1