Wavetrend Large Amplitude Oversold Rebound Grid Trading Strategy

Overview
This strategy is based on the Wavetrend indicator and establishes long positions when the price reaches multiple oversold and overbought levels. It closes positions for profit when the price rebounds to the overbought level. This is a grid trading strategy designed to capture oversold rebound opportunities in the market, suitable for 15-minute cycles of cryptocurrencies such as Bitcoin and Solana.
Strategy Principles
- Calculate two lines of the Wavetrend indicator, one is the original value (wt1) and the other is the smoothed value (wt2).
- Set multiple oversold levels (oslevel1~8) and overbought levels (Oblevel1~5).
- When both wt1 and wt2 are below a certain oversold level and wt1 is above wt2, open a long position. The lower the level, the more aggressive the position.
- When both wt1 and wt2 are above the overbought level 1 and wt1 is below wt2, close 70% of the long position.
- Repeat steps 3 and 4 to build a grid trading system.
Strategy Advantages
- Capture oversold rebound opportunities: By setting multiple oversold levels, it opens positions after a significant price drop to profit from the rebound.
- Batch position building to control risk: It builds positions in batches according to oversold levels, with heavier positions at lower levels, allowing better risk control.
- Automatic profit-taking: It automatically closes most of the positions when the price rebounds to the overbought zone, locking in profits.
- Flexible parameters: Oversold and overbought levels can be adjusted according to market characteristics and personal preferences, adapting to different trading products and cycles.
Strategy Risks
- Crash risk: If the price continues to fall, triggering more and more oversold opening signals, it may lead to heavy positions being trapped.
- Choppy market risk: If the price repeatedly fluctuates in the oversold zone, it may lead to multiple position openings without being able to take profit, thus weakening the strategy's effect.
- Parameter risk: Different parameter settings have a significant impact on strategy performance and need to be optimized based on backtesting and experience, otherwise, they may bring losses.
Strategy Optimization Directions
- Add trend filtering: Determine if the big-level trend is upward before opening a position to avoid opening positions in a downward trend.
- Optimize position management: Adjust the opening position size according to the distance between the price and the oversold level, with larger positions for greater distances.
- Dynamic profit-taking: Dynamically adjust the profit-taking level based on the holding profit and loss ratio, instead of closing positions at a fixed ratio.
- Add stop-loss: Set a fixed or trailing stop-loss to control the maximum loss of a single transaction.
Summary
The Wavetrend Large Amplitude Oversold Rebound Grid Trading Strategy is a quantitative strategy based on oversold and overbought signals. It attempts to capture rebound opportunities after a sharp fall through batch position building and automatic profit-taking, aiming to profit from the price difference. The advantage of this strategy lies in its strong adaptability and flexible parameter adjustment. However, it also faces risks such as continued market decline and improper parameter settings. In practical applications, trend filtering, dynamic positioning, profit-taking, and stop-loss optimization methods can be considered to improve the strategy's stability and profitability. However, it still needs to be noted that this strategy is a high-risk strategy that requires strict position control and cautious use.
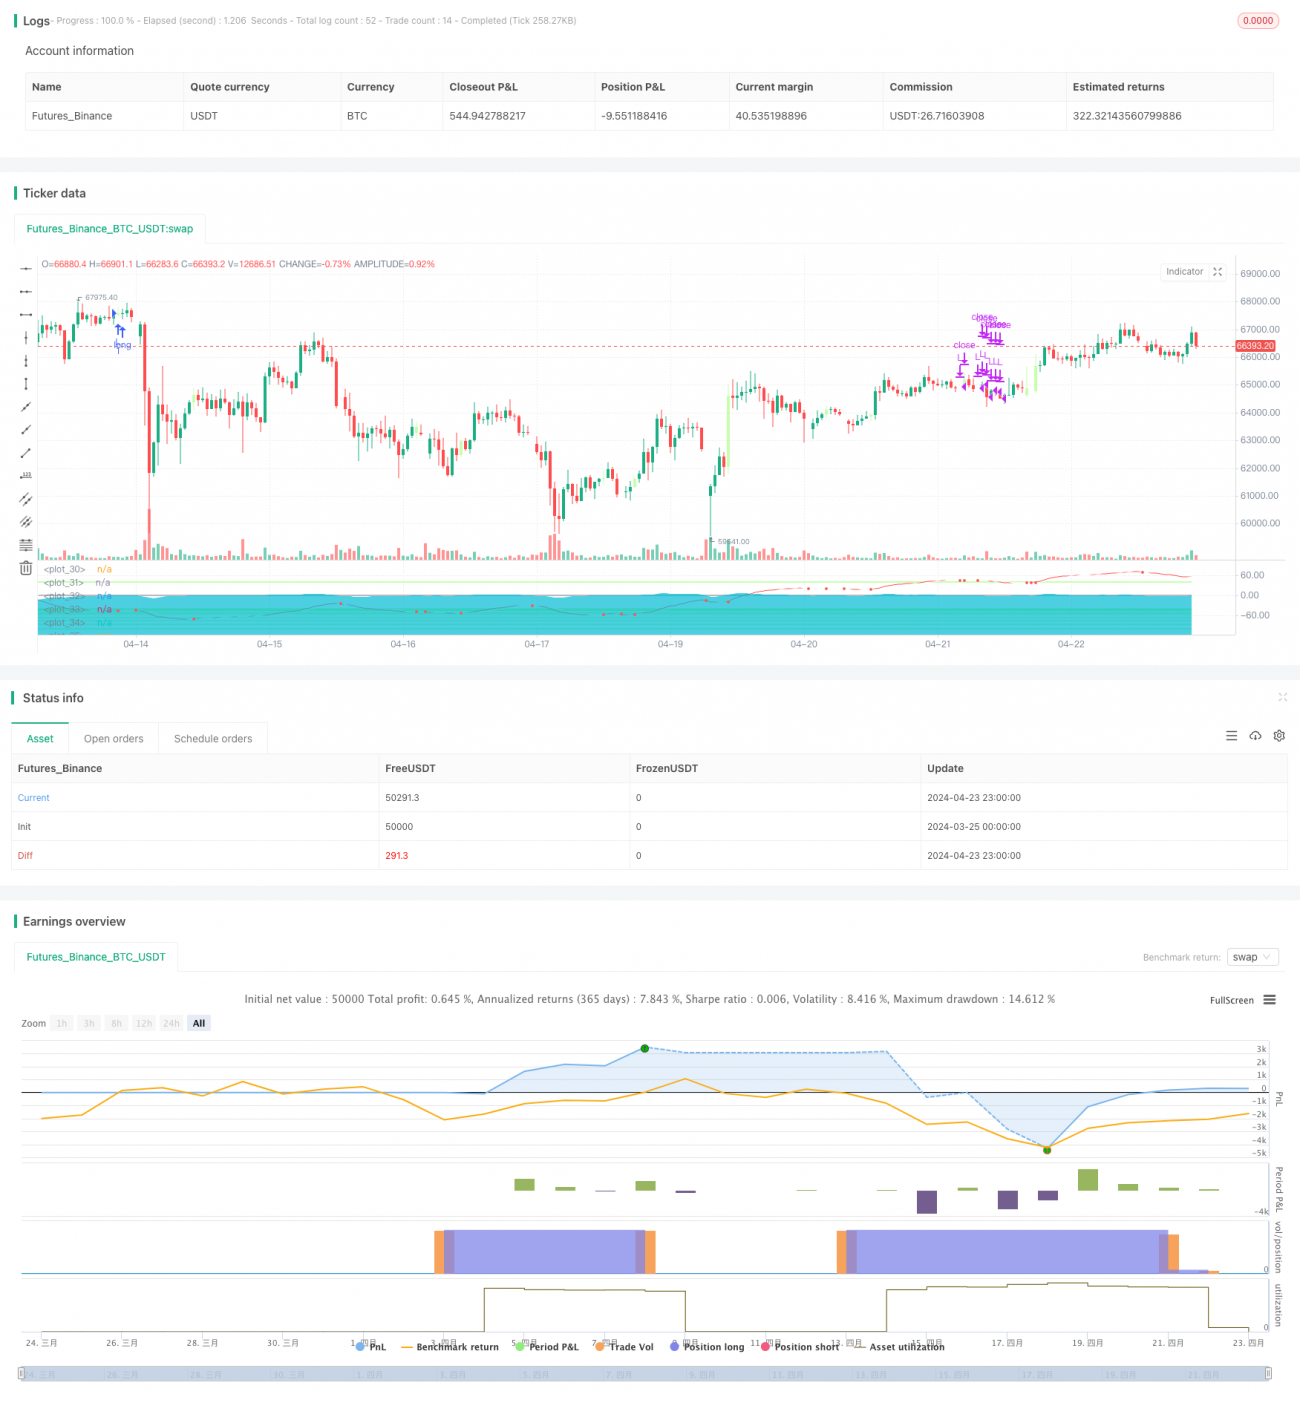
/*backtest
start: 2024-03-25 00:00:00
end: 2024-04-24 00:00:00
period: 1h
basePeriod: 15m
exchanges: [{"eid":"Futures_Binance","currency":"BTC_USDT"}]
*/

//@version=5
// © And Isaac, all rights reserved. If there is any piracy, please call the police immediately.

strategy(title='wavetrend',shorttitle='DCA-High win rate quantitative trading')- 1