
Strategy Overview
This strategy is an intelligent trading system based on Wave Trend indicators and Dollar Cost Averaging (DCA) principles. It analyzes market wave trends to gradually build positions in oversold areas and take profits during confirmed bull markets. The strategy combines the advantages of technical analysis and risk management to consistently accumulate positions and generate returns throughout market cycles.
Strategy Principles
The core logic includes the following key elements:
- Uses HLC3 price average and Exponential Moving Average (EMA) to calculate Wave Trend indicators for identifying overbought and oversold conditions
- Determines major cycle trends using the Awesome Oscillator to identify bull and bear markets
- During bear markets, builds positions in batches when prices are in oversold territory, with position sizes adjusted dynamically based on oversold levels
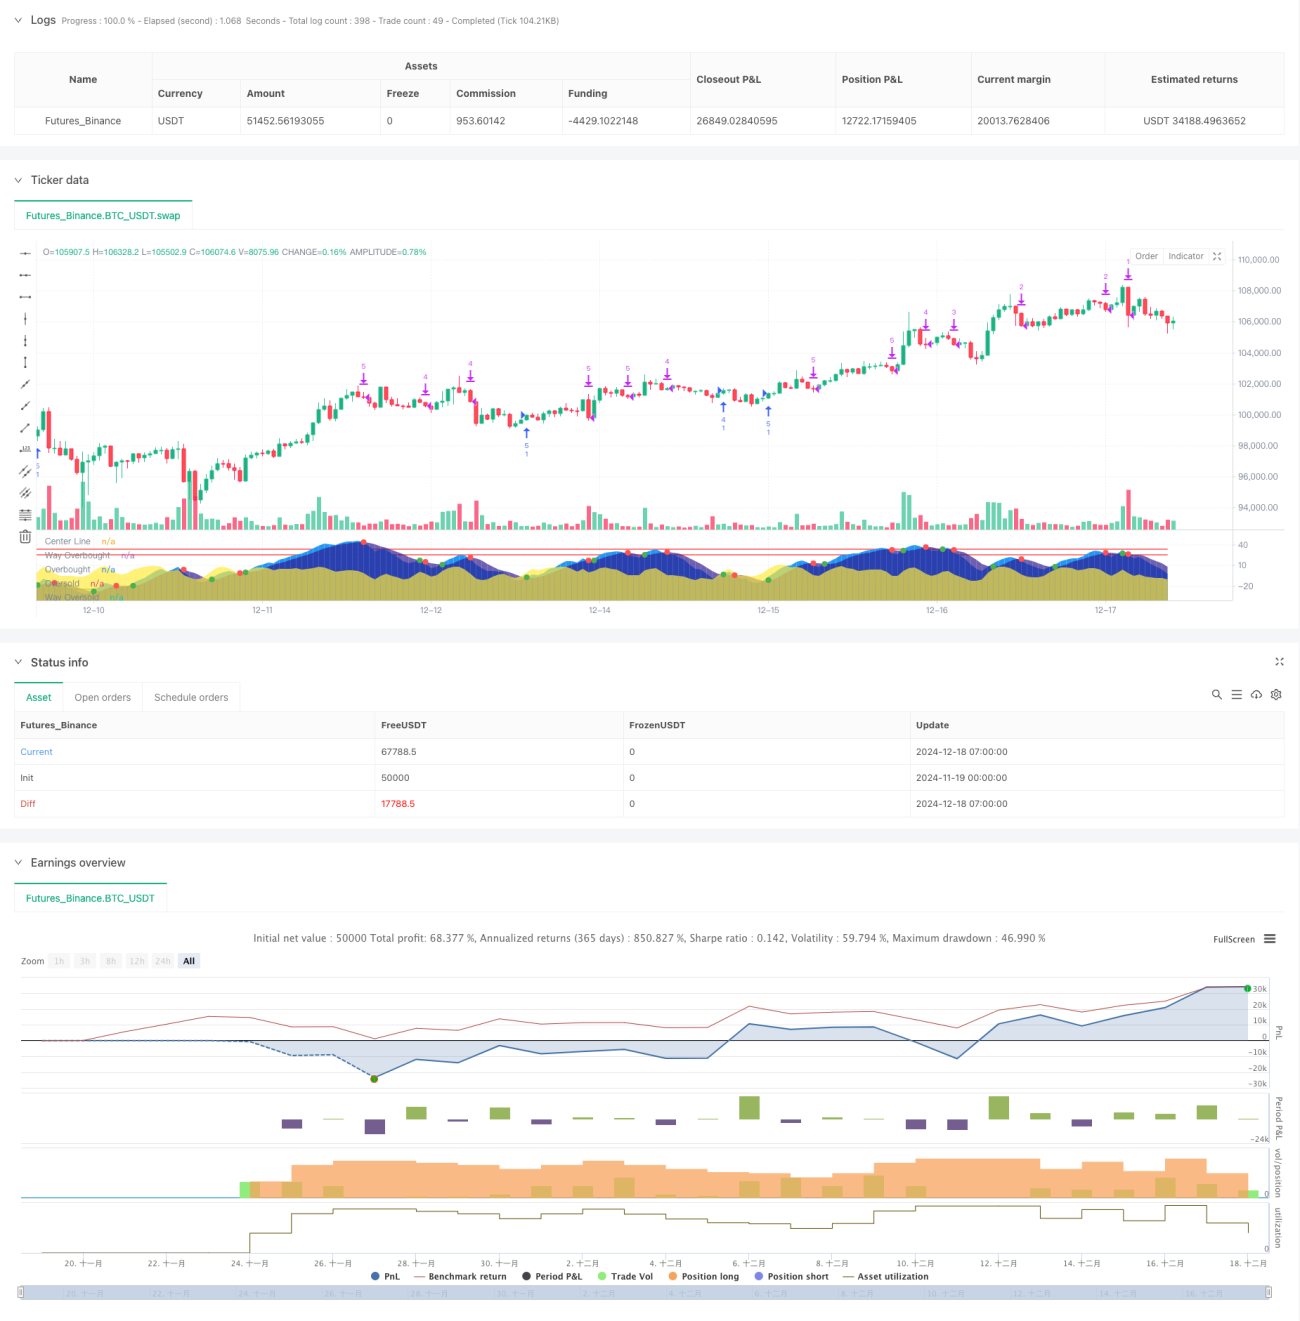
- Issues "Golden Buy" signals when bull markets begin, increasing position building
- During bull markets, gradually takes profits when prices enter overbought territory
- Closes all positions to secure profits when bear market signals or market top indicators appear
Strategy Advantages
- Reduces entry costs through dollar cost averaging, effectively avoiding chase-high risks
- Multiple technical indicators cross-validate to improve trading signal reliability
- Flexible position management with dynamic adjustment of buy/sell quantities based on market conditions
- Strong defensive capabilities with timely stop-loss during bear market signals
- Clear strategy logic with adjustable parameters suitable for different market environments
Strategy Risks
- May generate frequent trades in choppy markets, increasing transaction costs
- DCA strategy might miss optimal entry points in rapid unidirectional uptrends
- Technical indicators have inherent lag, potentially causing delayed reactions in volatile markets
- Improper parameter settings may lead to inaccurate entry and exit timing
Strategy Optimization Directions
- Introduce volatility indicators to optimize position sizing calculations
- Add more market sentiment indicators to improve trend identification accuracy
- Develop adaptive parameter systems that dynamically adjust based on different market cycles
- Enhance money management modules for more precise position control
Summary
This is an intelligent trading strategy that effectively combines technical analysis with risk management. Through Wave Trend indicators and dollar cost averaging methods, it achieves stable returns while protecting capital safety. The strategy's core advantage lies in its adaptability to different market environments, clear trading logic, and risk control mechanisms.
- 1