Advanced Dynamic Fibonacci Retracement Trend Quantitative Trading Strategy

Overview
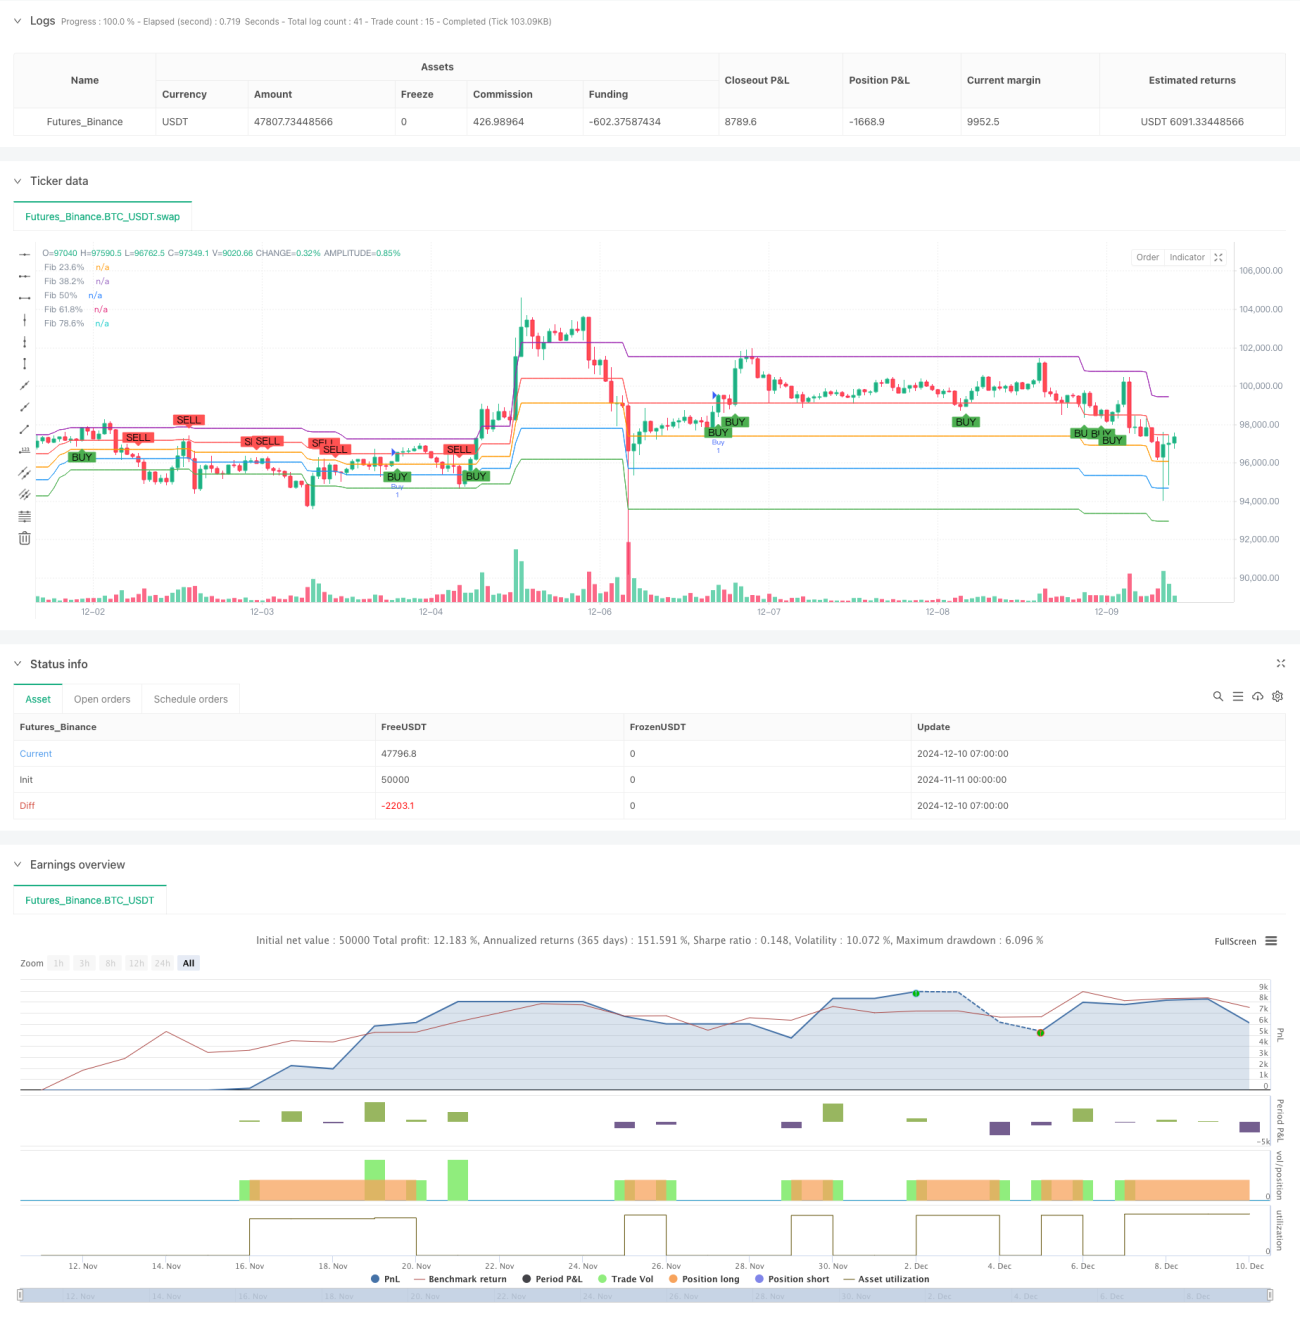
This strategy is an advanced trend-following system based on Fibonacci retracement principles. It identifies potential support and resistance zones by dynamically calculating key Fibonacci retracement levels (23.6%, 38.2%, 50%, 61.8%, 78.6%). The system uses a 100-period lookback window to determine the highest and lowest points, which serve as the basis for calculating retracement levels. The strategy incorporates precise entry signals and risk management mechanisms, triggering trading signals at key Fibonacci level breakouts.
Strategy Principles
The core logic is built on the theory that prices tend to reverse near key Fibonacci retracement levels during major trends. Specifically:
- The system continuously calculates highs and lows through a rolling window, ensuring dynamic updates of retracement levels
- Long signals are triggered when price breaks above the 61.8% retracement level, indicating trend continuation
- Bearish signals are identified when price breaks below the 38.2% retracement level
- Take-profit is set at 100% retracement (highest point), stop-loss at 0% retracement (lowest point)
- The strategy uses plot functions to mark key levels on the chart for visual analysis
Strategy Advantages
- Strong Dynamic Adaptability - Strategy automatically adjusts retracement levels based on market conditions
- Comprehensive Risk Management - Strict risk control through preset stop-loss and take-profit levels
- Clear Objective Signals - Entry and exit signals based on objective price breakouts, reducing subjective judgment
- High Visualization - Clear display of key price levels on charts for analysis and verification
- Parameter Adjustability - Lookback period and Fibonacci levels can be flexibly adjusted as needed
Risk Analysis
- Sideways Market Risk - May generate false signals during consolidation phases
- Lag Risk - Calculations based on historical data may lead to delayed signals
- Gap Risk - Price gaps may cause stop-loss failures
- Parameter Sensitivity - Different lookback period settings affect strategy performance
Recommended risk control measures:
- Confirm market environment with trend indicators
- Adjust stop-loss positions appropriately
- Implement trailing stops
- Regular parameter optimization
Strategy Optimization Directions
- Add trend filters to trade only in clear trends
- Incorporate volume confirmation signals
- Optimize stop-loss/take-profit mechanisms, such as implementing trailing stops
- Add market volatility filtering conditions
- Develop adaptive lookback period adjustment mechanisms
Summary
This is a systematic trading strategy built on classic technical analysis theory. Its programmatic implementation provides objectivity and repeatability. The core advantage lies in combining Fibonacci theory with strict risk control, suitable for trending markets. Through continuous optimization and improvement, the strategy has the potential to maintain stable performance across various market conditions.
- 1