Novato, comprueba Te llevará al comercio cuantitativo de criptomonedas (5)
El autor:No lo sé., Creado: 2022-04-18 17:20:53, Actualizado: 2022-04-18 17:30:27Novato, comprueba Te llevará al comercio cuantitativo de criptomonedas (5)
En el último artículo, explicamos el análisis de la lógica de negociación de una estrategia de cuadrícula simple.
-
Análisis de la lógica de negociación Como mencionamos en el artículo anterior, siempre y cuando cruces cada línea de la cuadrícula de la cuadrícula y juzgues que el precio actual cruza la línea de la cuadrícula hacia arriba o hacia abajo, la acción de negociación puede activarse.
El primer detalle que tenemos que considerar es el diseño de la red infinita.
createNetEsta función genera una estructura de datos de red con un número finito de líneas de red. Entonces, ¿qué pasa si, cuando la estrategia se ejecuta, el precio va más allá de los límites de esta estructura de datos de red (más allá de la línea de red superior donde el precio es más alto, y la línea de red inferior donde el precio es más bajo)? Así que primero necesitamos añadir un mecanismo de extensión a la estructura de datos de la red.Comience a escribir la función principal de la estrategia, y la función principal es el código donde la estrategia comienza a ejecutarse.
var diff = 50                                 // global variable, the grid interval, can be designed as parameter; for an easy explanation, we write it in an infinite loop
function main() {
    // After the bot starts running, execute the strategy code from here
    var ticker = _C(exchange.GetTicker)       // obtain the latest ticker data in the market; for the ticker data structure, you can refer to FMZ API documentation: https://www.fmz.com/api#ticker
    var net = createNet(ticker.Last, diff)    // the function to initially construct the grid data structure we designed in the previous article; here we construct a grid data structure net

    while (true) {                            // then, the program logic enters the while infinite loop, and the strategy will repeatedly execute the code within the {} symbol from here
        ticker = _C(exchange.GetTicker)       // the first line of the infinite loop code gets the latest market quote data, and updates it to the variable ticker
        // check the grid range
        while (ticker.Last >= net[net.length - 1].price) {
            net.push({
                buy : false,
                sell : false,
                price : net[net.length - 1].price + diff,
            })
        }
        while (ticker.Last <= net[0].price) {
            var price = net[0].price - diff
            if (price <= 0) {
                break
            }
            net.unshift({
                buy : false,
                sell : false,
                price : price,
            })
        }

        // the code is not completed...
    }
}
Es el código que hace que la estructura de datos de la red sea extensible (extraído del código anterior):
      // check the grid range
      while (ticker.Last >= net[net.length - 1].price) {   // if the price exceeds the grid line with the highest price in the grid,
          net.push({                                       // add a new grid line after the grid line with the highest price in the grid
              buy : false,                                 // initialize the sell mark
              sell : false,                                // initialize the buy mark
              price : net[net.length - 1].price + diff,    // add a grid interval on the basis of the previous highest price
          })
      }
      while (ticker.Last <= net[0].price) {                // if the price is lower than the grid line with the lowest price in the grid,
          var price = net[0].price - diff                  // distinguished from adding upwards, you should notice the price of the newly added grid line downwards cannot be less than or equal to 0, so you need to judge here
          if (price <= 0) {                                // do not add when the price is less than or equal to 0, and break the loop
              break
          }
          net.unshift({                                    // add a new grid line before the grid line with the lowest price in the grid
              buy : false,
              sell : false,
              price : price,
          })
      }
A continuación, debemos considerar cómo implementar el activador de negociación.
var diff = 50
var amount = 0.002       // add a global variable, which can also be designed as a parameter; for easy explanation, we can write it in an infinite loop
                         // the parameter controls the trading amount on the grid line each time the trading is triggered
function main() {
    var ticker = _C(exchange.GetTicker)
    var net = createNet(ticker.Last, diff)
    var preTicker = ticker       // before the start of the main (infinite) loop, set a variable, to record the market quotes of last time
    while (true) {
        ticker = _C(exchange.GetTicker)
        // check the grid range
        while (ticker.Last >= net[net.length - 1].price) {
            net.push({
                buy : false,
                sell : false,
                price : net[net.length - 1].price + diff,
            })
        }
        while (ticker.Last <= net[0].price) {
            var price = net[0].price - diff
            if (price <= 0) {
                break
            }
            net.unshift({
                buy : false,
                sell : false,
                price : price,
            })
        }

        // index the grid
        for (var i = 0 ; i < net.length ; i++) {     // traverse all grid lines in the grid data structure
            var p = net[i]
            if (preTicker.Last < p.price && ticker.Last > p.price) {         // upcross, and sell; when the current node has been traded, no matter SELL or BUY, no more trade
                if (i != 0) {
                    var downP = net[i - 1]
                    if (downP.buy) {
                        exchange.Sell(-1, amount, ticker)
                        downP.buy = false
                        p.sell = false
                        continue
                    }
                }
                if (!p.sell && !p.buy) {
                    exchange.Sell(-1, amount, ticker)
                    p.sell = true
                }
            } else if (preTicker.Last > p.price && ticker.Last < p.price) {  // downcross, and buy
                if (i != net.length - 1) {
                    var upP = net[i + 1]
                    if (upP.sell) {
                        exchange.Buy(-1, amount * ticker.Last, ticker)
                        upP.sell = false
                        p.buy = false
                        continue
                    }
                }
                if (!p.buy && !p.sell) {
                    exchange.Buy(-1, amount * ticker.Last, ticker)
                    p.buy = true
                }
            }
        }
        preTicker = ticker    // record the current market quotes in preTicker, which will be used as the "last" market quote data to compare with the new one in next loop, to judge upcross and downcross
        Sleep(500)
    }
}
Puedes ver:
- Condición de cruce de la línea de red:
preTicker.Last < p.price && ticker.Last > p.price - Condición de cruce de la línea de red:
preTicker.Last > p.price && ticker.Last < p.price
Esto es de lo que hablamos en el artículo anterior:
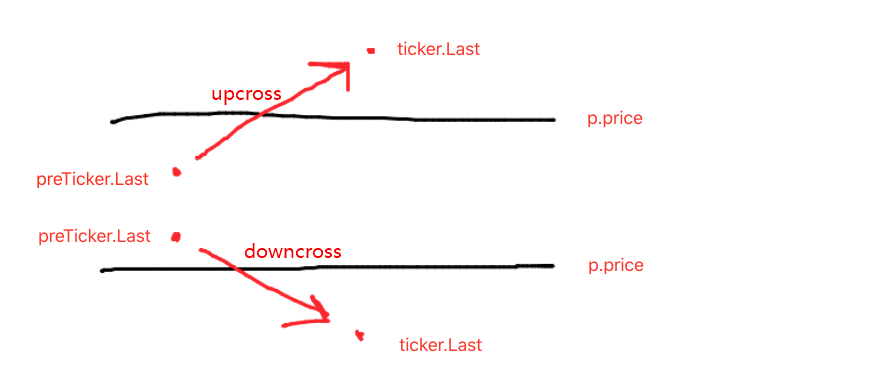
Juzgar de forma ascendente o descendente es sólo el primer paso para determinar si ordenar y negociar, y también es necesario juzgar la marca en los datos de la línea de la red.
Si es upcross, entonces juzgue si el precio es menor que la línea de la red actual, así como la marca de compra en la última línea de la red; si el valor de la marca de compra es verdadero, eso significa que la última línea de la red ejecutada compra, y restablezca la marca de compra de la última línea de la red como falsa, y restablezca la marca de venta de la línea de la red actual como falsa.
Si la marca de compra y la marca de venta de la línea de red actual son falsas, eso significa que la línea de red actual puede operar; porque es upcross, aquí ejecutamos la operación de venta, y marcamos la marca de venta de la línea de red como verdadera después de la ejecución.
La lógica de procesamiento de la cruz descendente es la misma (los novatos pueden pensar en esto por sí mismos).
- Condición de cruce de la línea de red:
Prueba de retroceso de la estrategia completa
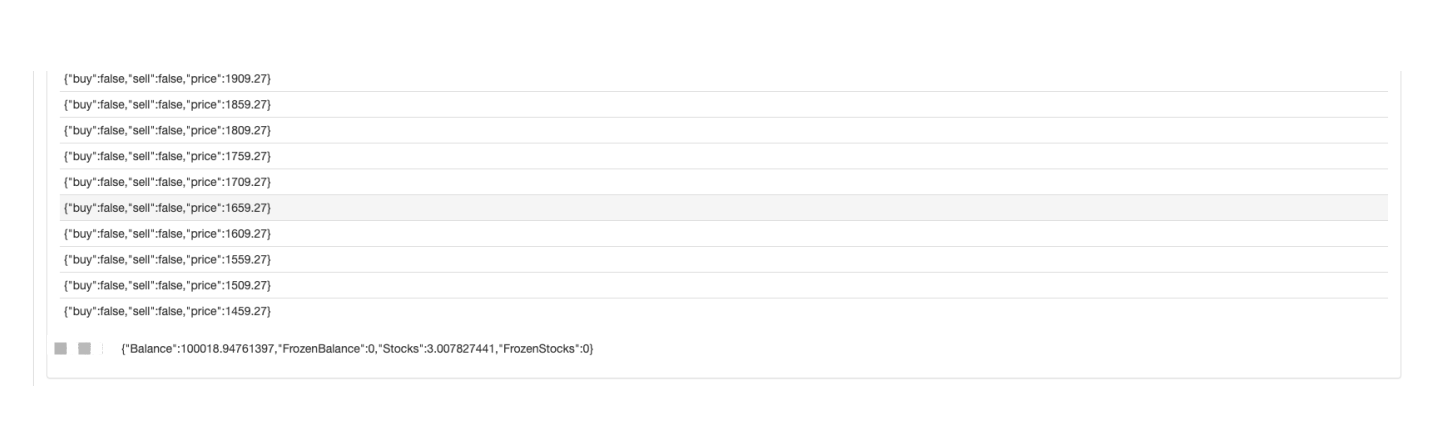
Para ver algunos datos durante backtest, una funciónshowTblse escribe para mostrar los datos.
function showTbl(arr) {
    var tbl = {
        type : "table",
        title : "grid",
        cols : ["grid information"],
        rows : []
    }
    var arrReverse = arr.slice(0).reverse()
    _.each(arrReverse, function(ele) {
        var color = ""
        if (ele.buy) {
            color = "#FF0000"
        } else if (ele.sell) {
            color = "#00FF00"
        }
        tbl.rows.push([JSON.stringify(ele) + color])
    })
    LogStatus(_D(), "\n`" + JSON.stringify(tbl) + "`", "\n account information:", exchange.GetAccount())
}
Código completo de la estrategia:
/*backtest
start: 2021-04-01 22:00:00
end: 2021-05-22 00:00:00
period: 1d
basePeriod: 1m
exchanges: [{"eid":"OKEX","currency":"ETH_USDT","balance":100000}]
*/

var diff = 50
var amount = 0.002
function createNet(begin, diff) {
    var oneSideNums = 10
    var up = []
    var down = []
    for (var i = 0 ; i < oneSideNums ; i++) {
        var upObj = {
            buy : false,
            sell : false,
            price : begin + diff / 2 + i * diff,
        }
        up.push(upObj)

        var j = (oneSideNums - 1) - i
        var downObj = {
            buy : false,
            sell : false,
            price : begin - diff / 2 - j * diff,
        }
        if (downObj.price <= 0) {  // the price cannot be less than or equal to 0
            continue
        }
        down.push(downObj)
    }

    return down.concat(up)
}

function showTbl(arr) {
    var tbl = {
        type : "table",
        title : "grid",
        cols : ["grid information"],
        rows : []
    }
    var arrReverse = arr.slice(0).reverse()
    _.each(arrReverse, function(ele) {
        var color = ""
        if (ele.buy) {
            color = "#FF0000"
        } else if (ele.sell) {
            color = "#00FF00"
        }
        tbl.rows.push([JSON.stringify(ele) + color])
    })
    LogStatus(_D(), "\n`" + JSON.stringify(tbl) + "`", "\n account information:", exchange.GetAccount())
}

function main() {
    var ticker = _C(exchange.GetTicker)
    var net = createNet(ticker.Last, diff)
    var preTicker = ticker
    while (true) {
        ticker = _C(exchange.GetTicker)
        // check the grid range
        while (ticker.Last >= net[net.length - 1].price) {
            net.push({
                buy : false,
                sell : false,
                price : net[net.length - 1].price + diff,
            })
        }
        while (ticker.Last <= net[0].price) {
            var price = net[0].price - diff
            if (price <= 0) {
                break
            }
            net.unshift({
                buy : false,
                sell : false,
                price : price,
            })
        }

        // index grid
        for (var i = 0 ; i < net.length ; i++) {
            var p = net[i]
            if (preTicker.Last < p.price && ticker.Last > p.price) {         // upcross, and sell; when the current node has been traded, no matter SELL or BUY, no more trade
                if (i != 0) {
                    var downP = net[i - 1]
                    if (downP.buy) {
                        exchange.Sell(-1, amount, ticker)
                        downP.buy = false
                        p.sell = false
                        continue
                    }
                }
                if (!p.sell && !p.buy) {
                    exchange.Sell(-1, amount, ticker)
                    p.sell = true
                }
            } else if (preTicker.Last > p.price && ticker.Last < p.price) {  // downcross, and buy
                if (i != net.length - 1) {
                    var upP = net[i + 1]
                    if (upP.sell) {
                        exchange.Buy(-1, amount * ticker.Last, ticker)
                        upP.sell = false
                        p.buy = false
                        continue
                    }
                }
                if (!p.buy && !p.sell) {
                    exchange.Buy(-1, amount * ticker.Last, ticker)
                    p.buy = true
                }
            }
        }

        showTbl(net)
        preTicker = ticker
        Sleep(500)
    }
}
Estrategia de prueba de retroceso:
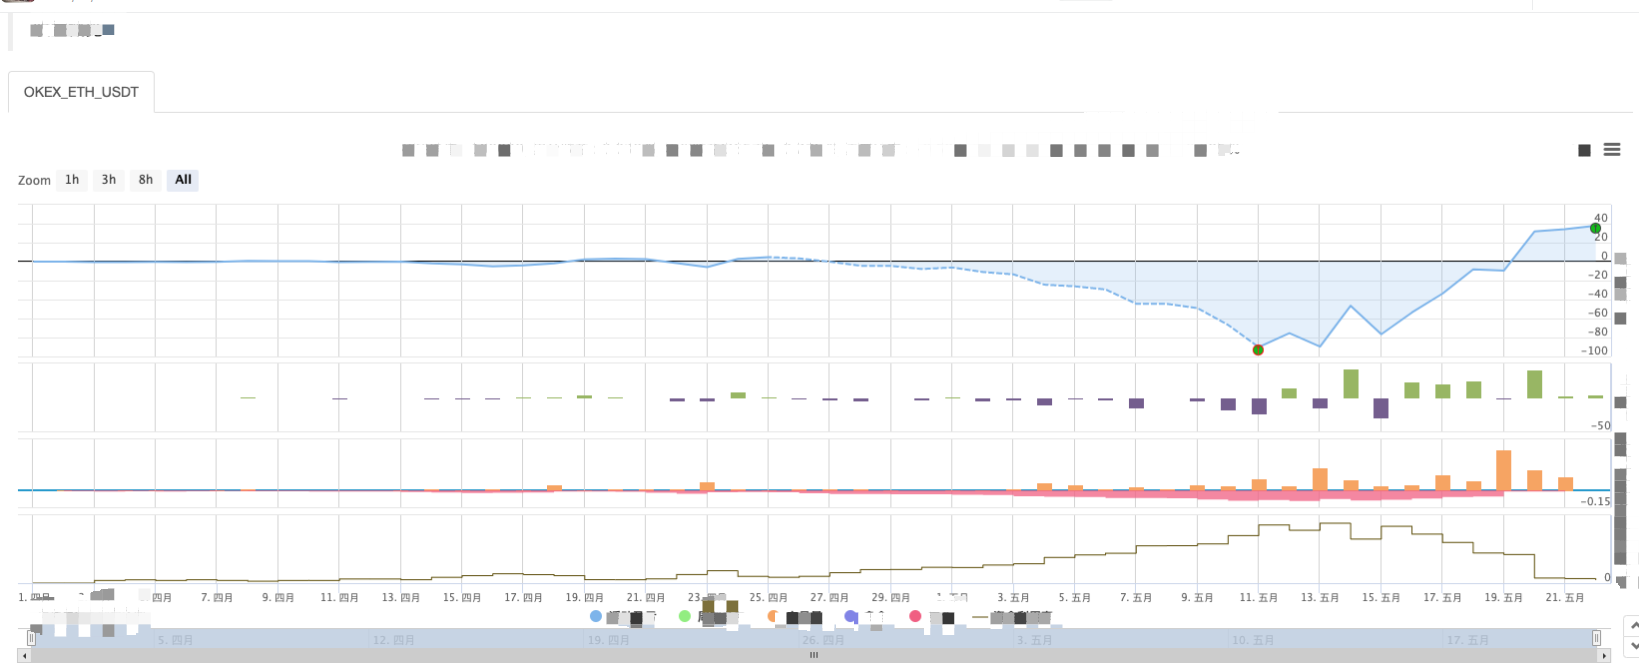
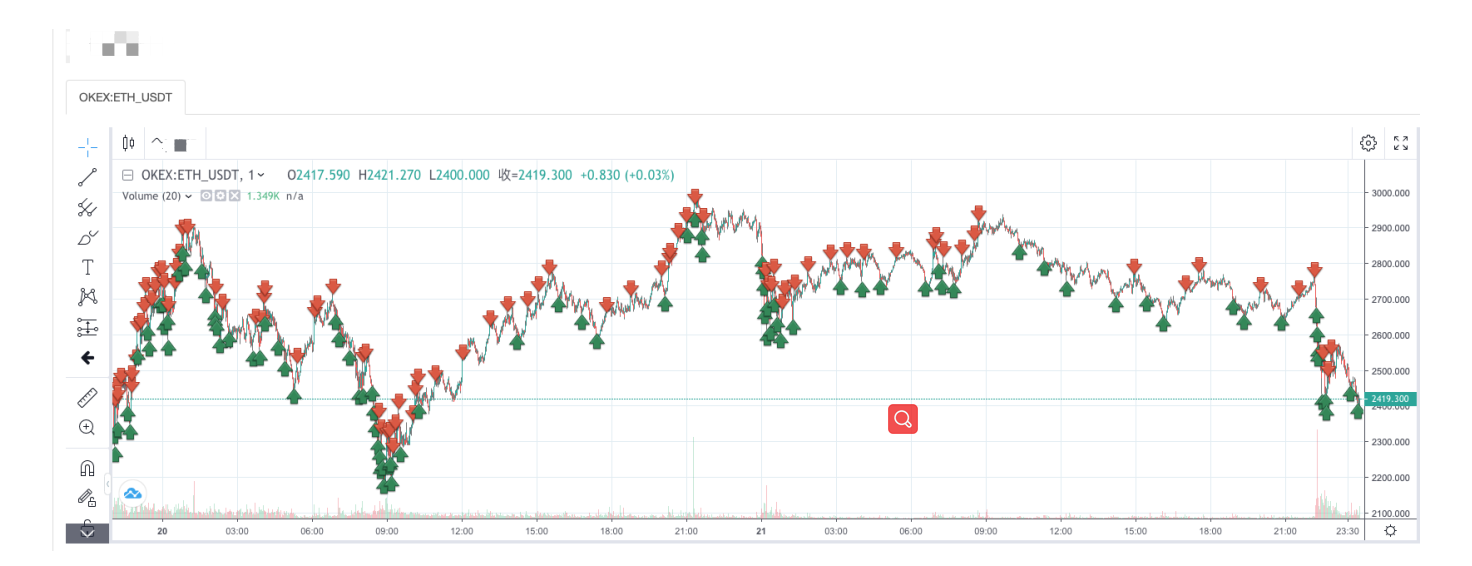
Pueden ver las características de la estrategia de la red. Cuando hay un mercado de tendencia, habrá una gran pérdida flotante, y el retorno se recuperará en un mercado volátil. Por lo tanto, la estrategia de red no está exenta de riesgos. La estrategia al contado todavía puede mantenerse para igualarlo, mientras que la estrategia de red de los contratos de futuros es más arriesgada y necesita establecer los parámetros de la red de manera conservadora.
- ¿Cómo se escribe aquí para que haya una señal?
- Se aplicarán las siguientes condiciones:
- Utilice SQLite para construir la base de datos cuántica FMZ
- Novato, comprueba
Te llevará al comercio cuantitativo de criptomonedas (8) - Novato, comprueba
Te llevará al comercio cuantitativo de criptomonedas (7) - Novato, comprueba
Te llevará al comercio cuantitativo de criptomonedas (6) - Novato, comprueba
Te llevará al comercio cuantitativo de criptomonedas (3) - Novato, comprueba
Te llevará al comercio cuantitativo de criptomonedas (2) - Mi inventor tiene el tiempo equivocado.
- ¡Damos ideas para la estrategia de escritura de Dios!
- Novato, comprueba
Te llevará al comercio cuantitativo de criptomonedas (4) - Tiempo de creación y tiempo de finalización de la orden
- Las estrategias de la red de compra de Martin
- Los hermanos que entienden mi lenguaje, ayúdame a interpretar el código que significa _TR:=MAX(MAX((HIGH-LOW),ABS(REF(CLOSE,1)-HIGH)),ABS ((REF(CLOSE,1)-LOW));
- Las preguntas de error en el disco real
- Novato, comprueba
Te llevará al comercio cuantitativo de criptomonedas (1) - ¿Se puede añadir soporte para Typescript?
- Estrategia de cobertura al contado de criptomonedas (2)
- Estrategia de cobertura al contado de criptomonedas (1)
- En la API de Bitget, los problemas se presentan cuando las transacciones que se registran se colocan en ADA, AVAX, AXS, BCH, DOT, EOS, ETC, FIL, LINK, LTC, LUNA, MATIC, SOL, XRP.