Novato, comprueba Te llevará al comercio cuantitativo de criptomonedas (7)
El autor:No lo sé., Creado: 2022-04-22 11:59:32, Actualizado: 2022-04-22 12:01:11Novato, comprueba Te llevará al comercio cuantitativo de criptomonedas (7)
En el último artículo, hemos pensado y diseñado una estrategia de cuadrícula de símbolos múltiples simple juntos. A continuación, continuaremos aprendiendo y avanzando en el camino del comercio cuantitativo. En este artículo, discutiremos un diseño de estrategia más complicado: el diseño de la estrategia de cobertura. El artículo planea diseñar una estrategia de cobertura de período cruzado de símbolos múltiples. Cuando se trata de estrategia de cobertura de período cruzado, aquellos que están familiarizados con el comercio de futuros deben estar familiarizados con ella. Para los principiantes, es posible que no entiendan estos conceptos, así que explicemos brevemente los conceptos sobre la cobertura de período cruzado.
Cubierta de tiempo cruzado
En términos generales, la cobertura transversal tiene un contrato de hacer largo y un contrato de hacer corto, y espera tres situaciones (largas, cortas) para cerrar posiciones al mismo tiempo:
- Cuando hacer largo es rentable, hacer corto tiene una pérdida, y la ganancia es más que la pérdida, cerrar posiciones; habrá un retorno después de que la ganancia cubra la pérdida.
- Cuando hacer corto es rentable, hacer largo tiene una pérdida, y la ganancia es mayor que la pérdida, posiciones cerradas; habrá un rendimiento después de que la ganancia cubra la pérdida. (similar)
- Cuando hacer largo es rentable, y hacer corto también es rentable, no dude en cerrar posiciones!
Para otras situaciones en las que hay pérdidas flotantes, puede mantener o continuar agregando más posiciones. (porque la fluctuación del diferencial es más leve que la fluctuación unilateral, el riesgo será menor, pero tenga en cuenta que es solo comparativo!)
Set A1 as the price of contract A at the time 1, and set B1 as the price of contract B at the time 1. At the time, do short in contract A, at A1; do long in contract B, at B1.
Set A2 as the price of contract A at the time 2, and set B2 as the price of contract B at the time 2. At the time, close positions (close short) of contract A, at A2; close positions (close long) of contract B, at B2.

Spread at time 1: A1 - B1 = X
Spread at time 2: A2 - B2 = Y
X - Y = A1 - B1 - (A2 - B2)
X - Y = A1 - B1 - A2 + B2
X - Y = A1 - A2 + B2 - B1

As you can see, "A1 - A2 " is the profit spread of closing position in contract A.
"B2 - B1" is the profit spread of closing position in contract B. It is profitable, as long as the closing postion spread of the two contracts is a positive number, namely A1 - A2 + B2 - B1 > 0. That is to say as long as X - Y > 0,
for: X - Y = A1 - A2 + B2 - B1

It is concluded that as long as the spread X when opening a position is greater than the spread Y when closing a position, it is profitable (note that it is making short in contract A and making long in contract B to open a position; if the situation is reversed, the result will be opposite). Of course, this is just theoretical, and factors such as the handling fee and slippoint should also be considered in practice.
Debido a que las plataformas de criptomonedas tienen contratos de entrega y contratos perpetuos. Y el precio de los contratos perpetuos siempre está cerca del precio spot debido a la tasa de financiación. Luego elegimos usar contratos de entrega y contratos perpetuos para hacer cobertura y arbitraje. Para el contrato de entrega, podemos elegir uno con un período relativamente largo, para que el contrato de cobertura no necesite establecerse con frecuencia.
Calentarse con algunas estadísticas de propagación de símbolos múltiples
Una vez que esté familiarizado con el principio básico, no tiene que apresurarse a escribir la estrategia. Primero, haga estadísticas de propagación, gráficos de gráficos y observe los propagandos. Aprendamos sobre la estrategia de gráficos de símbolos múltiples juntos. Lo diseñamos basándonos enContrato de OKEX. Es muy fácil de trazar en FMZ, y sólo necesita utilizar la función encapsulada, con la biblioteca de gráficosLas tablas de mayor importancia. La descripción de la función de trazado en la documentación de la API:https://www.fmz.com/api#chart..¿ Qué pasa? Dado que es una estrategia de símbolos múltiples, en primer lugar, es necesario determinar el margen de precios de esos símbolos antes de trazar.
var arrSwapContractType = ["BTC-USDT-SWAP", "LTC-USDT-SWAP", "ETH-USDT-SWAP", "ETC-USDT-SWAP"]   // perpetual contract
var arrDeliveryContractType = ["BTC-USDT-210924", "LTC-USDT-210924", "ETH-USDT-210924", "ETC-USDT-210924"]  // delivery contract
De acuerdo con el código de contrato establecido aquí, inicializa la configuración del gráfico. La configuración del gráfico no se puede escribir en un bucle infinito, porque no sabes qué símbolo hacer, y cuántos símbolos hacer (que se determinan de acuerdo con los valores de arrDeliveryContractType y arrSwapContractType), por lo que la configuración del gráfico se devuelve por una función.
function createCfg(symbol) {
    var cfg = {
        extension: {
            // it is not part of the group, and is individually displayed; the default is 'group'
            layout: 'single',
            // the specified height, which can be set as string; "300px", which means it will be replaced by "300px" automatically through setting a value of 300
            height: 300,
            // the occupied unit value of the specified width, with a total value of 12
            col: 6
        },
        title: {
            text: symbol
        },
        xAxis: {
            type: 'datetime'
        },
        series: [{
            name: 'plus',
            data: []
        }]
    }

    return cfg
}

function main() {
    // declare arrCfg
    var arrCfg = []                                    // declare an array to store the chart configuration information
    _.each(arrSwapContractType, function(ct) {         // iteratively record the array of perpetual contract codes, pass the "XXX-USDT" part of the contract name as a parameter to the "createCfg" function, construct the chart configuration information, and return
        arrCfg.push(createCfg(formatSymbol(ct)[0]))    // the chart configuration information "push" returned by "createCfg" is in the "arrCfg" array
    })
    var objCharts = Chart(arrCfg)                      // call the function Chart on FMZ platform, and create a chart controlled object called objCharts
    objCharts.reset()                                  // initialize the chart content

    // the rest is omitted...
}
Vamos a preparar los datos; utilizamos la interfaz de mercado agregada del contrato OKEX:
Contrato perpetuo en USDT:
https://www.okex.com/api/v5/market/tickers?instType=SWAP
Contrato de entrega en USDT:
https://www.okex.com/api/v5/market/tickers?instType=FUTURES
Aquí escribimos una función para tratar la invocación de las dos interfaces, y procesar los datos en un formato:
function getTickers(url) {
    var ret = []
    try {
        var arr = JSON.parse(HttpQuery(url)).data
        _.each(arr, function(ele) {
            ret.push({
                bid1: parseFloat(ele.bidPx),             // buy one price
                bid1Vol: parseFloat(ele.bidSz),          // volume of buy one price
                ask1: parseFloat(ele.askPx),             // ell one price
                ask1Vol: parseFloat(ele.askSz),          // volume of sell one price
                symbol: formatSymbol(ele.instId)[0],     // in the format of trading pair
                type: "Futures",                         // type
                originalSymbol: ele.instId               // original contract code
            })
        })
    } catch (e) {
        return null
    }
    return ret
}
Escribe una función más para procesar el código del contrato.
function formatSymbol(originalSymbol) {
    var arr = originalSymbol.split("-")
    return [arr[0] + "_" + arr[1], arr[0], arr[1]]
}
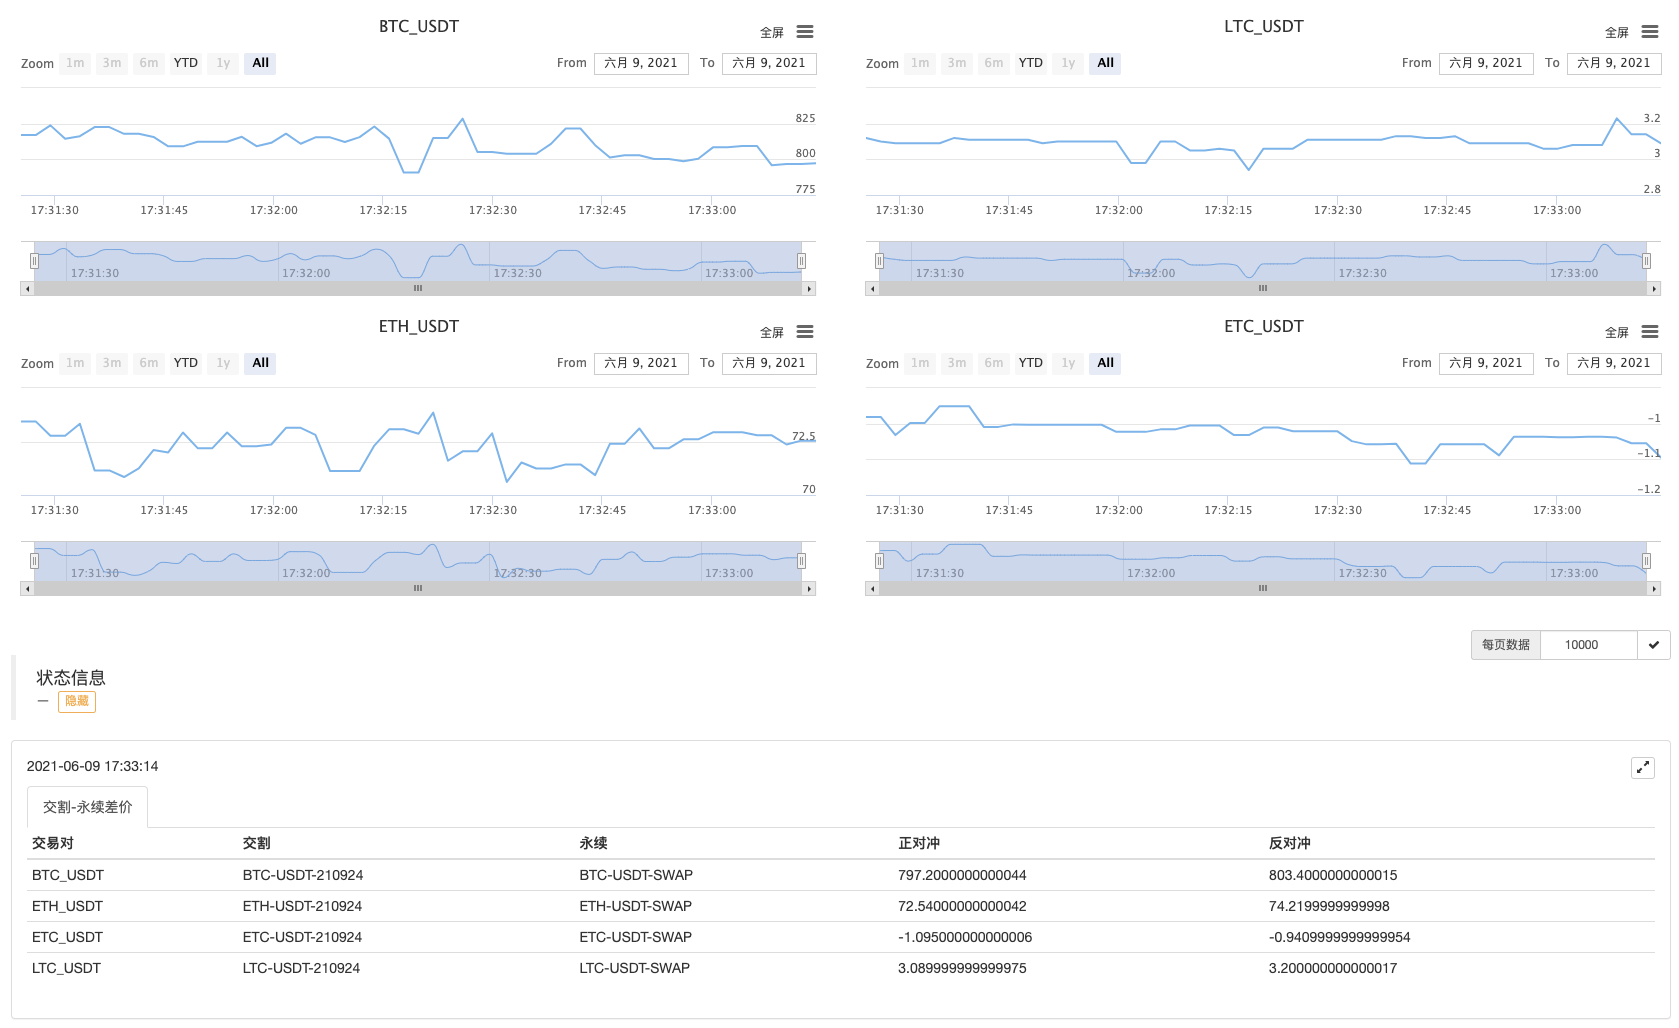
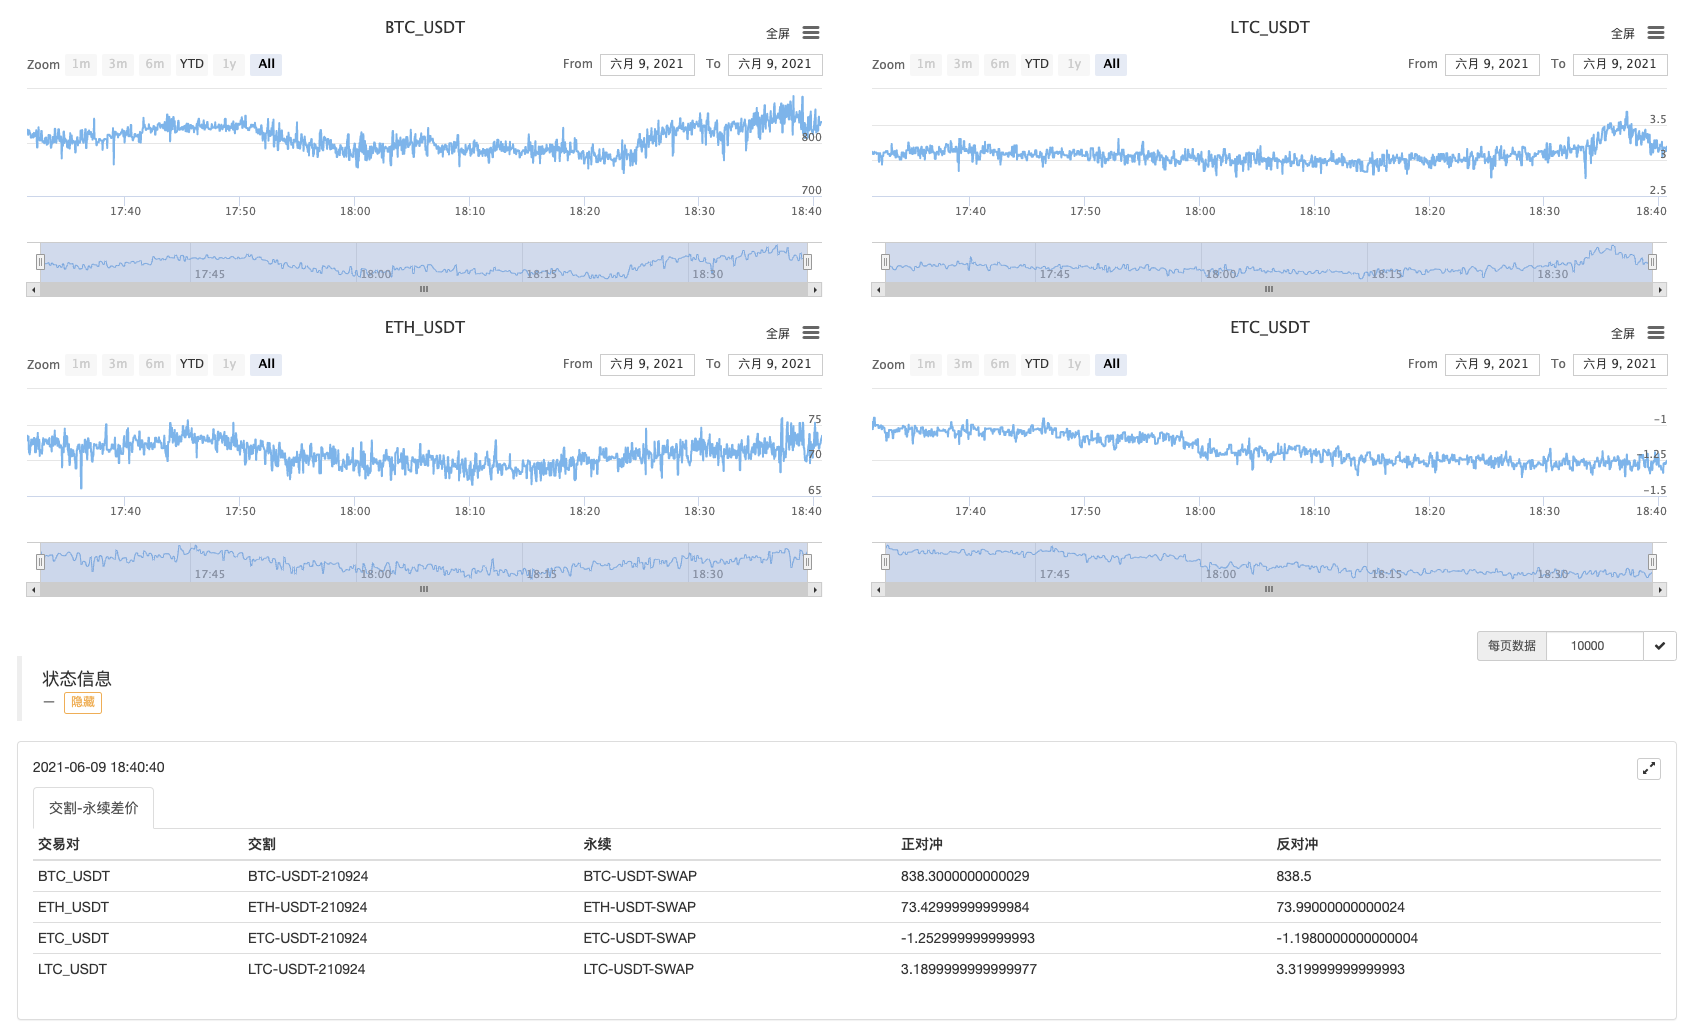
A continuación, sólo tenemos que iterar y coincidir con los datos obtenidos, calcular los diferenciales, y gráficos de gráficos para exportar, etc.
Aquí hemos probado la propagación del contrato del próximo trimestre 210924 y el contrato perpetuo.
Código completo:
// temporary parameters
var arrSwapContractType = ["BTC-USDT-SWAP", "LTC-USDT-SWAP", "ETH-USDT-SWAP", "ETC-USDT-SWAP"]
var arrDeliveryContractType = ["BTC-USDT-210924", "LTC-USDT-210924", "ETH-USDT-210924", "ETC-USDT-210924"]
var interval = 2000

function createCfg(symbol) {
    var cfg = {
        extension: {
            // it is not part of the group, and is individually displayed; the default is 'group'
            layout: 'single',
            // the specified height, which can be set as string; "300px", which means it will be replaced by "300px" automatically through setting a value of 300
            height: 300,
            // the occupied unit value of the specified width, with a total value of 12
            col: 6
        },
        title: {
            text: symbol
        },
        xAxis: {
            type: 'datetime'
        },
        series: [{
            name: 'plus',
            data: []
        }]
    }

    return cfg
}

function formatSymbol(originalSymbol) {
    var arr = originalSymbol.split("-")
    return [arr[0] + "_" + arr[1], arr[0], arr[1]]
}

function getTickers(url) {
    var ret = []
    try {
        var arr = JSON.parse(HttpQuery(url)).data
        _.each(arr, function(ele) {
            ret.push({
                bid1: parseFloat(ele.bidPx),
                bid1Vol: parseFloat(ele.bidSz),
                ask1: parseFloat(ele.askPx),
                ask1Vol: parseFloat(ele.askSz),
                symbol: formatSymbol(ele.instId)[0],
                type: "Futures",
                originalSymbol: ele.instId
            })
        })
    } catch (e) {
        return null
    }
    return ret
}

function main() {
    // declare arrCfg
    var arrCfg = []
    _.each(arrSwapContractType, function(ct) {
        arrCfg.push(createCfg(formatSymbol(ct)[0]))
    })
    var objCharts = Chart(arrCfg)
    objCharts.reset()

    while (true) {
        // obtain the market quote data
        var deliveryTickers = getTickers("https://www.okex.com/api/v5/market/tickers?instType=FUTURES")
        var swapTickers = getTickers("https://www.okex.com/api/v5/market/tickers?instType=SWAP")
        if (!deliveryTickers || !swapTickers) {
            Sleep(2000)
            continue
        }

        var tbl = {
            type : "table",
            title : "delivery-perpetual spread",
            cols : ["trading pair", "delivery", "perpetual", "positive hedge", "negative hedge"],
            rows : []
        }

        var subscribeDeliveryTickers = []
        var subscribeSwapTickers = []
        _.each(deliveryTickers, function(deliveryTicker) {
            _.each(arrDeliveryContractType, function(symbol) {
                if (deliveryTicker.originalSymbol == symbol) {
                    subscribeDeliveryTickers.push(deliveryTicker)
                }
            })
        })
        _.each(swapTickers, function(swapTicker) {
            _.each(arrSwapContractType, function(symbol) {
                if (swapTicker.originalSymbol == symbol) {
                    subscribeSwapTickers.push(swapTicker)
                }
            })
        })

        var pairs = []
        var ts = new Date().getTime()
        _.each(subscribeDeliveryTickers, function(deliveryTicker) {
            _.each(subscribeSwapTickers, function(swapTicker) {
                if (deliveryTicker.symbol == swapTicker.symbol) {
                    var pair = {symbol: swapTicker.symbol, swapTicker: swapTicker, deliveryTicker: deliveryTicker, plusDiff: deliveryTicker.bid1 - swapTicker.ask1, minusDiff: deliveryTicker.ask1 - swapTicker.bid1}
                    pairs.push(pair)
                    tbl.rows.push([pair.symbol, deliveryTicker.originalSymbol, swapTicker.originalSymbol, pair.plusDiff, pair.minusDiff])
                    for (var i = 0 ; i < arrCfg.length ; i++) {
                        if (arrCfg[i].title.text == pair.symbol) {
                            objCharts.add([i, [ts, pair.plusDiff]])
                        }
                    }
                }
            })
        })

        LogStatus(_D(), "\n`" + JSON.stringify(tbl) + "`")
        Sleep(interval)
    }
}
Operación del bot
Huye por un tiempo.
¡Observa primero las extensiones!
- Análisis de la estrategia de cosecha de beneficios (1)
- ¿Cuál de las funciones que afectan a esto es la que se necesita cambiar?
- Añadir Stoploss para controlar los riesgos
Cuál es el precio - Discusión sobre el diseño de estrategias de alta frecuencia
Magicamente modificado cosechador de ganancias - Arbitraje de la tasa de financiación perpetua de Binance (100% de la tasa anualizada en el mercado alcista)
- Utilice la interfaz de mercado agregada de la plataforma de criptomonedas para construir una estrategia de símbolos múltiples
- ¿Cómo se escribe aquí para que haya una señal?
- Se aplicarán las siguientes condiciones:
- Utilice SQLite para construir la base de datos cuántica FMZ
- Novato, comprueba
Te llevará al comercio cuantitativo de criptomonedas (8) - Novato, comprueba
Te llevará al comercio cuantitativo de criptomonedas (6) - Novato, comprueba
Te llevará al comercio cuantitativo de criptomonedas (3) - Novato, comprueba
Te llevará al comercio cuantitativo de criptomonedas (2) - Mi inventor tiene el tiempo equivocado.
- ¡Damos ideas para la estrategia de escritura de Dios!
- Novato, comprueba
Te llevará al comercio cuantitativo de criptomonedas (5) - Novato, comprueba
Te llevará al comercio cuantitativo de criptomonedas (4) - Tiempo de creación y tiempo de finalización de la orden
- Las estrategias de la red de compra de Martin
- Los hermanos que entienden mi lenguaje, ayúdame a interpretar el código que significa _TR:=MAX(MAX((HIGH-LOW),ABS(REF(CLOSE,1)-HIGH)),ABS ((REF(CLOSE,1)-LOW));