
Esta estrategia se basa en el índice de movimiento de las medias planas y el índice relativamente fuerte, diseñó un mecanismo de seguimiento de doble tendencia, que puede determinar con precisión la tendencia de la tendencia y establecer un punto de parada razonable. La estrategia tiene características como el seguimiento de la tendencia del punto de parada y el punto de parada de acuerdo con la tendencia y el juicio de doble tendencia.
Calcula el Super Trend para determinar la dirección de la tendencia principal. El Super Trend permite determinar la dirección de la tendencia con precisión y proporciona el punto de entrada ideal.
El RSI es un indicador de tendencia que ayuda a determinar la tendencia. Cuando el RSI es alto, es una zona de sobrecompra, lo que significa una tendencia alcista. Cuando el RSI es bajo, es una zona de sobreventa, lo que significa una tendencia bajista.
Haga más cuando el precio de cierre cruza la media móvil del índice de movimiento plano de los superpotentes; y haga menos cuando el precio de cierre cae por debajo de la media móvil del índice de movimiento plano de los superpotentes.
Establezca un punto de parada de pérdida razonable. Al hacer más, use el promedio móvil de deslizamiento del índice súper fuerte como punto de parada de pérdida, con el promedio móvil de deslizamiento del índice súper fuerte más el punto de parada de ganancias razonables; al hacer vacío, use el promedio móvil de deslizamiento del índice súper fuerte como punto de parada de pérdida, con el promedio móvil de deslizamiento del índice súper fuerte menos el punto de parada de ganancias razonables.
Los puntos de parada se mueven con la fluctuación de la situación. Si la situación es favorable, la línea de parada se mueve en la dirección favorable, asegurando la ganancia.
Cuando el RSI coincide con la dirección de las medias móviles de las superpotencias, indica que la tendencia actual es fuerte y la estrategia entra en juego. Cuando el RSI no coincide con la dirección de las medias móviles de las superpotencias, indica la posibilidad de un giro de tendencia y la estrategia se retira temporalmente.
El mecanismo de doble juicio de tendencias reduce las señales falsas y aumenta la estabilidad de la estrategia.
El punto de parada se mueve con la tendencia, lo que permite bloquear al máximo las ganancias y evitar la pérdida prematura.
El uso del indicador RSI puede filtrar algunas señales de comercio débiles.
La posición de la parada debe ser razonable para maximizar el beneficio.
Los parámetros de la estrategia son ajustables y se pueden optimizar en función de las diferentes variedades y características de la situación.
La estrategia de retroceso es controlada y tiene una mayor capacidad de gestión de riesgos.
En caso de un evento inesperado, como un anuncio de política importante, el mercado puede fluctuar fuertemente, lo que puede provocar que se rompa el punto de parada y se produzcan grandes pérdidas. Se puede relajar el punto de parada adecuadamente o salir de la pista a tiempo antes de que ocurra un evento de riesgo importante.
La configuración incorrecta de los parámetros puede provocar la configuración inadecuada de los puntos de parada, ampliando las pérdidas o reduciendo las ganancias. Se puede encontrar la combinación óptima de parámetros mediante la prueba de retorno repetida.
Durante la fase de la guerra de la multispacio, el RSI y el índice súper fuerte pueden desviarse del promedio móvil liso, lo que puede generar una señal de negociación errónea para la estrategia. En este momento, puede dejar de comerciar temporalmente y esperar a que la tendencia sea clara.
Optimización de los parámetros del ciclo ATR para adaptarlo a las características de las diferentes variedades.
Optimizar la configuración de los parámetros del RSI para encontrar condiciones de determinación de tendencias auxiliares más estables y confiables.
En combinación con otros indicadores de juicio, como el cinturón de Bryn, KDJ, etc., se establece una base de entrada y salida más precisa.
Prueba diferentes estrategias de frenado, como frenado de seguimiento, frenado de escalera, frenado de línea de sombra, etc., para optimizar el nivel de ganancias.
Ajuste la estrategia de gestión de posiciones según los resultados de la retroalimentación para reducir el riesgo de una sola transacción.
La estrategia en su conjunto tiene una gran estabilidad y capacidad de rentabilidad continua. El mecanismo de doble juicio de tendencias puede filtrar el ruido de manera efectiva, y la estrategia de parada de pérdidas puede bloquear las ganancias y controlar el riesgo. Mediante la optimización continua de la configuración de los parámetros y las condiciones de entrada y salida, la estrategia puede obtener un buen rendimiento en diferentes entornos de mercado.
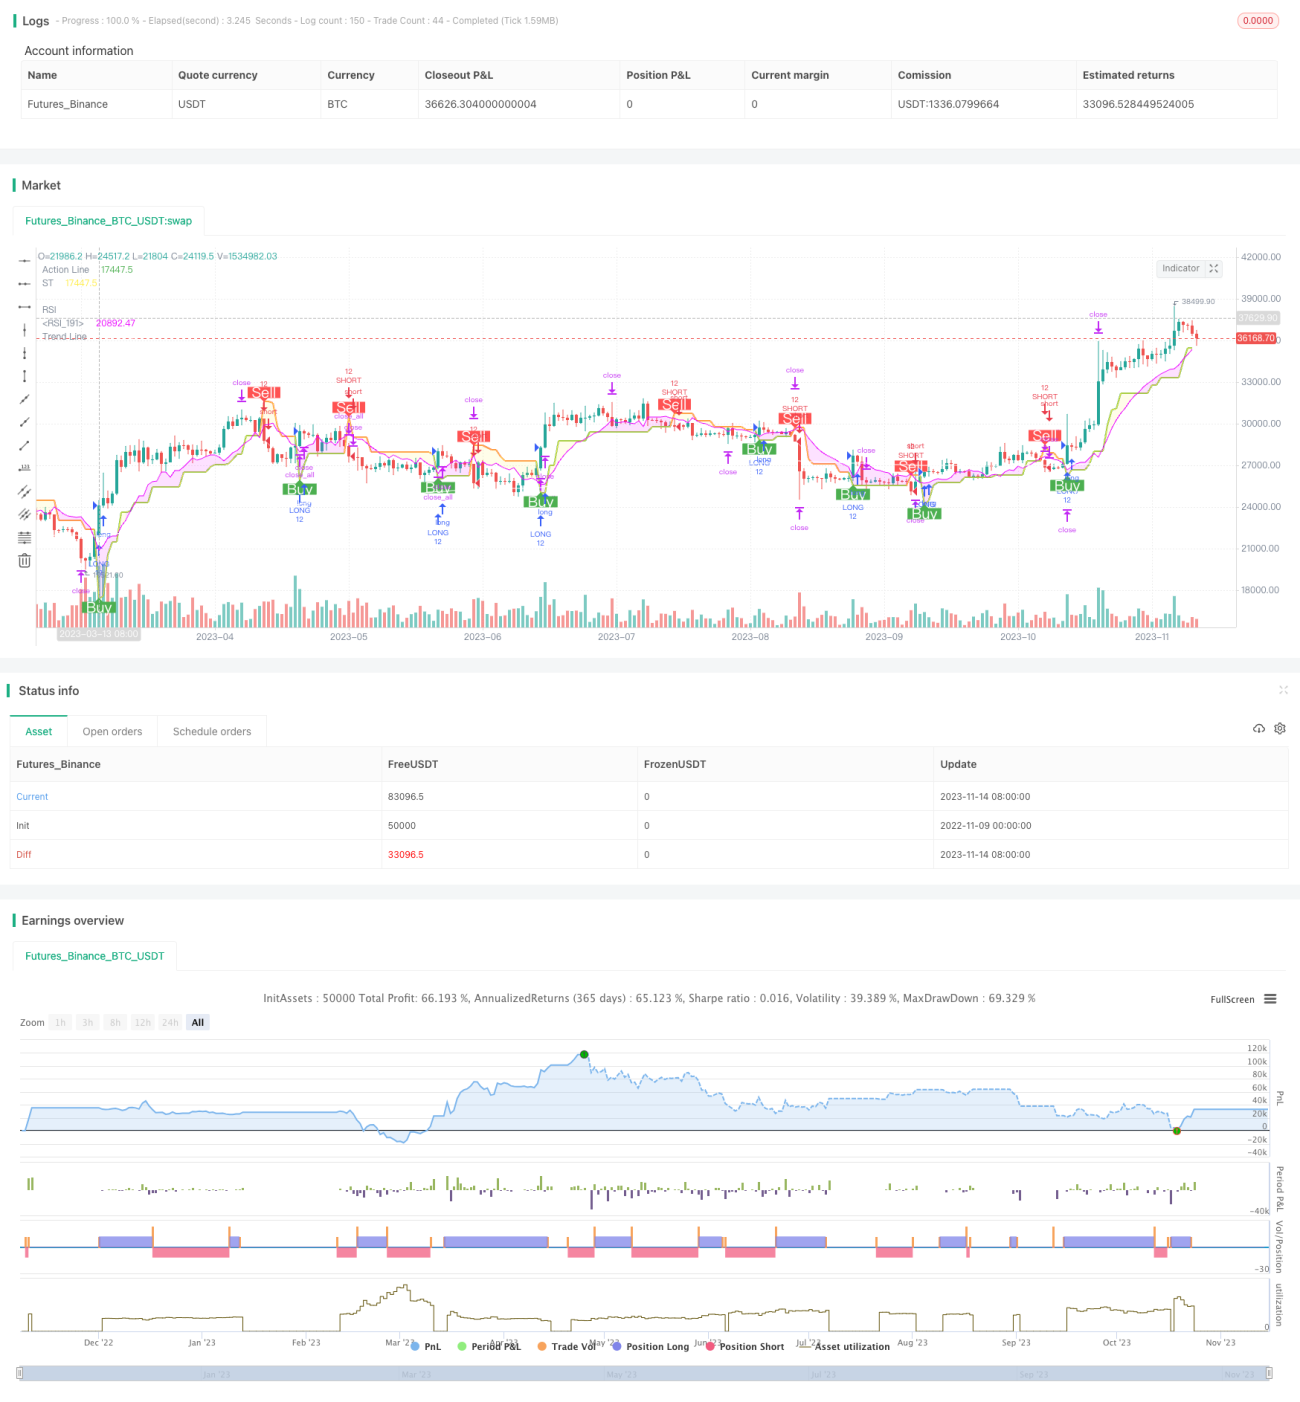
/*backtest
start: 2022-11-09 00:00:00
end: 2023-11-15 00:00:00
period: 1d
basePeriod: 1h
exchanges: [{"eid":"Futures_Binance","currency":"BTC_USDT"}]
*/
//@version=5
//
// ▒▒▒▒▒▒▒▒▒▒▒▒▒▒▒▒▒▒▒▒▒▒▒▒▒▒▒▒▒▒▒▒▒▒▒▒▒▒▒▒▒▒▒▒▒▒▒▒▒▒▒▒▒▒▒▒▒▒▒▒▒▒▒▒▒▒▒▒▒▒▒▒▒▒▒▒▒▒▒▒▒▒▒▒▒▒▒▒▒▒▒▒▒▒▒▒▒▒▒▒▒▒▒▒▒▒▒▒▒▒▒▒▒▒
// -----------------------------------------------------------------------------
// Copyright 2019 Mauricio Pimenta | exit490
// SuperTrend with Trailing Stop Loss script may be freely distributed under the MIT license.
//
// Permission is hereby granted, free of charge,
// to any person obtaining a copy of this software and associated documentation files (the "Software"),
// to deal in the Software without restriction, including without limitation the rights to use, copy, modify, merge,
// publish, distribute, sublicense, and/or sell copies of the Software, and to permit persons to whom the Software is furnished to do so,
// subject to the following conditions:
//
// The above copyright notice and this permission notice shall be included in all copies or substantial portions of the Software.
//
// THE SOFTWARE IS PROVIDED "AS IS", WITHOUT WARRANTY OF ANY KIND,
// EXPRESS OR IMPLIED, INCLUDING BUT NOT LIMITED TO THE WARRANTIES OF MERCHANTABILITY,
// FITNESS FOR A PARTICULAR PURPOSE AND NONINFRINGEMENT. IN NO EVENT SHALL THE AUTHORS OR COPYRIGHT HOLDERS BE LIABLE FOR ANY CLAIM,
// DAMAGES OR OTHER LIABILITY, WHETHER IN AN ACTION OF CONTRACT, TORT OR OTHERWISE, ARISING FROM,
// OUT OF OR IN CONNECTION WITH THE SOFTWARE OR THE USE OR OTHER DEALINGS IN THE SOFTWARE.
//
// -----------------------------------------------------------------------------
//
// Authors: @exit490
// Revision: v1.0.0
// Date: 5-Aug-2019
//
// Description
// ===========
// SuperTrend is a moving stop and reversal line based on the volatility (ATR).
// The strategy will ride up your stop loss when price moviment 1%.
// The strategy will close your operation when the market price crossed the stop loss.
// The strategy will close operation when the line based on the volatility will crossed
//
// The strategy has the following parameters:
//
// INITIAL STOP LOSS - Where can isert the value to first stop.
// POSITION TYPE - Where can to select trade position.
// ATR PERIOD - To select number of bars back to execute calculation
// ATR MULTPLIER - To add a multplier factor on volatility
// BACKTEST PERIOD - To select range.
//
// -----------------------------------------------------------------------------
// Disclaimer:
// 1. I am not licensed financial advisors or broker dealers. I do not tell you
// when or what to buy or sell. I developed this software which enables you
// execute manual or automated trades multplierFactoriplierFactoriple trades using TradingView. The
// software allows you to set the criteria you want for entering and exiting
// trades.
// 2. Do not trade with money you cannot afford to lose.
// 3. I do not guarantee consistent profits or that anyone can make money with no
// effort. And I am not selling the holy grail.
// 4. Every system can have winning and losing streaks.
// 5. Money management plays a large role in the results of your trading. For
// example: lot size, account size, broker leverage, and broker margin call
// rules all have an effect on results. Also, your Take Profit and Stop Loss
// settings for individual pair trades and for overall account equity have a
// major impact on results. If you are new to trading and do not understand
// these items, then I recommend you seek education materials to further your
// knowledge.
//
// YOU NEED TO FIND AND USE THE TRADING SYSTEM THAT WORKS BEST FOR YOU AND YOUR
// TRADING TOLERANCE.
//
// I HAVE PROVIDED NOTHING MORE THAN A TOOL WITH OPTIONS FOR YOU TO TRADE WITH THIS PROGRAM ON TRADINGVIEW.
//
// I accept suggestions to improve the script.
// If you encounter any problems I will be happy to share with me.
// -----------------------------------------------------------------------------
//
// ▒▒▒▒▒▒▒▒▒▒▒▒▒▒▒▒▒▒▒▒▒▒▒▒▒▒▒▒▒▒▒▒▒▒▒▒▒▒▒▒▒▒▒▒▒▒▒▒▒▒▒▒▒▒▒▒▒▒▒▒▒▒▒▒▒▒▒▒▒▒▒▒▒▒▒▒▒▒▒▒▒▒▒▒▒▒▒▒▒▒▒▒▒▒▒▒▒▒▒▒▒▒▒▒▒▒▒▒▒▒▒▒▒▒ //
strategy(title='DEO SESSSION', shorttitle='DEO S', overlay=true, precision=8, calc_on_order_fills=true, calc_on_every_tick=true, backtest_fill_limits_assumption=0, default_qty_type=strategy.percent_of_equity, default_qty_value=100, initial_capital=1000, currency=currency.USD, linktoseries=true)
//
// ▒▒▒▒▒▒▒▒▒▒▒▒▒▒▒▒▒▒▒▒▒▒▒▒▒▒▒▒▒▒▒▒▒▒▒▒▒▒▒▒▒▒▒▒▒▒▒▒▒▒▒▒▒▒▒▒▒▒▒▒▒▒▒▒▒▒▒▒▒▒▒▒▒▒▒▒▒▒▒▒▒▒▒▒▒▒▒▒▒▒▒▒▒▒▒▒▒▒▒▒▒▒▒▒▒▒▒▒▒▒▒▒▒▒ //
// === BACKTEST RANGE ===
backTestSectionFrom = input(title='════════════ FROM ════════════', defval=true)
// selected dates
i_startTime = input(title="START FILTER", defval=timestamp("02 Jan 2023 00:00 +0000"), group="RISK MANAGEMENT", tooltip="Start date & time to begin searching for setups")
i_endTime = input(title="END FILTER", defval=timestamp("12 Dec 2100 00:00 +0000"), group="RISK MANAGEMENT", tooltip="End date & time to stop searching for setups")
afterStartDate = true
//
// ▒▒▒▒▒▒▒▒▒▒▒▒▒▒▒▒▒▒▒▒▒▒▒▒▒▒▒▒▒▒▒▒▒▒▒▒▒▒▒▒▒▒▒▒▒▒▒▒▒▒▒▒▒▒▒▒▒▒▒▒▒▒▒▒▒▒▒▒▒▒▒▒▒▒▒▒▒▒▒▒▒▒▒▒▒▒▒▒▒▒▒▒▒▒▒▒▒▒▒▒▒▒▒▒▒▒▒▒▒▒▒▒▒▒ //
parameterSection = input(title='══════════ STRATEGY ══════════', defval=true)
// === INPUT TO SELECT POSITION ===
positionType = input.string(defval='LONG', title='Position Type', options=['LONG', 'SHORT'])
// === INPUT TO SELECT INITIAL STOP LOSS
initialStopLossPercent = input.float(defval=3.0, minval=0.0, title='Initial Stop Loss')
// === INPUT TO SELECT BARS BACK
barsBack = input(title='ATR Period', defval=1)
// === INPUT TO SELECT MULTPLIER FACTOR
multplierFactor = input.float(title='ATR multplierFactoriplier', step=0.1, defval=3.0)
RSI = input.int(title='RSI', defval=7, minval=1, maxval=100)
calcSection = input(title='══════════ LOT CALC ══════════', defval=true)
accountBalance = input.float(title="ACCOUNT BALANCE", defval=250000, minval=1, group="INPUTS")
entryPrice = input.float(title="ENTRY PRICE", defval=100, minval=1, group="INPUTS")
slPrice = input.float(title="STOP LOSS PRICE", defval=100, minval=1, group="INPUTS")
riskPer = input.float(title="RISK USD", defval=1, minval=0.1, group="INPUTS")
lotSize = input.float(title="LOT SIZE", defval=10, minval=0.1, group="INPUTS")
RiskSize = riskPer
qtyLongTargetPrice = math.abs((RiskSize / ((entryPrice - slPrice) * syminfo.pointvalue)) / lotSize)
trendcSection = input(title='══════════ TREND LINE ══════════', defval=true)
// ema trend
tLen = input.int(200, minval=1, title="Trend Line")
tSrc = input(close, title="Source")
thisEma = ta.ema(tSrc, tLen)
plot(thisEma, title = "Trend Line",color=#ffffff)
MTSection = input(title='══════════ MT LOGIN ══════════', defval=true)
exchange = input.string(defval='MT5', title='EXCHANGE', options=['MT4', 'MT5'])
mtLogin= input.string(defval="", title='MT LOGIN', group = "mt")
mtPassword =input.string(defval='', title='MT PASSWORD', group = "mt")
mtServer =input.string(defval='', title='MT SERVER', group = "mt")
mtIsOn = input.string(defval='ON', title='STRATEGY ON', options=['ON', 'OFF'])
mtEntryMode = input.string(defval='CLOSE OPEN', title='ENTRY MODE', options=['CLOSE OPEN', 'OPEN'])
displaySection = input(title='══════════ DISPLAY LOGIN ══════════', defval=true)
displayTable = input(title="DISPLAY TABLE", defval=false, group = 'PRODUCTION', tooltip = "MAKES YOUR STRATEGY TRIGGER SLOWER")
//
// ▒▒▒▒▒▒▒▒▒▒▒▒▒▒▒▒▒▒▒▒▒▒▒▒▒▒▒▒▒▒▒▒▒▒▒▒▒▒▒▒▒▒▒▒▒▒▒▒▒▒▒▒▒▒▒▒▒▒▒▒▒▒▒▒▒▒▒▒▒▒▒▒▒▒▒▒▒▒▒▒▒▒▒▒▒▒▒▒▒▒▒▒▒▒▒▒▒▒▒▒▒▒▒▒▒▒▒▒▒▒▒▒▒▒ //
// LOGIC TO FIND DIRECTION WHEN THERE IS TREND CHANGE ACCORDING VOLATILITY
atr = multplierFactor * ta.atr(barsBack)
longStop = hl2 - atr
longStopPrev = nz(longStop[1], longStop)
longStop := close[1] > longStopPrev ? math.max(longStop, longStopPrev) : longStop
shortStop = hl2 + atr
shortStopPrev = nz(shortStop[1], shortStop)
shortStop := close[1] < shortStopPrev ? math.min(shortStop, shortStopPrev) : shortStop
direction = 1
direction := nz(direction[1], direction)
direction := direction == -1 and close > shortStopPrev ? 1 : direction == 1 and close < longStopPrev ? -1 : direction
longColor = color.blue
shortColor = color.blue
var valueToPlot = 0.0
var colorToPlot = color.white
if direction == 1
valueToPlot := longStop
colorToPlot := color.green
colorToPlot
else
valueToPlot := shortStop
colorToPlot := color.red
colorToPlot
//RSI
src = close
ep = 2 * RSI - 1
auc = ta.ema(math.max(src - src[1], 0), ep)
adc = ta.ema(math.max(src[1] - src, 0), ep)
x1 = (RSI - 1) * (adc * 70 / (100 - 70) - auc)
ub = x1 >= 0 ? src + x1 : src + x1 * (100 - 70) / 70
x2 = (RSI - 1) * (adc * 30 / (100 - 30) - auc)
lb = x2 >= 0 ? src + x2 : src + x2 * (100 - 30) / 30
//Affichage
plot(math.avg(ub, lb), color=color.white ,linewidth=1, title='RSI')
plot(valueToPlot == 0.0 ? na : valueToPlot, title='Action Line', linewidth=2, color=color.new(colorToPlot, 0))
plotshape(direction == 1 and direction[1] == -1 ? longStop : na, title='Buy', style=shape.labelup, location=location.absolute, size=size.normal, text='Buy', textcolor=color.new(color.white, 0), color=color.new(color.green, 0))
plotshape(direction == -1 and direction[1] == 1 ? shortStop : na, title='Sell', style=shape.labeldown, location=location.absolute, size=size.normal, text='Sell', textcolor=color.new(color.white, 0), color=color.new(color.red, 0))
p_ma1 = plot(valueToPlot, title = "ST", color = color.rgb(255, 236, 66))
p_ma2 = plot(math.avg(ub, lb), title = "RSI", color = color.rgb(234, 0, 255))
// Definitions: Trends
TrendUp1() =>
valueToPlot > math.avg(ub, lb)
TrendDown1() =>
valueToPlot < math.avg(ub, lb)
trendColor1 = TrendUp1() ? color.rgb(255, 236, 66, 85): TrendDown1() ? color.rgb(234, 0, 255, 85) : color.rgb(255, 255, 255, 85)
fill(p_ma1, p_ma2, color=trendColor1)
longCondition () =>
ta.crossover(close, valueToPlot)
shortCondition () =>
ta.crossunder(close, valueToPlot)
IsLongShort() =>
strategy.position_size != 0
getNewLotSize() =>
math.abs(riskPer / (close - valueToPlot))
// plot(getNewLotSize(), "new lot size")
newLotS = getNewLotSize()
alertManagement = str.tostring(exchange) + "," + str.tostring(mtLogin) + "," +str.tostring(mtPassword) + ","
alertManagement += str.tostring(mtServer) + "," + str.tostring(newLotS)
// alertManagement += str.tostring(stopLoss) + "," + str.tostring(applyingSL) + "," + str.tostring(applyTrailingStop) + ","
// alertManagement += str.tostring(exchange) + "," + str.tostring(exchangeAccount) + "," + str.tostring(slAmount) + "," + str.tostring(closeTpAmount) + ","
// alertManagement += str.tostring(exchangeLeverage) + "," + str.tostring(exchangeLeverageType) + ","
// alertManagement += str.tostring(mtLogin) + "," + str.tostring(mtPassword) + "," + str.tostring(mtServer) + "," + str.tostring(mtLot) + ","
// alertManagement += str.tostring(mtTp) + "," + str.tostring(mtTs) + "," + str.tostring(orderStrategy)
// alertManagement = "alertManagement"
myStop = 0.0
myTarget = 0.0
if (longCondition())
qtyLongTargetPrice := math.abs((RiskSize / ((close - valueToPlot) * syminfo.pointvalue)) / lotSize)
if IsLongShort()
strategy.close_all(comment = "close all entries")
strategy.entry("LONG", strategy.long, qty=12, comment="LONG", alert_message=alertManagement)
strategy.exit("TPL", "LONG", stop=valueToPlot, limit= close + (close - valueToPlot), comment="Target", alert_message=alertManagement)
if (shortCondition())
qtyLongTargetPrice := math.abs((RiskSize / ((close - valueToPlot) * syminfo.pointvalue)) / lotSize)
if IsLongShort()
strategy.close_all(comment = "close all entries")
strategy.entry("SHORT", strategy.short, qty=12, comment="SHORT", alert_message=alertManagement)
strategy.exit("TPS", "SHORT", stop=valueToPlot, limit= close + (close - valueToPlot), comment="Target", alert_message=alertManagement)
// Calculate the average profit per open trade
// avgProfit = profitSum / strategy.opentrades
getTotalProfit()=>
// Sum the profit of all open trades
profitSum = 0.0
for tradeNumber = 0 to strategy.closedtrades - 1
if strategy.closedtrades.profit(tradeNumber) > 0
profitSum += strategy.closedtrades.profit(tradeNumber)
result = profitSum
getTotalLoss()=>
// Sum the profit of all open trades
lossSum = 0.0
for tradeNumber = 0 to strategy.closedtrades - 1
if strategy.closedtrades.profit(tradeNumber) < 0
lossSum += strategy.closedtrades.profit(tradeNumber)
result = lossSum
maxLossRun()=>
lossRun = 0.0
currentMaxLoss = 0.0
for tradeNo = 0 to strategy.closedtrades - 1
if strategy.closedtrades.profit(tradeNo) < 0.0
lossRun += strategy.closedtrades.profit(tradeNo)
else
currentMaxLoss := math.min(currentMaxLoss, lossRun)
lossRun := 0.0
result = currentMaxLoss
TotalTrades() =>
strategy.closedtrades + strategy.opentrades
maxDrawDown() =>
maxDrawdown = 0.0
for tradeNo = 0 to strategy.closedtrades - 1
maxDrawdown := math.max(maxDrawdown, strategy.closedtrades.max_drawdown(tradeNo))
result = maxDrawdown
maxRunUp() =>
maxRunup = 0.0
for tradeNo = 0 to strategy.closedtrades - 1
maxRunup := math.max(maxRunup, strategy.closedtrades.max_runup(tradeNo))
result = maxRunup
tradeMaxLossReached() =>
maxLoss = 0.0
for tradeNo = 0 to strategy.closedtrades - 1
maxLoss := math.min(maxLoss, strategy.closedtrades.profit(tradeNo))
result = maxLoss
tradingStartTime() =>
strategy.closedtrades.entry_time(0)
daysBetween(t1, t2) => (t1 - t2) / 86400000
// Table
var InfoPanel = table.new(position = position.bottom_right, columns = 2, rows = 40, border_width = 1)
ftable(_table_id, _column, _row, _text, _bgcolor) =>
table.cell(_table_id, _column, _row, _text, 0, 0, color.black, text.align_right, text.align_center, size.small, _bgcolor)
tfString(int timeInMs) =>
// @function Produces a string corresponding to the input time in days, hours, and minutes.
// @param (series int) A time value in milliseconds to be converted to a string variable.
// @returns (string) A string variable reflecting the amount of time from the input time.
float s = timeInMs / 100000
float m = s / 60
float h = m / 60
float d = h / 24
float mo = d / 30.416
int tm = math.floor(m % 60)
int tr = math.floor(h % 24)
int td = math.floor(d % 30.416)
int tmo = math.floor(mo % 12)
int ys = math.floor(d / 365)
string result =
switch
d == 30 and tr == 10 and tm == 30 => "1M"
d == 7 and tr == 0 and tm == 0 => "1W"
=>
string yStr = ys ? str.tostring(ys) + "Y " : ""
string moStr = tmo ? str.tostring(tmo) + "M " : ""
string dStr = td ? str.tostring(td) + "D " : ""
string hStr = tr ? str.tostring(tr) + "H " : ""
string mStr = tm ? str.tostring(tm) + "min" : ""
yStr + moStr + dStr + hStr + mStr
if displayTable
maxLossRunInMarket= maxLossRun()
maxLossReached = tradeMaxLossReached()
tradeMaxLossReached = tradeMaxLossReached()
tradingInDays=daysBetween(time, tradingStartTime())
totalTrades=TotalTrades()