
La estrategia de doble vía para romper el equilibrio es una estrategia de negociación cuantitativa de tipo de seguimiento de tendencias. La estrategia utiliza un mecanismo de doble vía para determinar la dirección de la tendencia del mercado, en combinación con la señal de cruce de equilibrio para entrar en el mercado.
La estrategia de cruce homogéneo de ruptura de dos vías consiste principalmente en las siguientes partes:
Módulo de evaluación de tendencias: Construye dos trayectorias utilizando diferentes medias periódicas, donde la ruptura de la trayectoria superior se considera una tendencia alcista y la ruptura de la trayectoria inferior se considera una tendencia bajista.
Módulo de admisiónEn la línea media rápida, haga más en la línea media larga, y en la línea media larga, haga vacío. Al mismo tiempo, debe determinar la dirección de la tendencia.
Módulo de salida: Rápido y mediano bajo la línea a través de la línea media y media.
La estrategia utiliza primero el parámetro Trend Required para establecer la intensidad de la tendencia que se necesita para juzgar. Cuando el precio rompe la vía ascendente o descendente, se juzga que se forma una tendencia. Luego, cuando el precio cruza la línea media de la línea media de la línea media de la línea media de la línea media de la línea media de la línea media de la línea media de la línea media de la línea media de la línea media de la línea media de la línea media de la línea media.
Además, la estrategia tiene un módulo de stop loss y stop loss. Los parámetros específicos pueden ser ajustados y optimizados para controlar el riesgo y la ganancia.
En comparación con las estrategias de un solo carril o de una sola línea media, la estrategia de cruce de línea media de doble carril combina el juicio de tendencias y la selección de la hora de entrada, para comprender mejor el ritmo del mercado. Las ventajas concretas son:
La configuración de dos vías permite una mejor comprensión de las tendencias y evita que se pierdan oportunidades.
El filtro de cruce de línea media reduce la probabilidad de que el falso avance se realice en sentido contrario.
Se pueden ajustar los parámetros para optimizar los riesgos y los beneficios.
La lógica de la estrategia es simple, clara, fácil de entender y fácil de seguir.
La estrategia de cruce uniforme de dos vías también presenta ciertos riesgos, que se manifiestan principalmente en:
La configuración de dos vías no evita por completo la probabilidad de errores en el juicio de tendencias.
La configuración incorrecta de los parámetros de la línea media puede causar una frecuencia de transacción excesiva o una operación inversa.
La configuración del punto de parada es demasiado relajada para controlar eficazmente la pérdida individual.
La solución es la siguiente:
Ajuste de los parámetros de doble vía para permitir una ampliación adecuada de la brecha.
Optimización de la cartera de ciclos equilibrados para garantizar una frecuencia de negociación razonable.
Prueba diferentes niveles de puntos de parada para encontrar el parámetro óptimo.
La estrategia de cruce homogéneo de la brecha de dos vías tiene varias direcciones de optimización:
Prueba diferentes parámetros de ciclo medio para encontrar la combinación óptima.
Intentar agregar más líneas medias y construir un sistema de filtración multilineal.
Prueba de diferentes algoritmos de detención de pérdidas, como el seguimiento de la detención, la detención de la vibración, etc.
Acompañar el mecanismo de retribución para optimizar la eficiencia en el uso de los fondos.
Se filtran en combinación con otros indicadores, como el Brinband, el KDJ, etc.
La estrategia de cruce de línea uniforme de ruptura de dos vías tiene en cuenta el juicio de tendencias y la elección del momento de entrada, lo que permite capturar el ritmo del mercado de manera efectiva. En comparación con un solo indicador, la estrategia tiene características de juicio más preciso y mejor filtrado. A través de la optimización de parámetros y la actualización de módulos, se espera que la estabilidad y la rentabilidad de la estrategia se mejoren aún más.
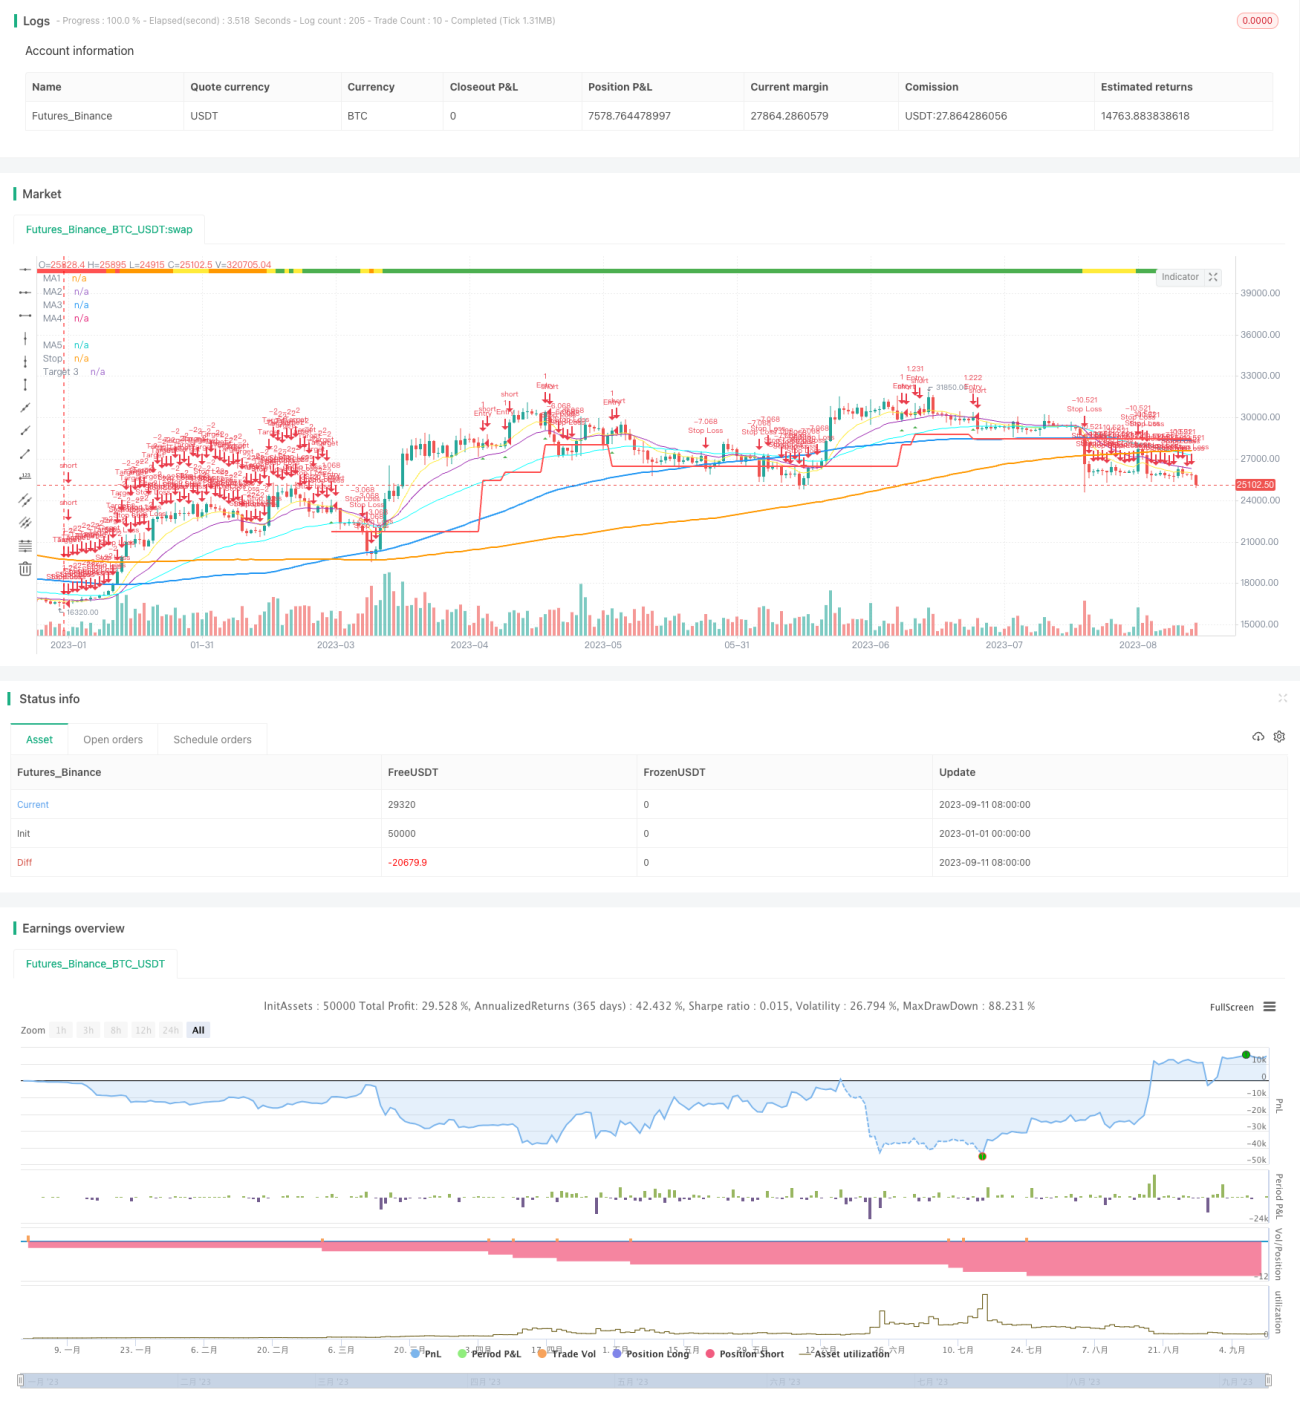
/*backtest
start: 2023-01-01 00:00:00
end: 2023-09-12 00:00:00
period: 1d
basePeriod: 1h
exchanges: [{"eid":"Futures_Binance","currency":"BTC_USDT"}]
*/
//@version=4
//Author = Dustin Drummond https://www.tradingview.com/u/Dustin_D_RLT/
//Strategy based in part on original 10ema Basic Swing Trade Strategy by Matt Delong: https://www.tradingview.com/u/MattDeLong/
//Link to original 10ema Basic Swing Trade Strategy: https://www.tradingview.com/script/8yhGnGCM-10ema-Basic-Swing-Trade-Strategy/
//This is the Original EMAC - Exponential Moving Average Cross Strategy built as a class for reallifetrading dot com and so has all the default settings and has not been optimized
//I would not recomend using this strategy with the default settings and is for educational purposes only
//For the fully optimized version please come back around the same time tomorrow 6/16/21 for the EMAC - Exponential Moving Average Cross - Optimized
//EMAC - Exponential Moving Average Cross
strategy(title="EMAC - Exponential Moving Average Cross", shorttitle = "EMAC", overlay = true, calc_on_every_tick=false, default_qty_value = 100, initial_capital = 100000, default_qty_type = strategy.fixed, pyramiding = 0, process_orders_on_close=true)
//creates a time filter to prevent "too many orders error" and allows user to see Strategy results per year by changing input in settings in Stratey Tester
startYear = input(2015, title="Start Year", minval=1980, step=1)
timeFilter = (year >= startYear) and (month >= 1) and (dayofmonth >= 1)
//R Size (Risk Amount)
rStaticOrPercent = input(title="R Static or Percent", defval="Static", options=["Static", "Percent"])
rSizeStatic = input(2000, title="R Size Static", minval=1, step=100)
rSizePercent = input(3, title="R Size Percent", minval=.01, step=.01)
rSize = rStaticOrPercent == "Static" ? rSizeStatic : rStaticOrPercent == "Percent" ? (rSizePercent * .01 * strategy.equity) : 1
//Recent Trend Indicator "See the standalone version for detailed description"
res = input(title="Trend Timeframe", type=input.resolution, defval="W")
trend = input(26, minval=1, title="# of Bars for Trend")
trendMult = input(15, minval=0, title="Trend Growth %", step=.25) / 100
currentClose = security(syminfo.tickerid, res, close)
pastClose = security(syminfo.tickerid, res, close[trend])
//Trend Indicator
upTrend = (currentClose >= (pastClose * (1 + trendMult)))
downTrend = (currentClose <= (pastClose * (1 - trendMult)))
sidewaysUpTrend = (currentClose < (pastClose * (1 + trendMult)) and (currentClose > pastClose))
sidewaysDownTrend = (currentClose > (pastClose * (1 - trendMult)) and (currentClose < pastClose))
//Plot Trend on Chart
plotshape(upTrend, "Up Trend", style=shape.square, location=location.top, color=color.green, size=size.small)
plotshape(downTrend, "Down Trend", style=shape.square, location=location.top, color=color.red, size=size.small)
plotshape(sidewaysUpTrend, "Sideways Up Trend", style=shape.square, location=location.top, color=color.yellow, size=size.small)
plotshape(sidewaysDownTrend, "Sideways Down Trend", style=shape.square, location=location.top, color=color.orange, size=size.small)
//What trend signals to use in entrySignal
trendRequired = input(title="Trend Required", defval="Orange", options=["Green", "Yellow", "Orange", "Red"])
goTrend = trendRequired == "Orange" ? upTrend or sidewaysUpTrend or sidewaysDownTrend : trendRequired == "Yellow" ? upTrend or sidewaysUpTrend : trendRequired == "Green" ? upTrend : trendRequired == "Red" ? upTrend or sidewaysUpTrend or sidewaysDownTrend or downTrend : na
//MAs Inputs Defalt is 10 EMA, 20 EMA, 50 EMA, 100 SMA and 200 SMA
ma1Length = input(10, title="MA1 Period", minval=1, step=1)
ma1Type = input(title="MA1 Type", defval="EMA", options=["SMA", "EMA", "WMA"])
ma2Length = input(20, title="MA2 Period", minval=1, step=1)
ma2Type = input(title="MA2 Type", defval="EMA", options=["SMA", "EMA", "WMA"])
ma3Length = input(50, title="MA3 Period", minval=1, step=1)
ma3Type = input(title="MA3 Type", defval="EMA", options=["SMA", "EMA", "WMA"])
ma4Length = input(100, title="MA4 Period", minval=1, step=1)
ma4Type = input(title="MA4 Type", defval="SMA", options=["SMA", "EMA", "WMA"])
ma5Length = input(200, title="MA5 Period", minval=1, step=1)
ma5Type = input(title="MA5 Type", defval="SMA", options=["SMA", "EMA", "WMA"])
//MAs defined
ma1 = ma1Type == "EMA" ? ema(close, ma1Length) : ma1Type == "SMA" ? sma(close, ma1Length) : wma(close, ma1Length)
ma2 = ma2Type == "EMA" ? ema(close, ma2Length) : ma2Type == "SMA" ? sma(close, ma2Length) : wma(close, ma2Length)
ma3 = ma3Type == "EMA" ? ema(close, ma3Length) : ma3Type == "SMA" ? sma(close, ma3Length) : wma(close, ma3Length)
ma4 = ma4Type == "SMA" ? sma(close, ma4Length) : ma4Type == "EMA" ? ema(close, ma4Length) : wma(close, ma4Length)
ma5 = ma5Type == "SMA" ? sma(close, ma5Length) : ma5Type == "EMA" ? ema(close, ma5Length) : wma(close, ma5Length)
//Plot MAs
plot(ma1, title="MA1", color=color.yellow, linewidth=1, style=plot.style_line)
plot(ma2, title="MA2", color=color.purple, linewidth=1, style=plot.style_line)
plot(ma3, title="MA3", color=#00FFFF, linewidth=1, style=plot.style_line)
plot(ma4, title="MA4", color=color.blue, linewidth=2, style=plot.style_line)
plot(ma5, title="MA5", color=color.orange, linewidth=2, style=plot.style_line)
//Allows user to toggle on/off ma1 > ma2 filter
enableShortMAs = input(title="Enable Short MA Cross Filter", defval="Yes", options=["Yes", "No"])
shortMACross = enableShortMAs == "Yes" and ma1 > ma2 or enableShortMAs == "No"
//Allows user to toggle on/off ma4 > ma5 filter
enableLongMAs = input(title="Enable Long MA Cross Filter", defval="Yes", options=["Yes", "No"])
longMACross = enableLongMAs == "Yes" and ma4 >= ma5 or enableLongMAs == "No"
//Entry Signals
entrySignal = (strategy.position_size <= 0 and close[1] < ma1[1] and close > ma1 and close > ma2 and close > ma3 and shortMACross and ma1 > ma3 and longMACross and goTrend)
secondSignal = (strategy.position_size > 0 and close[1] < ma1[1] and close > ma1 and close > ma2 and close > ma3 and shortMACross and ma1 > ma3 and longMACross and goTrend)
plotshape(entrySignal, style=shape.triangleup, location=location.belowbar, color=color.green, size=size.small)
plotshape(secondSignal, style=shape.triangleup, location=location.belowbar, color=color.lime, size=size.small)
//ATR for Stops
atrValue = (atr(14))
//to test ATR enable next line
//plot(atrValue, linewidth=1, color=color.black, style=plot.style_line)
atrMult = input(2.5, minval=.25, step=.25, title="Stop ATR Multiple")
//Only target3Mult is used in current strategy target1 and target2 might be used in the future with pyramiding
//target1Mult = input(1.0, minval=.25, step=.25, title="Targert 1 Multiple")
//target2Mult = input(2.0, minval=.25, step=.25, title="Targert 2 Multiple")
target3Mult = input(3.0, minval=.25, step=.25, title="Target Multiple")
enableAtrStop = input(title="Enable ATR Stops", defval="Yes", options=["Yes", "No"])
//Intitial Recomended Stop Location
atrStop = entrySignal and ((high - (atrMult * atrValue)) < low) ? (high - (atrMult * atrValue)) : low
//oneAtrStop is used for testing only enable next 2 lines to test
//oneAtrStop = entrySignal ? (high - atrValue) : na
//plot(oneAtrStop, "One ATR Stop", linewidth=2, color=color.orange, style=plot.style_linebr)
initialStop = entrySignal and enableAtrStop == "Yes" ? atrStop : entrySignal ? low : na
//Stops changed to stoploss to hold value for orders the next line is old code "bug"
//plot(initialStop, "Initial Stop", linewidth=2, color=color.red, style=plot.style_linebr)
//Set Initial Stop and hold value "debug code"
stoploss = valuewhen(entrySignal, initialStop, 0)
plot(stoploss, title="Stop", linewidth=2, color=color.red)
enableStops = input(title="Enable Stops", defval="Yes", options=["Yes", "No"])
yesStops = enableStops == "Yes" ? 1 : enableStops == "No" ? 0 : na
//Calculate size of trade based on R Size
//Original buggy code:
//positionSize = (rSize/(close - initialStop))
//Added a minimum order size of 1 "debug code"
positionSize = (rSize/(close - initialStop)) > 1 ? (rSize/(close - initialStop)) : 1
//Targets
//Enable or Disable Targets
enableTargets = input(title="Enable Targets", defval="Yes", options=["Yes", "No"])
yesTargets = enableTargets == "Yes" ? 1 : enableTargets == "No" ? 0 : na
//Only target3 is used in current strategy target1 and target2 might be used in the future with pyramiding
//target1 = entrySignal ? (close + ((close - initialStop) * target1Mult)) : na
//target2 = entrySignal ? (close + ((close - initialStop) * target2Mult)) : na
target3 = entrySignal ? (close + ((close - initialStop) * target3Mult)) : na
//plot(target1, "Target 1", linewidth=2, color=color.green, style=plot.style_linebr)
//plot(target2, "Target 2", linewidth=2, color=color.green, style=plot.style_linebr)
plot(target3, "Target 3", linewidth=2, color=color.green, style=plot.style_linebr)
//Set Target and hold value "debug code"
t3 = valuewhen(entrySignal, target3, 0)
//To test t3 and see plot enable next line
//plot(t3, title="Target", linewidth=2, color=color.green)
//MA1 Cross Exit
enableEarlyExit = input(title="Enable Early Exit", defval="Yes", options=["Yes", "No"])
earlyExit = enableEarlyExit == "Yes" ? 1 : enableEarlyExit == "No" ? 0 : na
ma1CrossExit = strategy.position_size > 0 and close < ma1
//Entry Order
strategy.order("Entry", long = true, qty = positionSize, when = (strategy.position_size <= 0 and entrySignal and timeFilter))
//Early Exit Order
strategy.close_all(when = ma1CrossExit and timeFilter and earlyExit, comment = "MA1 Cross Exit")
//Stop and Target Orders
//strategy.cancel orders are needed to prevent bug with Early Exit Order
strategy.order("Stop Loss", false, qty = strategy.position_size, stop=stoploss, oca_name="Exit",when = timeFilter and yesStops, comment = "Stop Loss")
strategy.cancel("Stop Loss", when = ma1CrossExit and timeFilter and earlyExit)
strategy.order("Target", false, qty = strategy.position_size, limit=t3, oca_name="Exit", when = timeFilter and yesTargets, comment = "Target")
strategy.cancel("Target", when = ma1CrossExit and timeFilter and earlyExit)