Estrategia dual Bollinger+RSI (solo compra) v1.2

Nombre de la estrategia
Bollinger + RSI estrategia doble y múltiple
La estrategia es muy simple.
Esta estrategia utiliza una combinación de un indicador de línea de Brin y un indicador de RSI para hacer una posición más alta cuando ambos muestran una señal de sobreventa y una posición baja cuando ambos muestran una señal de sobreventa. En comparación con un solo indicador, es más fiable para confirmar la señal de negociación y evitar falsas señales.
Tres, las estrategias.
- El indicador RSI es utilizado para determinar sobrecompra y sobreventa.
- RSI bajo 50 es considerado como sobrevendido
- RSI por encima de 50 es considerado como sobrecompra
- El uso de líneas de Brin para determinar la anomalía de precios
- Los precios por debajo de la vía baja se consideran sobrevendidos
- Los precios más altos que los de la vía son considerados sobrecompras.
- Cuando el RSI y la línea de Brin aparezcan simultáneamente como señales de sobreventa, realice una posición adicional
- El RSI está por debajo de 50.
- La línea de precios está por debajo de la línea de Brin.
- Cuando el RSI y la línea de Brink muestran señales de sobreventa al mismo tiempo, la posición se cierra.
- El RSI está por encima de 50.
- La línea de precios es más alta que la línea de Brin.
Cuatro, ventajas estratégicas
- La combinación de los dos indicadores hace que la señal sea más fiable y evita falsas señales.
- Solo establezca posiciones múltiples, simplifique la lógica y reduzca el riesgo de transacción
Cinco, riesgos estratégicos y soluciones
- Los parámetros de la línea de Brin están mal configurados, las restricciones de subida y bajada son demasiado amplias, lo que aumenta el riesgo de transacciones erróneas
- Optimización de los parámetros de la línea de embocadura, configuración razonable de la línea de embocadura y el desvío estándar
- La configuración incorrecta de los parámetros del RSI, el criterio de juicio de sobrecompra y sobreventa incorrecto, aumenta el riesgo de transacciones erróneas
- Optimización de los parámetros del RSI, ajuste del ciclo del RSI y ajuste razonable de los parámetros de sobrecompra y sobreventa
- Ravin no funciona bien cuando las cosas no están en tendencia
- Combinación de indicadores de tendencia para evitar operaciones de movimiento brusco
Seis, estrategias para mejorar.
- Optimización de la línea de Brin y la configuración de los parámetros RSI
- Aumentar el mecanismo de suspensión de pérdidas
- Indicadores de tendencia combinados con MACD
- Aumentar la línea corta y la línea larga en la combinación de juicios
VII. Conclusión
Esta estrategia combina las ventajas de los indicadores Brinline y RSI para operar al mismo tiempo, evitando las señales falsas generadas por un solo indicador. La estrategia se puede optimizar a través de la optimización de parámetros, el mecanismo de stop loss y la combinación de indicadores de tendencia para adaptarse a diferentes entornos de mercado.
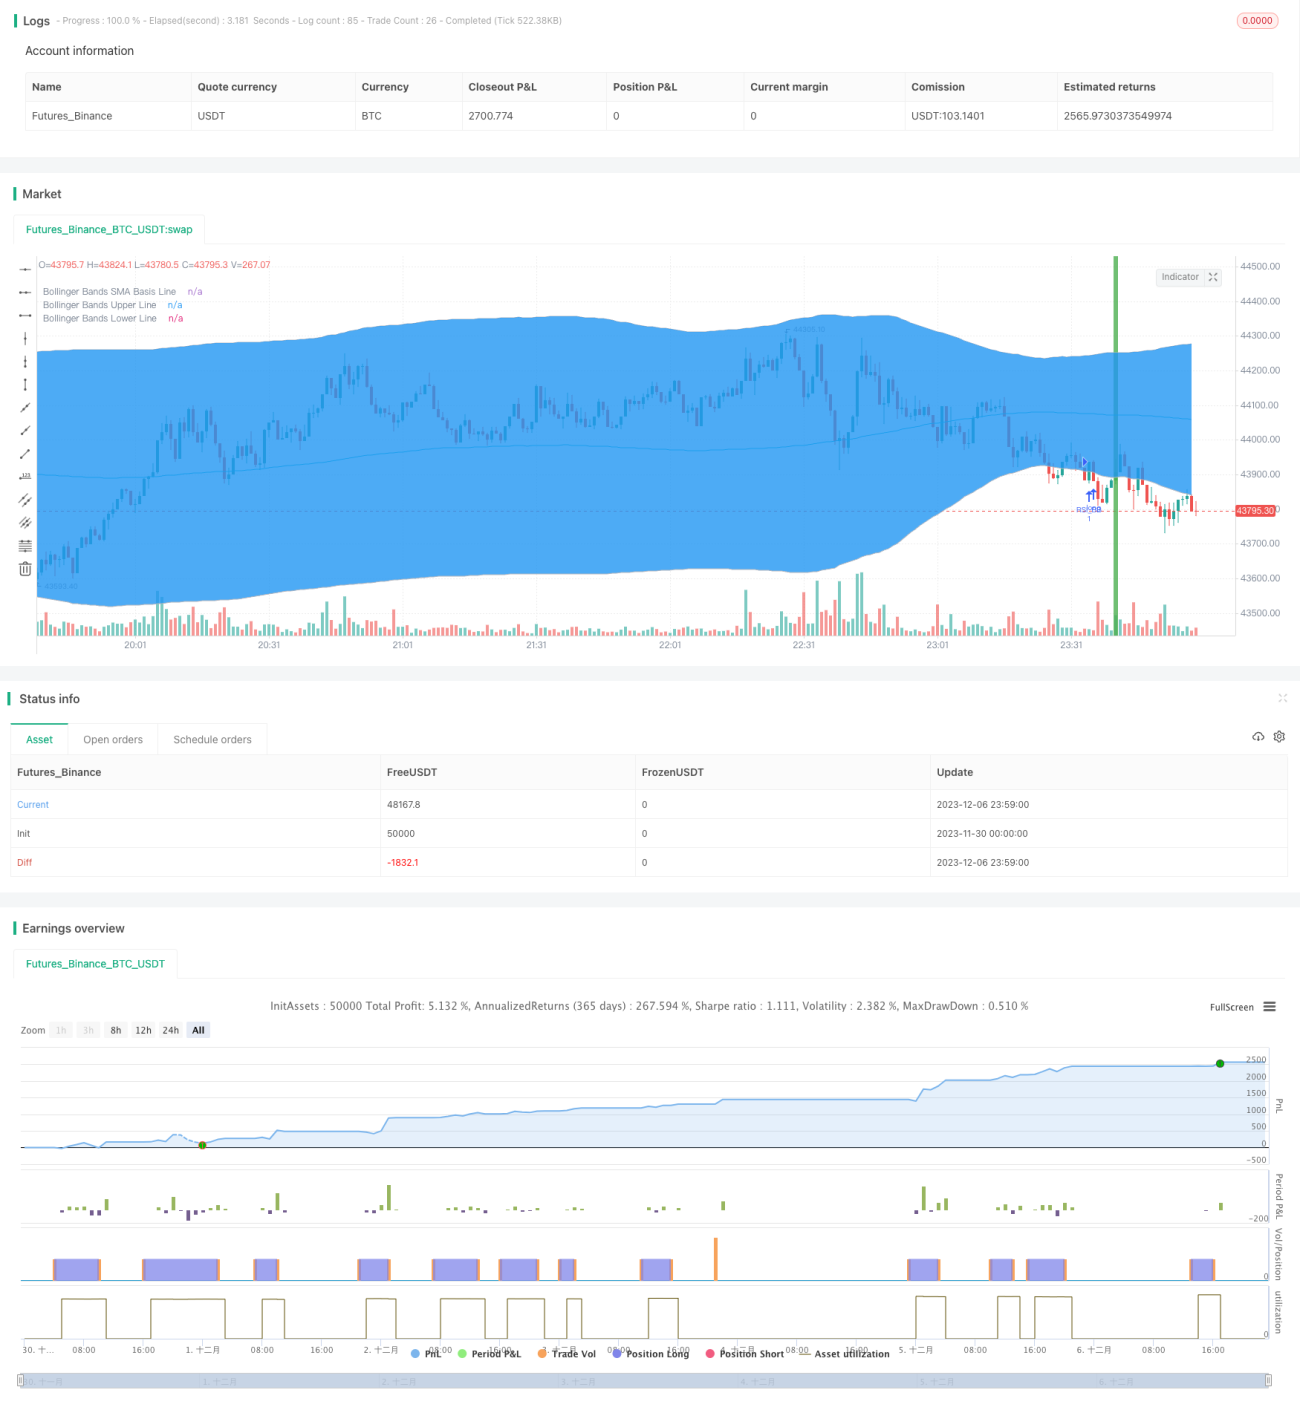
/*backtest
start: 2023-11-30 00:00:00
end: 2023-12-07 00:00:00
period: 1m
basePeriod: 1m
exchanges: [{"eid":"Futures_Binance","currency":"BTC_USDT"}]
*/

//@version=3
strategy("Bollinger + RSI, Double Strategy Long-Only (by ChartArt) v1.2", shorttitle="CA_-_RSI_Bol_Strat_1.2", overlay=true)

// ChartArt's RSI + Bollinger Bands, Double Strategy UPDATE: Long-Only- 1