Estrategia de banda de Bollinger de ruptura de media móvil

1
Follow
1779
Followers
Descripción general
Esta estrategia combina el indicador de las medias móviles, el indicador de las bandas de Brin y el indicador de Alertas de Bot de UT para lograr una estrategia de operación de ruptura simple. Cuando el precio rompa la banda de Brin, haga más; cuando el precio rompa la banda de Brin, haga un desvío.
Principio de estrategia
- Utiliza el EMA de 200 ciclos como eje central para determinar la tendencia. Los precios por encima de los EMA son positivos y los precios por debajo de los EMA son negativos.
- El indicador UT Bot Alerts se combina con el ATR para generar una señal de compra y venta. Se produce una señal de comprobación cuando el precio y el rápido cruce de EMA se encuentran en trayectoria; se produce una señal de comprobación cuando el precio y el rápido cruce de EMA se encuentran en trayectoria.
- El indicador de stop loss ATR se utiliza para establecer el punto de stop loss. La distancia de stop loss es 1.5 veces el valor de ATR.
- Después de entrar en el mercado, el precio de entrada se mueve a través de la tasa de retorno por riesgo, el establecimiento de un punto de parada, el punto de parada y el punto de parada.
Análisis de las ventajas
- El uso del indicador de la banda de Brin para determinar cuándo es el momento adecuado para hacer más ejercicio puede aumentar la probabilidad de obtener ganancias.
- El indicador UT Bot Alerts puede generar una señal más precisa.
- El uso de la proporción de riesgo-beneficio para el stop loss puede controlar el riesgo de manera efectiva.
Análisis de riesgos
- La banda de Bryn es propensa a generar señales erróneas en ciudades convulsionadas.
- El ATR es retrasado y puede tener una distancia de pérdida excesiva al comienzo de la tendencia.
- El error de ajuste de la relación de riesgo-beneficio también puede conducir a ser demasiado radical o demasiado conservador.
Dirección de optimización
- Puede intentar usar otros indicadores en lugar de los indicadores de Alertas de Bot de UT.
- Se puede optimizar el ciclo y el múltiplo de ATR para que la distancia de parada sea más adecuada.
- Se pueden probar diferentes ratios de riesgo-beneficio para encontrar el parámetro óptimo.
Resumir
La estrategia integra las ventajas de varios indicadores y tiene una gran utilidad. A través de la optimización de los parámetros, se puede convertir en un sistema de ruptura estable y confiable. Pero también se debe tener en cuenta los riesgos de prevención de fallas en los indicadores y parámetros incorrectos.
Source
Pine
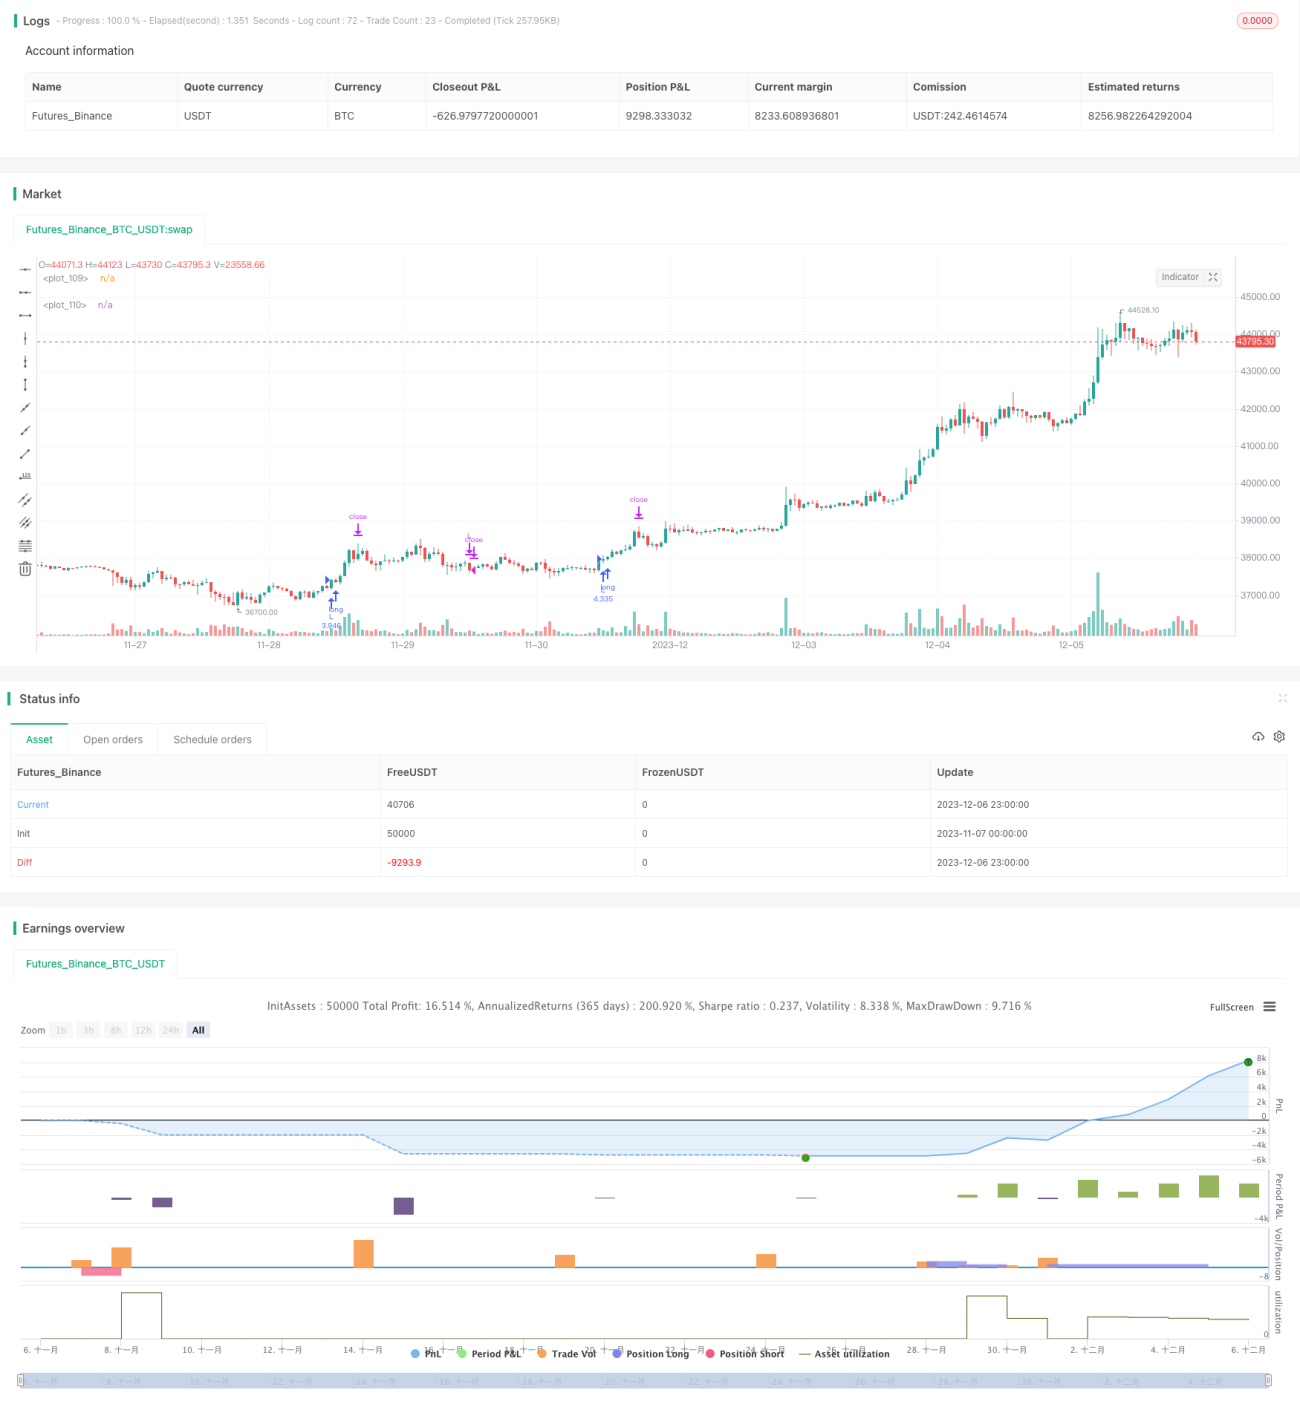
/*backtest
start: 2023-11-07 00:00:00
end: 2023-12-07 00:00:00
period: 1h
basePeriod: 15m
exchanges: [{"eid":"Futures_Binance","currency":"BTC_USDT"}]
*/

// This source code is subject to the terms of the Mozilla Public License 2.0 at https://mozilla.org/MPL/2.0/
//@version=5
//Developed by StrategiesForEveryone
Strategy parameters
Related strategies
Comment
All comments (0)
No data
- 1