बोलिंगर+आरएसआई दोहरी रणनीति (केवल लांग) v1.2

रणनीति का नाम
Bollinger + RSI डबल मल्टीहेड रणनीति
रणनीतिक रूपरेखा
इस रणनीति का उपयोग करने के लिए एक ब्रीलिंग रेखा सूचक और RSI सूचक के संयोजन का उपयोग करें, दोनों के साथ ओवरसोल संकेतों को प्रदर्शित करते समय अधिक स्थिति बनाएं, और दोनों के साथ ओवरबॉय संकेतों को प्रदर्शित करते समय कम स्थिति दें। एक एकल सूचक की तुलना में, व्यापार संकेतों को अधिक विश्वसनीय रूप से पुष्टि करें और झूठे संकेतों से बचें।
तीन, रणनीति
- आरएसआई सूचकांक का उपयोग करके ओवरबॉट और ओवरसोल्ड का आकलन करें
- RSI 50 से नीचे ओवरसोल्ड माना जाता है
- RSI 50 से ऊपर ओवरबॉट माना जाता है
- मूल्य असामान्यताओं के लिए ब्रीनिंग का उपयोग करना
- नीचे की कीमतों को ओवरसोल्ड माना जाता है
- कीमतों को ओवरबॉट माना जाता है
- जब आरएसआई और ब्रीलिंग लाइन एक साथ ओवरसोल संकेत दिखाते हैं, तो ओवरस्टॉक करें
- आरएसआई 50 से नीचे
- ब्रिन लाइन से नीचे की रेखा
- जब RSI और ब्रीलिंग लाइन एक साथ ओवरबॉय सिग्नल दिखाते हैं, तो ब्लीडिंग
- RSI 50 से ऊपर
- ब्रिन लाइन से अधिक कीमतों पर रेल
4. रणनीतिक लाभ
- दो संकेतकों के संयोजन से संकेत अधिक विश्वसनीय होते हैं और झूठे संकेतों से बचा जाता है
- केवल मल्टी हेड पोजीशन सेट करें, लॉजिक को सरल करें, ट्रेडिंग जोखिम को कम करें
पांच, रणनीतिक जोखिम और समाधान
- ब्रिन लाइन पैरामीटर गलत तरीके से सेट किया गया है, अप-डाउन ट्रैक सीमाएं बहुत व्यापक हैं, जो गलत लेनदेन के जोखिम को बढ़ाती हैं
- बुरिनलाइन पैरामीटर का अनुकूलन, बुरिनलाइन चक्र और मानक विचलन को उचित रूप से सेट करना
- आरएसआई पैरामीटर गलत सेट, ओवरबॉट और ओवरसोल्ड निर्णय मानदंड गलत, गलत व्यापार के जोखिम को बढ़ाता है
- आरएसआई पैरामीटर का अनुकूलन करें, आरएसआई चक्र को समायोजित करें, ओवरबॉट और ओवरसोल्ड मानदंड को उचित रूप से सेट करें
- जब कोई प्रवृत्ति नहीं होती है, तो राविन खराब काम करता है
- ट्रेंड-आधारित संकेतकों के संयोजन के साथ, अस्थिरता से बचें
6. रणनीतिक अनुकूलन
- बुलिन लाइन और आरएसआई पैरामीटर सेटिंग को अनुकूलित करें
- अतिरिक्त रोकथाम
- MACD जैसे ट्रेंडिंग सूचकांकों के साथ
- लंबी और छोटी लाइनों के बीच निर्णय जोड़ें
VII. निष्कर्ष
इस रणनीति में ब्रीलिंग और आरएसआई दोनों संकेतकों के फायदे शामिल हैं, दोनों एक ही समय में ओवरबॉय ओवरसोल सिग्नल दिखाते हैं, जिससे सिग्नल की सटीकता में सुधार होता है। पिछले संस्करण की तुलना में, केवल मल्टीहेड पोजीशन स्थापित करना, ट्रेडिंग जोखिम को कम करना। बाद में, पैरामीटर अनुकूलन, स्टॉप-लॉस तंत्र और ट्रेंड-आधारित संकेतकों के साथ संयोजन के माध्यम से रणनीति का अनुकूलन किया जा सकता है, जिससे यह विभिन्न बाजार स्थितियों के लिए अधिक उपयुक्त हो सके।
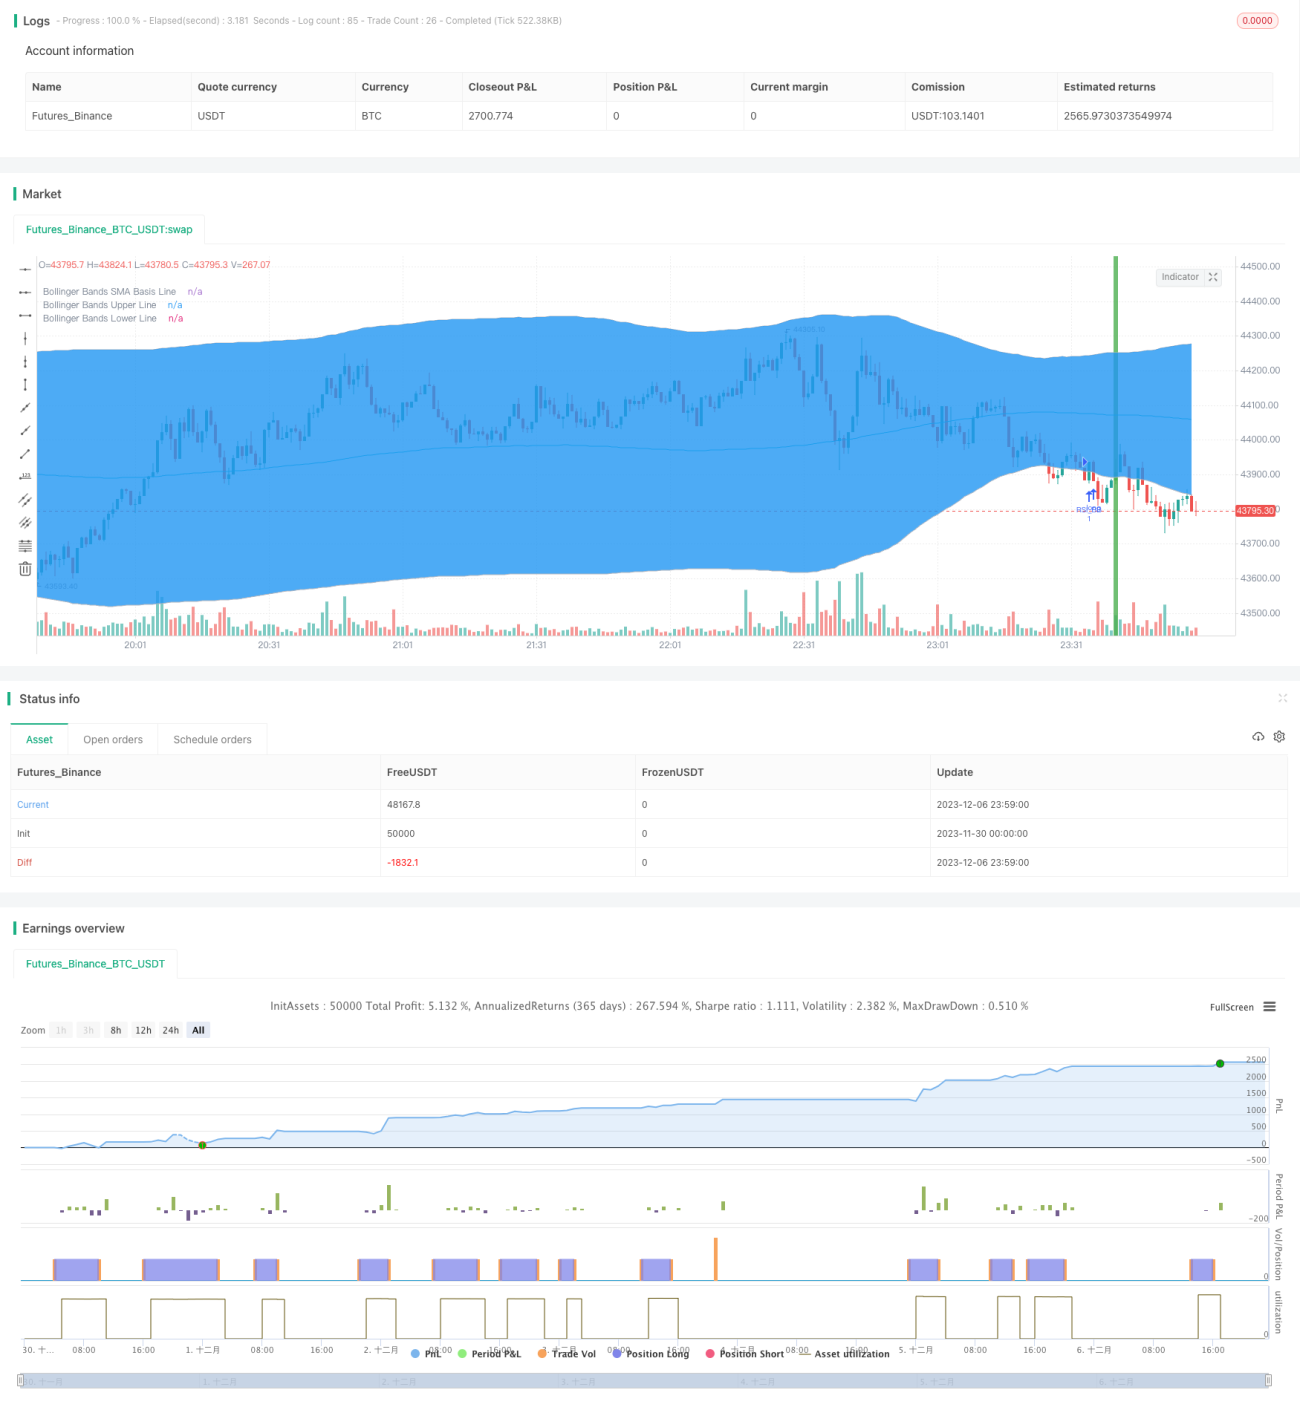
/*backtest
start: 2023-11-30 00:00:00
end: 2023-12-07 00:00:00
period: 1m
basePeriod: 1m
exchanges: [{"eid":"Futures_Binance","currency":"BTC_USDT"}]
*/

//@version=3
strategy("Bollinger + RSI, Double Strategy Long-Only (by ChartArt) v1.2", shorttitle="CA_-_RSI_Bol_Strat_1.2", overlay=true)

// ChartArt's RSI + Bollinger Bands, Double Strategy UPDATE: Long-Only- 1