Pemula, periksa Membawa Anda ke Cryptocurrency Quantitative Trading (5)
Penulis:Ninabadass, Dibuat: 2022-04-18 17:20:53, Diperbarui: 2022-04-18 17:30:27Pemula, periksa Membawa Anda ke Cryptocurrency Quantitative Trading (5)
Dalam artikel sebelumnya, kami menjelaskan analisis logika perdagangan dari strategi grid sederhana.
-
Analisis logika perdagangan Seperti yang kami sebutkan dalam artikel sebelumnya, selama Anda melintasi setiap garis kisi kisi dan menilai bahwa harga saat ini melintasi garis kisi ke atas atau ke bawah, tindakan perdagangan dapat dipicu.
Rincian pertama yang harus kita pertimbangkan adalah desain kisi tak terbatas.
createNetuntuk menghasilkan struktur data grid awal bersama-sama? fungsi ini menghasilkan struktur data grid dengan jumlah garis grid terbatas. jadi bagaimana jika, ketika strategi berjalan, harga melampaui batas struktur data grid ini (di luar garis grid atas di mana harga tertinggi, dan garis grid bawah di mana harga terendah)? Jadi pertama-tama kita perlu menambahkan mekanisme ekstensi pada struktur data grid.Mulai menulis fungsi utama strategi, dan fungsi utama adalah kode di mana strategi mulai dijalankan.
var diff = 50                                 // global variable, the grid interval, can be designed as parameter; for an easy explanation, we write it in an infinite loop
function main() {
    // After the bot starts running, execute the strategy code from here
    var ticker = _C(exchange.GetTicker)       // obtain the latest ticker data in the market; for the ticker data structure, you can refer to FMZ API documentation: https://www.fmz.com/api#ticker
    var net = createNet(ticker.Last, diff)    // the function to initially construct the grid data structure we designed in the previous article; here we construct a grid data structure net

    while (true) {                            // then, the program logic enters the while infinite loop, and the strategy will repeatedly execute the code within the {} symbol from here
        ticker = _C(exchange.GetTicker)       // the first line of the infinite loop code gets the latest market quote data, and updates it to the variable ticker
        // check the grid range
        while (ticker.Last >= net[net.length - 1].price) {
            net.push({
                buy : false,
                sell : false,
                price : net[net.length - 1].price + diff,
            })
        }
        while (ticker.Last <= net[0].price) {
            var price = net[0].price - diff
            if (price <= 0) {
                break
            }
            net.unshift({
                buy : false,
                sell : false,
                price : price,
            })
        }

        // the code is not completed...
    }
}
Ini adalah kode yang membuat struktur data grid dapat diperluas (diambil dari kode di atas):
      // check the grid range
      while (ticker.Last >= net[net.length - 1].price) {   // if the price exceeds the grid line with the highest price in the grid,
          net.push({                                       // add a new grid line after the grid line with the highest price in the grid
              buy : false,                                 // initialize the sell mark
              sell : false,                                // initialize the buy mark
              price : net[net.length - 1].price + diff,    // add a grid interval on the basis of the previous highest price
          })
      }
      while (ticker.Last <= net[0].price) {                // if the price is lower than the grid line with the lowest price in the grid,
          var price = net[0].price - diff                  // distinguished from adding upwards, you should notice the price of the newly added grid line downwards cannot be less than or equal to 0, so you need to judge here
          if (price <= 0) {                                // do not add when the price is less than or equal to 0, and break the loop
              break
          }
          net.unshift({                                    // add a new grid line before the grid line with the lowest price in the grid
              buy : false,
              sell : false,
              price : price,
          })
      }
Selanjutnya, kita perlu mempertimbangkan bagaimana menerapkan pemicu perdagangan.
var diff = 50
var amount = 0.002       // add a global variable, which can also be designed as a parameter; for easy explanation, we can write it in an infinite loop
                         // the parameter controls the trading amount on the grid line each time the trading is triggered
function main() {
    var ticker = _C(exchange.GetTicker)
    var net = createNet(ticker.Last, diff)
    var preTicker = ticker       // before the start of the main (infinite) loop, set a variable, to record the market quotes of last time
    while (true) {
        ticker = _C(exchange.GetTicker)
        // check the grid range
        while (ticker.Last >= net[net.length - 1].price) {
            net.push({
                buy : false,
                sell : false,
                price : net[net.length - 1].price + diff,
            })
        }
        while (ticker.Last <= net[0].price) {
            var price = net[0].price - diff
            if (price <= 0) {
                break
            }
            net.unshift({
                buy : false,
                sell : false,
                price : price,
            })
        }

        // index the grid
        for (var i = 0 ; i < net.length ; i++) {     // traverse all grid lines in the grid data structure
            var p = net[i]
            if (preTicker.Last < p.price && ticker.Last > p.price) {         // upcross, and sell; when the current node has been traded, no matter SELL or BUY, no more trade
                if (i != 0) {
                    var downP = net[i - 1]
                    if (downP.buy) {
                        exchange.Sell(-1, amount, ticker)
                        downP.buy = false
                        p.sell = false
                        continue
                    }
                }
                if (!p.sell && !p.buy) {
                    exchange.Sell(-1, amount, ticker)
                    p.sell = true
                }
            } else if (preTicker.Last > p.price && ticker.Last < p.price) {  // downcross, and buy
                if (i != net.length - 1) {
                    var upP = net[i + 1]
                    if (upP.sell) {
                        exchange.Buy(-1, amount * ticker.Last, ticker)
                        upP.sell = false
                        p.buy = false
                        continue
                    }
                }
                if (!p.buy && !p.sell) {
                    exchange.Buy(-1, amount * ticker.Last, ticker)
                    p.buy = true
                }
            }
        }
        preTicker = ticker    // record the current market quotes in preTicker, which will be used as the "last" market quote data to compare with the new one in next loop, to judge upcross and downcross
        Sleep(500)
    }
}
Anda bisa lihat:
- Kondisi melintasi garis grid:
preTicker.Last < p.price && ticker.Last > p.price - kondisi melintasi garis bawah jaringan:
preTicker.Last > p.price && ticker.Last < p.price
Inilah yang dibicarakan dalam artikel sebelumnya:
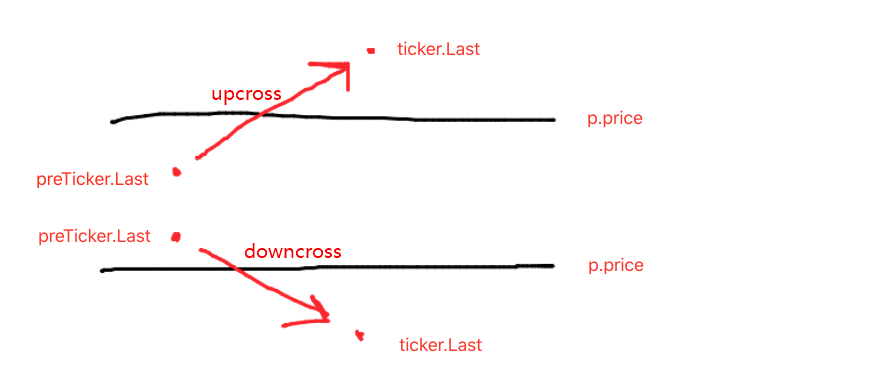
Menghakimi upcross atau downcross hanyalah langkah pertama untuk menentukan apakah akan memerintahkan dan perdagangan, dan tanda dalam data garis grid juga perlu dinilai.
Jika upcross, kemudian menilai apakah harga lebih rendah dari garis grid saat ini, serta tanda beli pada garis grid terbaru; jika nilai tanda beli benar, itu berarti garis grid terakhir yang dieksekusi membeli, dan mengatur ulang tanda beli dari garis grid terakhir sebagai salah, dan mengatur ulang tanda jual dari garis grid saat ini sebagai salah.
Setelah menilai kondisi yang disebutkan sekarang, jika mereka tidak dipicu, terus menilai. jika tanda beli dan tanda jual dari garis grid saat ini adalah salah, itu berarti garis grid saat ini dapat berdagang; karena itu upcross, di sini kita mengeksekusi operasi jual, dan menandai tanda jual dari garis grid sebagai benar setelah eksekusi.
Logika pemrosesan downcross adalah sama. (pemula dapat memikirkan ini sendiri.)
- Kondisi melintasi garis grid:
Uji Kembali Strategi Lengkap
Untuk melihat beberapa data selama backtest, fungsishowTblditulis untuk menampilkan data.
function showTbl(arr) {
    var tbl = {
        type : "table",
        title : "grid",
        cols : ["grid information"],
        rows : []
    }
    var arrReverse = arr.slice(0).reverse()
    _.each(arrReverse, function(ele) {
        var color = ""
        if (ele.buy) {
            color = "#FF0000"
        } else if (ele.sell) {
            color = "#00FF00"
        }
        tbl.rows.push([JSON.stringify(ele) + color])
    })
    LogStatus(_D(), "\n`" + JSON.stringify(tbl) + "`", "\n account information:", exchange.GetAccount())
}
Kode strategi lengkap:
/*backtest
start: 2021-04-01 22:00:00
end: 2021-05-22 00:00:00
period: 1d
basePeriod: 1m
exchanges: [{"eid":"OKEX","currency":"ETH_USDT","balance":100000}]
*/

var diff = 50
var amount = 0.002
function createNet(begin, diff) {
    var oneSideNums = 10
    var up = []
    var down = []
    for (var i = 0 ; i < oneSideNums ; i++) {
        var upObj = {
            buy : false,
            sell : false,
            price : begin + diff / 2 + i * diff,
        }
        up.push(upObj)

        var j = (oneSideNums - 1) - i
        var downObj = {
            buy : false,
            sell : false,
            price : begin - diff / 2 - j * diff,
        }
        if (downObj.price <= 0) {  // the price cannot be less than or equal to 0
            continue
        }
        down.push(downObj)
    }

    return down.concat(up)
}

function showTbl(arr) {
    var tbl = {
        type : "table",
        title : "grid",
        cols : ["grid information"],
        rows : []
    }
    var arrReverse = arr.slice(0).reverse()
    _.each(arrReverse, function(ele) {
        var color = ""
        if (ele.buy) {
            color = "#FF0000"
        } else if (ele.sell) {
            color = "#00FF00"
        }
        tbl.rows.push([JSON.stringify(ele) + color])
    })
    LogStatus(_D(), "\n`" + JSON.stringify(tbl) + "`", "\n account information:", exchange.GetAccount())
}

function main() {
    var ticker = _C(exchange.GetTicker)
    var net = createNet(ticker.Last, diff)
    var preTicker = ticker
    while (true) {
        ticker = _C(exchange.GetTicker)
        // check the grid range
        while (ticker.Last >= net[net.length - 1].price) {
            net.push({
                buy : false,
                sell : false,
                price : net[net.length - 1].price + diff,
            })
        }
        while (ticker.Last <= net[0].price) {
            var price = net[0].price - diff
            if (price <= 0) {
                break
            }
            net.unshift({
                buy : false,
                sell : false,
                price : price,
            })
        }

        // index grid
        for (var i = 0 ; i < net.length ; i++) {
            var p = net[i]
            if (preTicker.Last < p.price && ticker.Last > p.price) {         // upcross, and sell; when the current node has been traded, no matter SELL or BUY, no more trade
                if (i != 0) {
                    var downP = net[i - 1]
                    if (downP.buy) {
                        exchange.Sell(-1, amount, ticker)
                        downP.buy = false
                        p.sell = false
                        continue
                    }
                }
                if (!p.sell && !p.buy) {
                    exchange.Sell(-1, amount, ticker)
                    p.sell = true
                }
            } else if (preTicker.Last > p.price && ticker.Last < p.price) {  // downcross, and buy
                if (i != net.length - 1) {
                    var upP = net[i + 1]
                    if (upP.sell) {
                        exchange.Buy(-1, amount * ticker.Last, ticker)
                        upP.sell = false
                        p.buy = false
                        continue
                    }
                }
                if (!p.buy && !p.sell) {
                    exchange.Buy(-1, amount * ticker.Last, ticker)
                    p.buy = true
                }
            }
        }

        showTbl(net)
        preTicker = ticker
        Sleep(500)
    }
}
Strategi Backtest:
Anda dapat melihat karakteristik strategi grid. ketika ada pasar tren, akan ada kerugian mengambang besar, dan pengembalian akan bangkit dalam pasar yang tidak stabil. Oleh karena itu, strategi grid tidak bebas risiko. strategi spot masih dapat bertahan untuk membuatnya bahkan, sedangkan strategi grid kontrak berjangka lebih berisiko dan perlu mengatur parameter grid secara konservatif.
- My bahasa menulis di sini untuk mendapatkan sinyal hanya untuk mencetak dan mengekspor sekali
- Pendapatan yang tidak terhitung jumlahnya
- Gunakan SQLite untuk Membangun Basis Data Kuantum FMZ
- Pemula, periksa
Membawa Anda ke Cryptocurrency Quantitative Trading (8) - Pemula, periksa
Membawa Anda ke Cryptocurrency Quantitative Trading (7) - Pemula, periksa
Membawa Anda ke Cryptocurrency Quantitative Trading (6) - Pemula, periksa
Membawa Anda ke Cryptocurrency Quantitative Trading (3) - Pemula, periksa
Membawa Anda ke Cryptocurrency Quantitative Trading (2) - Penemu saya tidak tepat waktu.
- Berikan ide untuk strategi penulisan yang lebih baik!
- Pemula, periksa
Membawa Anda ke Cryptocurrency Quantitative Trading (4) - Waktu pembuatan pesanan dan waktu penyelesaian pesanan
- Strategi jual-beli Martin
- Jika Anda ingin memahami bahasa saya, tolong jelaskan apa yang dimaksud dengan kode ini: _TR:=MAX ((MAX (((HIGH-LOW), ABS ((REF ((CLOSE, 1) -HIGH)), ABS ((REF ((CLOSE, 1) -LOW));
- Pertanyaan tentang laporan kesalahan
- Pemula, periksa
Membawa Anda ke Cryptocurrency Quantitative Trading (1) - Apakah Anda bisa menambahkan dukungan untuk typescript?
- Strategi Hedge Spot Cryptocurrency (2)
- Strategi Hedge Spot Cryptocurrency (1)
- Dalam API Bitget, masalah muncul ketika transaksi yang dicatat pada ADA, AVAX, AXS, BCH, DOT, EOS, ETC, FIL, LINK, LTC, LUNA, MATIC, SOL, XRP ditempatkan.