Pemula, periksa Membawa Anda ke Cryptocurrency Quantitative Trading (7)
Penulis:Ninabadass, Dibuat: 2022-04-22 11:59:32, Diperbarui: 2022-04-22 12:01:11Pemula, periksa Membawa Anda ke Cryptocurrency Quantitative Trading (7)
Dalam artikel sebelumnya, kami telah memikirkan dan merancang strategi grid multi-simbol sederhana bersama. Selanjutnya, kami akan terus belajar dan bergerak maju di jalan perdagangan kuantitatif. Dalam artikel ini, kami akan membahas desain strategi yang lebih rumit - desain strategi lindung nilai. Artikel ini berencana untuk merancang strategi lindung nilai lintas periode multi-simbol. Ketika datang ke strategi lindung nilai lintas periode, mereka yang akrab dengan perdagangan berjangka harus akrab dengannya. Bagi pemula, Anda mungkin tidak memahami konsep ini, jadi mari kita jelaskan secara singkat konsep tentang lindung nilai lintas periode.
Hedge lintas periode
Secara umum, lindung nilai lintas periode memiliki kontrak membuat panjang, dan kontrak membuat pendek, dan menunggu tiga situasi (panjang, pendek) untuk menutup posisi pada saat yang sama:
- Ketika membuat panjang menguntungkan, membuat pendek memiliki kerugian, dan keuntungan lebih dari kerugian, posisi tutup; akan ada pengembalian setelah keuntungan menutupi kerugian.
- Ketika melakukan short adalah menguntungkan, membuat panjang memiliki kerugian, dan keuntungan lebih dari kerugian, posisi tutup; akan ada pengembalian setelah keuntungan menutupi kerugian. (mirip)
- Ketika membuat panjang menguntungkan, dan membuat pendek juga menguntungkan, jangan ragu untuk menutup posisi!
Untuk situasi lain ketika ada kerugian yang mengambang, Anda dapat mempertahankan atau terus menambahkan lebih banyak posisi. (karena fluktuasi spread lebih kecil daripada fluktuasi satu sisi, risikonya akan lebih kecil, tetapi perhatikan bahwa hanya komparatif!)
Set A1 as the price of contract A at the time 1, and set B1 as the price of contract B at the time 1. At the time, do short in contract A, at A1; do long in contract B, at B1.
Set A2 as the price of contract A at the time 2, and set B2 as the price of contract B at the time 2. At the time, close positions (close short) of contract A, at A2; close positions (close long) of contract B, at B2.

Spread at time 1: A1 - B1 = X
Spread at time 2: A2 - B2 = Y
X - Y = A1 - B1 - (A2 - B2)
X - Y = A1 - B1 - A2 + B2
X - Y = A1 - A2 + B2 - B1

As you can see, "A1 - A2 " is the profit spread of closing position in contract A.
"B2 - B1" is the profit spread of closing position in contract B. It is profitable, as long as the closing postion spread of the two contracts is a positive number, namely A1 - A2 + B2 - B1 > 0. That is to say as long as X - Y > 0,
for: X - Y = A1 - A2 + B2 - B1

It is concluded that as long as the spread X when opening a position is greater than the spread Y when closing a position, it is profitable (note that it is making short in contract A and making long in contract B to open a position; if the situation is reversed, the result will be opposite). Of course, this is just theoretical, and factors such as the handling fee and slippoint should also be considered in practice.
Karena platform cryptocurrency memiliki kontrak pengiriman dan kontrak abadi. Dan harga kontrak abadi selalu dekat dengan harga spot karena tingkat pendanaan. Kemudian kita memilih untuk menggunakan kontrak pengiriman dan kontrak abadi untuk melakukan lindung nilai dan arbitrase. Untuk kontrak pengiriman, kita dapat memilih satu dengan periode yang relatif panjang, sehingga kontrak lindung nilai tidak perlu ditetapkan sering.
Pemanasan oleh Beberapa Statistik Penyebaran Multi-Simbol
Setelah Anda terbiasa dengan prinsip dasar, Anda tidak perlu terburu-buru dalam menulis strategi. Pertama, buatlah statistik spread, grafik plot, dan amati spread. Mari belajar tentang plot strategi multi-simbol bersama-sama. Kami mendesainnya berdasarkanKontrak OKEX. Sangat mudah untuk plot pada FMZ, dan Anda hanya perlu menggunakan fungsi terkapas, dengan perpustakaan grafikHighchart. Deskripsi fungsi plotting dalam dokumentasi API:https://www.fmz.com/api#chart..Aku tidak tahu. Karena ini adalah strategi multi-simbol, pertama-tama, perlu untuk menentukan spread harga dari simbol-simbol tersebut sebelum plot. dalam kode, menulis dua array pertama, mewakili kontrak yang akan dilakukan.
var arrSwapContractType = ["BTC-USDT-SWAP", "LTC-USDT-SWAP", "ETH-USDT-SWAP", "ETC-USDT-SWAP"]   // perpetual contract
var arrDeliveryContractType = ["BTC-USDT-210924", "LTC-USDT-210924", "ETH-USDT-210924", "ETC-USDT-210924"]  // delivery contract
Menurut kode kontrak yang ditetapkan di sini, inisialisasi konfigurasi grafik. Konfigurasi grafik tidak dapat ditulis dalam loop tak terbatas, karena Anda tidak tahu simbol apa yang harus dilakukan, dan berapa banyak simbol yang harus dilakukan (yang ditentukan sesuai dengan nilai arrDeliveryContractType dan arrSwapContractType), sehingga konfigurasi grafik dikembalikan oleh satu fungsi.
function createCfg(symbol) {
    var cfg = {
        extension: {
            // it is not part of the group, and is individually displayed; the default is 'group'
            layout: 'single',
            // the specified height, which can be set as string; "300px", which means it will be replaced by "300px" automatically through setting a value of 300
            height: 300,
            // the occupied unit value of the specified width, with a total value of 12
            col: 6
        },
        title: {
            text: symbol
        },
        xAxis: {
            type: 'datetime'
        },
        series: [{
            name: 'plus',
            data: []
        }]
    }

    return cfg
}

function main() {
    // declare arrCfg
    var arrCfg = []                                    // declare an array to store the chart configuration information
    _.each(arrSwapContractType, function(ct) {         // iteratively record the array of perpetual contract codes, pass the "XXX-USDT" part of the contract name as a parameter to the "createCfg" function, construct the chart configuration information, and return
        arrCfg.push(createCfg(formatSymbol(ct)[0]))    // the chart configuration information "push" returned by "createCfg" is in the "arrCfg" array
    })
    var objCharts = Chart(arrCfg)                      // call the function Chart on FMZ platform, and create a chart controlled object called objCharts
    objCharts.reset()                                  // initialize the chart content

    // the rest is omitted...
}
Kami akan menyiapkan data; kami menggunakan antarmuka pasar agregat kontrak OKEX:
Kontrak abadi USDT:
https://www.okex.com/api/v5/market/tickers?instType=SWAP
Kontrak pengiriman USDT:
https://www.okex.com/api/v5/market/tickers?instType=FUTURES
Di sini kita menulis fungsi untuk menangani panggilan dari dua antarmuka, dan memproses data ke dalam satu format:
function getTickers(url) {
    var ret = []
    try {
        var arr = JSON.parse(HttpQuery(url)).data
        _.each(arr, function(ele) {
            ret.push({
                bid1: parseFloat(ele.bidPx),             // buy one price
                bid1Vol: parseFloat(ele.bidSz),          // volume of buy one price
                ask1: parseFloat(ele.askPx),             // ell one price
                ask1Vol: parseFloat(ele.askSz),          // volume of sell one price
                symbol: formatSymbol(ele.instId)[0],     // in the format of trading pair
                type: "Futures",                         // type
                originalSymbol: ele.instId               // original contract code
            })
        })
    } catch (e) {
        return null
    }
    return ret
}
Tulis satu fungsi lagi untuk memproses kode kontrak.
function formatSymbol(originalSymbol) {
    var arr = originalSymbol.split("-")
    return [arr[0] + "_" + arr[1], arr[0], arr[1]]
}
Selanjutnya, kita hanya perlu mengulangi dan mencocokkan data yang diperoleh, menghitung spread, dan grafik plot untuk ekspor, dll.
Di sini kita menguji penyebaran kontrak kuartal berikutnya 210924 dan kontrak abadi.
Kode lengkap:
// temporary parameters
var arrSwapContractType = ["BTC-USDT-SWAP", "LTC-USDT-SWAP", "ETH-USDT-SWAP", "ETC-USDT-SWAP"]
var arrDeliveryContractType = ["BTC-USDT-210924", "LTC-USDT-210924", "ETH-USDT-210924", "ETC-USDT-210924"]
var interval = 2000

function createCfg(symbol) {
    var cfg = {
        extension: {
            // it is not part of the group, and is individually displayed; the default is 'group'
            layout: 'single',
            // the specified height, which can be set as string; "300px", which means it will be replaced by "300px" automatically through setting a value of 300
            height: 300,
            // the occupied unit value of the specified width, with a total value of 12
            col: 6
        },
        title: {
            text: symbol
        },
        xAxis: {
            type: 'datetime'
        },
        series: [{
            name: 'plus',
            data: []
        }]
    }

    return cfg
}

function formatSymbol(originalSymbol) {
    var arr = originalSymbol.split("-")
    return [arr[0] + "_" + arr[1], arr[0], arr[1]]
}

function getTickers(url) {
    var ret = []
    try {
        var arr = JSON.parse(HttpQuery(url)).data
        _.each(arr, function(ele) {
            ret.push({
                bid1: parseFloat(ele.bidPx),
                bid1Vol: parseFloat(ele.bidSz),
                ask1: parseFloat(ele.askPx),
                ask1Vol: parseFloat(ele.askSz),
                symbol: formatSymbol(ele.instId)[0],
                type: "Futures",
                originalSymbol: ele.instId
            })
        })
    } catch (e) {
        return null
    }
    return ret
}

function main() {
    // declare arrCfg
    var arrCfg = []
    _.each(arrSwapContractType, function(ct) {
        arrCfg.push(createCfg(formatSymbol(ct)[0]))
    })
    var objCharts = Chart(arrCfg)
    objCharts.reset()

    while (true) {
        // obtain the market quote data
        var deliveryTickers = getTickers("https://www.okex.com/api/v5/market/tickers?instType=FUTURES")
        var swapTickers = getTickers("https://www.okex.com/api/v5/market/tickers?instType=SWAP")
        if (!deliveryTickers || !swapTickers) {
            Sleep(2000)
            continue
        }

        var tbl = {
            type : "table",
            title : "delivery-perpetual spread",
            cols : ["trading pair", "delivery", "perpetual", "positive hedge", "negative hedge"],
            rows : []
        }

        var subscribeDeliveryTickers = []
        var subscribeSwapTickers = []
        _.each(deliveryTickers, function(deliveryTicker) {
            _.each(arrDeliveryContractType, function(symbol) {
                if (deliveryTicker.originalSymbol == symbol) {
                    subscribeDeliveryTickers.push(deliveryTicker)
                }
            })
        })
        _.each(swapTickers, function(swapTicker) {
            _.each(arrSwapContractType, function(symbol) {
                if (swapTicker.originalSymbol == symbol) {
                    subscribeSwapTickers.push(swapTicker)
                }
            })
        })

        var pairs = []
        var ts = new Date().getTime()
        _.each(subscribeDeliveryTickers, function(deliveryTicker) {
            _.each(subscribeSwapTickers, function(swapTicker) {
                if (deliveryTicker.symbol == swapTicker.symbol) {
                    var pair = {symbol: swapTicker.symbol, swapTicker: swapTicker, deliveryTicker: deliveryTicker, plusDiff: deliveryTicker.bid1 - swapTicker.ask1, minusDiff: deliveryTicker.ask1 - swapTicker.bid1}
                    pairs.push(pair)
                    tbl.rows.push([pair.symbol, deliveryTicker.originalSymbol, swapTicker.originalSymbol, pair.plusDiff, pair.minusDiff])
                    for (var i = 0 ; i < arrCfg.length ; i++) {
                        if (arrCfg[i].title.text == pair.symbol) {
                            objCharts.add([i, [ts, pair.plusDiff]])
                        }
                    }
                }
            })
        })

        LogStatus(_D(), "\n`" + JSON.stringify(tbl) + "`")
        Sleep(interval)
    }
}
Operasi Bot
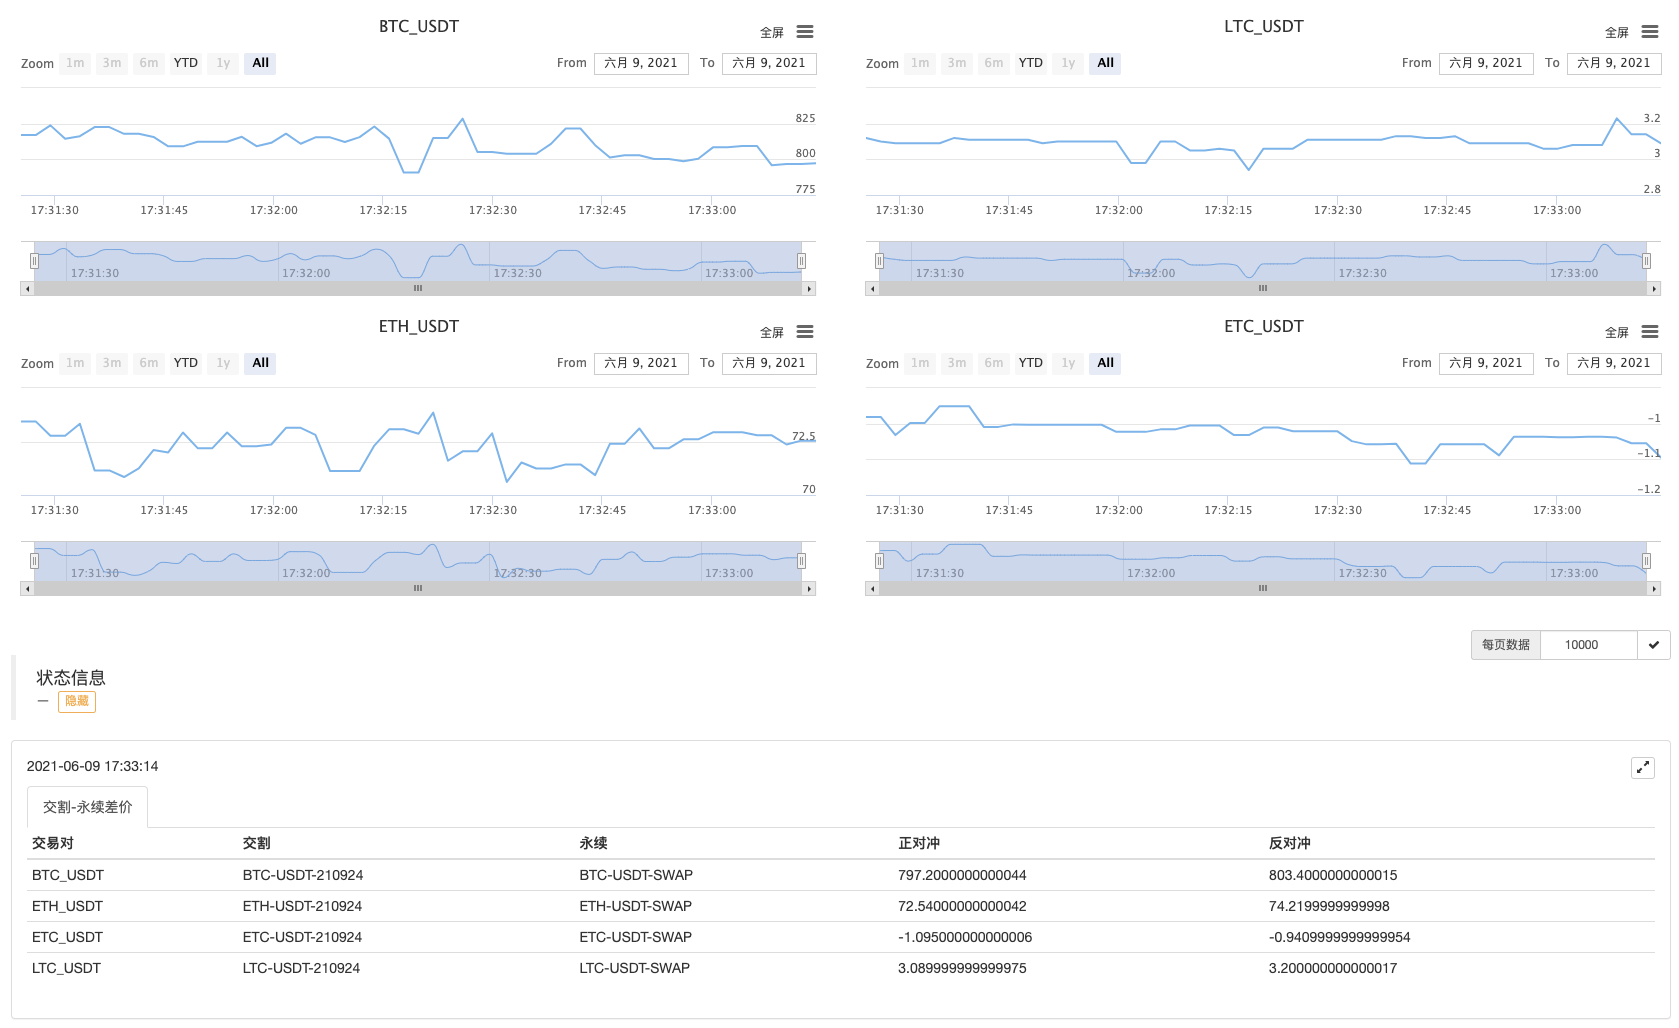
Larilah sebentar.
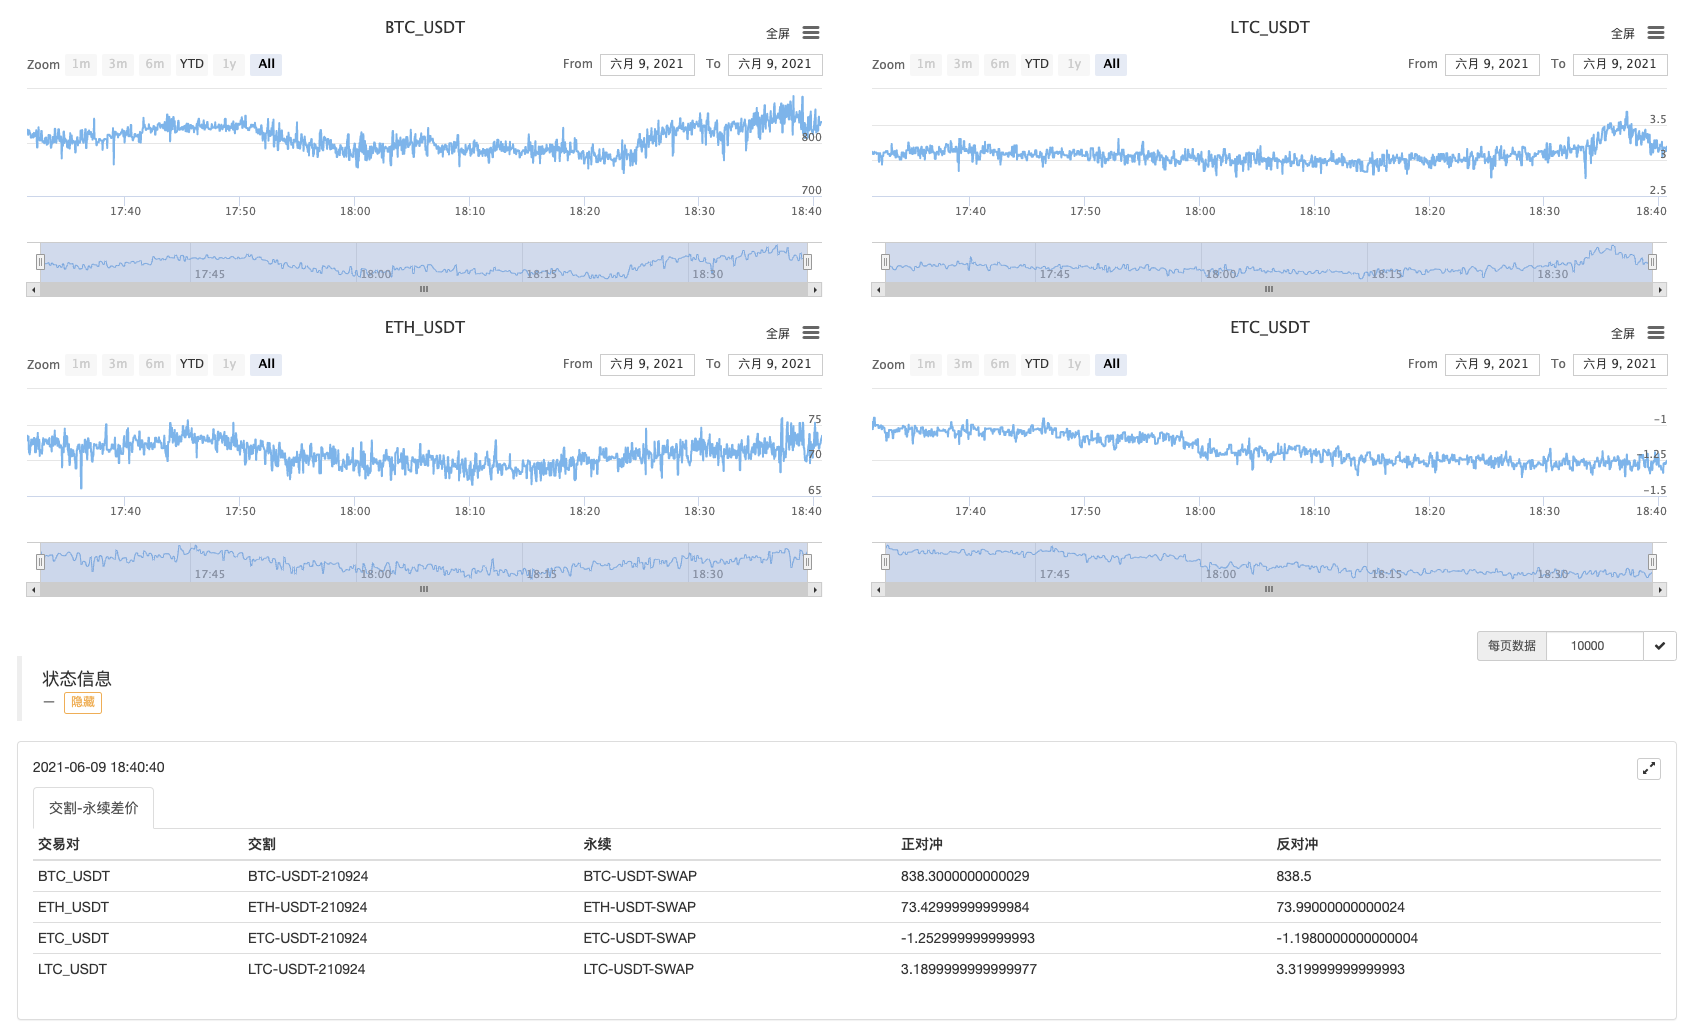
Perhatikan penyebaran pertama!
- Analisis Strategi Pengumpul Keuntungan (1)
- Jika Anda ingin mengubah usdt dari Python menjadi busd, Anda harus mengubah fungsi mana yang akan mempengaruhi ini.
- Tambahkan Stoploss untuk mengendalikan risiko
Berapa Harga? - Diskusi tentang Desain Strategi Frekuensi Tinggi
Magically Modified Profit Harvester - Binance Perpetual Funding Rate Arbitrage (100% dari Tingkat Tahunan di Bull Market)
- Menggunakan Platform Cryptocurrency Aggregated Market Interface untuk Membangun Strategi Multi-Simbol
- My bahasa menulis di sini untuk mendapatkan sinyal hanya untuk mencetak dan mengekspor sekali
- Pendapatan yang tidak terhitung jumlahnya
- Gunakan SQLite untuk Membangun Basis Data Kuantum FMZ
- Pemula, periksa
Membawa Anda ke Cryptocurrency Quantitative Trading (8) - Pemula, periksa
Membawa Anda ke Cryptocurrency Quantitative Trading (6) - Pemula, periksa
Membawa Anda ke Cryptocurrency Quantitative Trading (3) - Pemula, periksa
Membawa Anda ke Cryptocurrency Quantitative Trading (2) - Penemu saya tidak tepat waktu.
- Berikan ide untuk strategi penulisan yang lebih baik!
- Pemula, periksa
Membawa Anda ke Cryptocurrency Quantitative Trading (5) - Pemula, periksa
Membawa Anda ke Cryptocurrency Quantitative Trading (4) - Waktu pembuatan pesanan dan waktu penyelesaian pesanan
- Strategi jual-beli Martin
- Jika Anda ingin memahami bahasa saya, tolong jelaskan apa yang dimaksud dengan kode ini: _TR:=MAX ((MAX (((HIGH-LOW), ABS ((REF ((CLOSE, 1) -HIGH)), ABS ((REF ((CLOSE, 1) -LOW));