Strategi supertrend berdasarkan ATR dan trailing stop


Tanggal Pembuatan: 2023-11-28 14:56:59 Akhirnya memodifikasi: 2023-11-28 14:56:59
menyalin: 0 Jumlah klik: 939
1
fokus pada
1617
Pengikut

Strategi supertrend berdasarkan ATR dan trailing stop

Ringkasan

Strategi ini mendesain garis stop loss dan reversal yang bergerak berdasarkan pada rata-rata amplitudo pergerakan nyata (ATR). Ini akan mengikuti perubahan harga untuk trailing stop loss, yaitu untuk menelusuri perubahan stop loss. Secara khusus, jika perubahan harga lebih dari 1%, garis stop loss akan bergerak ke arah keuntungan dengan proporsi tetap.

Prinsip Strategi

Strategi ini menggunakan indikator ATR untuk menghitung stop loss line. Rumusnya adalah sebagai berikut:

atr = multplierFactor * atr(barsBack)

longStop = hl2 - atr 
shortStop = hl2 + atr

MultiplierFactor adalah ATR yang diperbesar dan barBack adalah jumlah siklus ATR.

Berdasarkan nilai ATR, garis stop longStop dan garis stop shortStop dihitung. Sinyal perdagangan dikirim ketika harga melebihi kedua garis tersebut.

Selain itu, strategi ini juga memperkenalkan variabel arah untuk menentukan arah tren:

direction = 1
direction := nz(direction[1], direction) 
direction := direction == -1 and close > shortStopPrev ? 1 : direction == 1 and close < longStopPrev ? -1 : direction

Jika arahnya adalah 1 berarti berada dalam tren multihead, jika arahnya adalah -1 berarti berada dalam tren kosong.

Berdasarkan nilai variabel arah, garis stop loss akan digambarkan dengan warna yang berbeda:

if (direction == 1)
    valueToPlot := longStop
    colorToPlot := color.green 
else
    valueToPlot := shortStop
    colorToPlot := color.red

Ini akan membantu Anda melihat dengan jelas arah tren saat ini dan lokasi garis stop loss.

Pelacakan mekanisme stop loss

Kunci dari strategi ini adalah adanya mekanisme tracking stop loss yang dapat menyesuaikan stop loss line secara real-time sesuai dengan pergerakan harga.

Logika spesifiknya adalah sebagai berikut:

strategyPercentege = (close - updatedEntryPrice) / updatedEntryPrice * 100.00
rideUpStopLoss = hasOpenTrade() and strategyPercentege > 1

if (rideUpStopLoss) 
    stopLossPercent := stopLossPercent + strategyPercentege - 1.0
    newStopLossPrice = updatedEntryPrice + (updatedEntryPrice * stopLossPercent) / 100
    stopLossPrice := max(stopLossPrice, newStopLossPrice)
    updatedEntryPrice := stopLossPrice

Jika harga naik lebih dari 1% dari harga masuk, maka track up the adjustment stop loss line.

Dengan begitu, Anda bisa mengunci lebih banyak keuntungan dan mengurangi kerugian.

Analisis Keunggulan

Keuntungan terbesar dari strategi ini dibandingkan dengan strategi mobile stop loss tradisional adalah kemampuan untuk secara dinamis menyesuaikan garis stop loss sesuai dengan kondisi pasar. Keuntungan spesifiknya adalah sebagai berikut:

  1. Dengan demikian, Anda dapat mengalokasikan keuntungan yang lebih tinggi dalam situasi yang sedang tren.

Mekanisme tracking stop loss memungkinkan stop loss line untuk terus bergerak ke arah profit, sehingga dapat mengunci keuntungan yang lebih tinggi jika pasar terus kuat.

  1. Stop loss yang dapat mengurangi volatilitas

Ketika tren pasar berubah, garis stop loss yang bergerak tetap dapat dengan mudah dilewati. Dan garis stop loss dari strategi ini didasarkan pada perhitungan volatilitas pasar, yang dapat secara rasional melacak perubahan harga dan menghindari terlewatkan pada saat pencatatan.

  1. Operasi sederhana, mudah untuk otomatisasi

Strategi ini sepenuhnya didasarkan pada operasi indikator, tanpa logika penilaian tren yang rumit.

  1. Parameter yang dapat disesuaikan untuk varietas yang berbeda

Parameter seperti siklus ATR, faktor penguatan, dan stop loss dapat disesuaikan dan dapat dioptimalkan untuk parameter varietas yang berbeda, sehingga strategi lebih universal.

Analisis risiko

Meskipun ada banyak keuntungan dari strategi ini, ada beberapa risiko yang perlu diperhatikan:

  1. Tidak dapat menentukan titik balik tren, ada risiko mengejar naik dan turun

Strategi ini tidak menentukan apakah tren akan berakhir secara logis atau tidak. Pada akhir periode bull market, kemungkinan besar akan terjadi perburuan.

  1. Parameter yang tidak tepat dapat memperbesar kerugian

Jika parameter ATR terlalu pendek, stop loss akan terlalu sensitif dan mungkin akan sering dipicu oleh pergerakan getaran.

  1. Ada risiko terputus dari bouncing transkrip

Strategi ini tidak mempertimbangkan titik klasifikasi sebagai titik stop loss support. Oleh karena itu, mungkin juga akan dikeluarkan dari pasar jika ada bouncing short line.

Ada beberapa cara untuk mengoptimalkan risiko yang disebutkan di atas:

  1. Indikator Trend Wave dan Trend Reversal

  2. Tes optimasi parameter, memilih kombinasi parameter optimal

  3. Peningkatan jangkauan stop loss di sekitar titik dukungan tertentu

Arah optimasi

Strategi ini masih bisa dioptimalkan lebih jauh:

  1. Penghakiman bentuk garis K

Kemungkinan terbaliknya tren dapat diidentifikasi dengan mengidentifikasi beberapa bentuk K-line khas, seperti backswing, shooting star, dan lain-lain. Hal ini dapat menghindari risiko mengejar kenaikan dan penurunan.

  1. Pengoptimalan parameter pelacakan dinamis

Periode ATR, faktor penguatan dan parameter lainnya dapat berubah secara dinamis, dengan menggunakan periode ATR yang lebih lama dan rentang penghematan yang lebih luas di pasar yang sangat berfluktuasi.

  1. Menggabungkan model pembelajaran mesin

Dengan menggunakan model pembelajaran mendalam seperti lstm, rnn, dan lain-lain untuk memprediksi kisaran harga yang mungkin terjadi di pasar lepas, dan secara dinamis menyesuaikan jarak stop loss.

Meringkaskan

Strategi overall ini menggunakan indikator ATR untuk mendesain garis stop loss yang bergerak, dan memperkenalkan mekanisme stop loss yang dapat dilacak, yang dapat menyesuaikan perpindahan posisi stop loss secara real-time sesuai dengan perubahan kondisi pasar. Hal ini memungkinkan penguncian keuntungan yang lebih tinggi, tetapi juga mengurangi risiko. Dengan pengoptimalan lebih lanjut, strategi ini dapat dibuat lebih dapat beradaptasi dengan berbagai situasi pasar, menjadi strategi perdagangan yang lebih fleksibel.
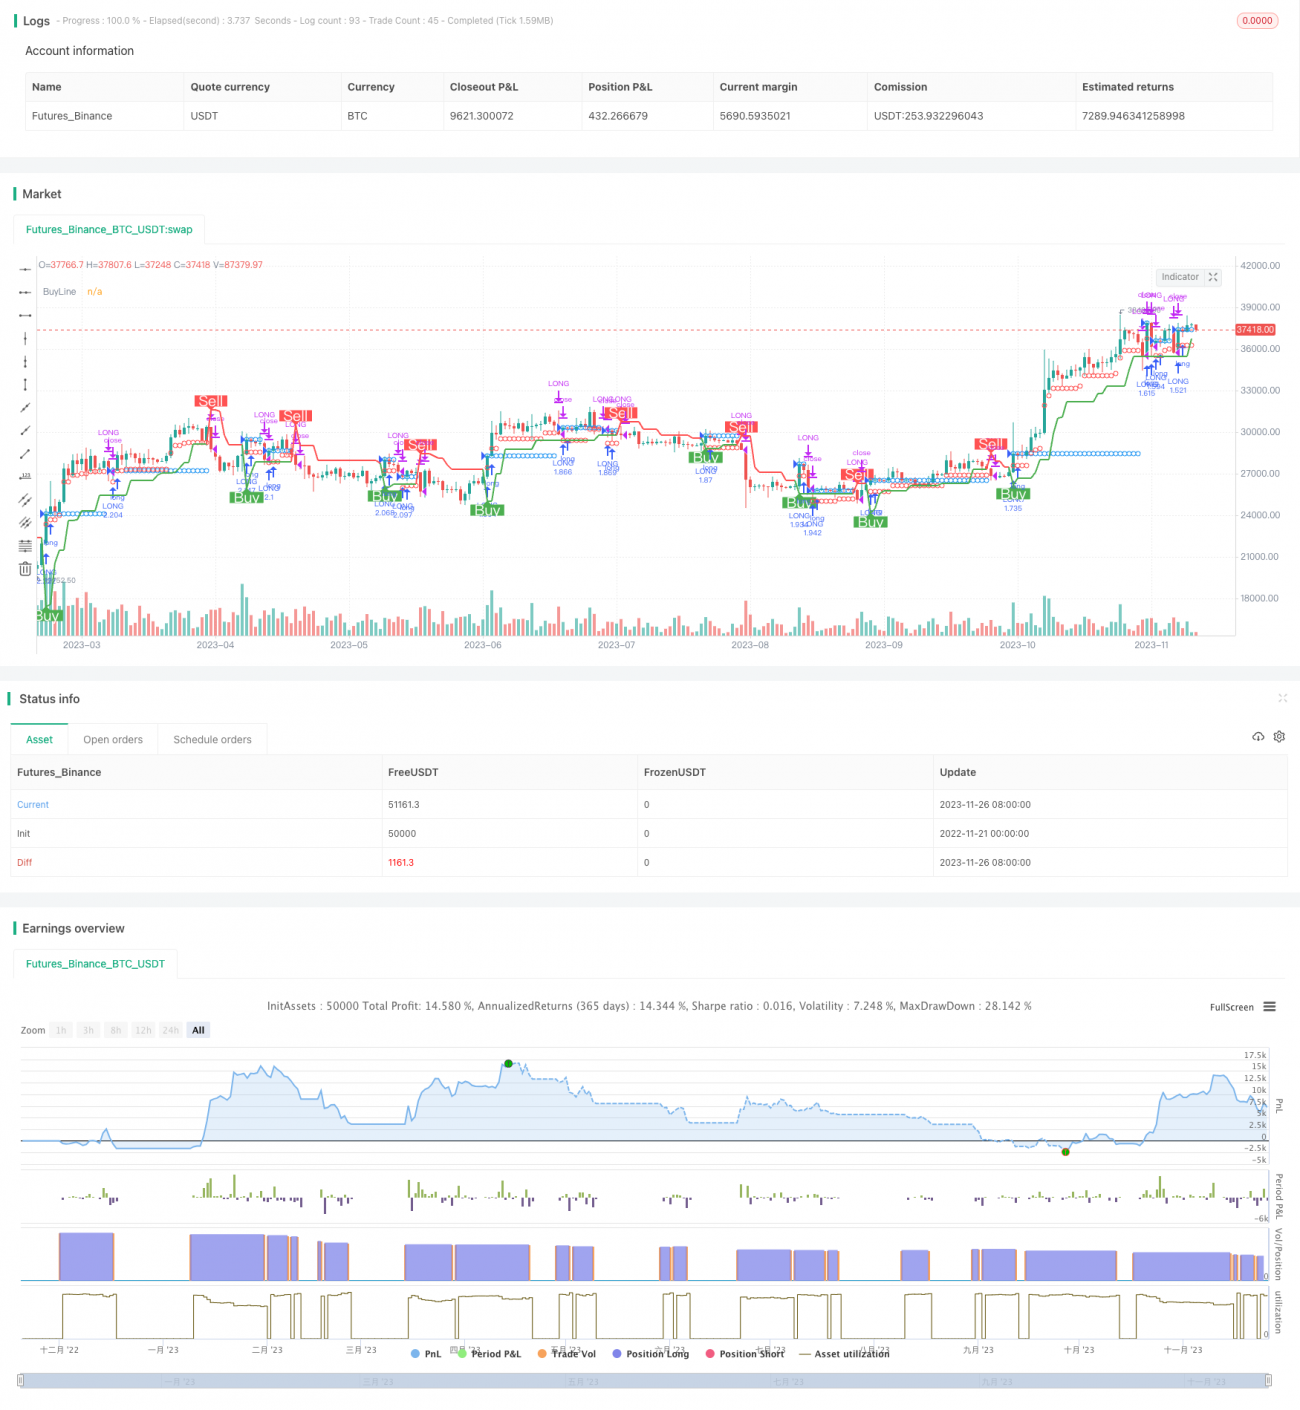
Kode Sumber Strategi
/*backtest
start: 2022-11-21 00:00:00
end: 2023-11-27 00:00:00
period: 1d
basePeriod: 1h
exchanges: [{"eid":"Futures_Binance","currency":"BTC_USDT"}]
*/

//@version=4
//
// ▒▒▒▒▒▒▒▒▒▒▒▒▒▒▒▒▒▒▒▒▒▒▒▒▒▒▒▒▒▒▒▒▒▒▒▒▒▒▒▒▒▒▒▒▒▒▒▒▒▒▒▒▒▒▒▒▒▒▒▒▒▒▒▒▒▒▒▒▒▒▒▒▒▒▒▒▒▒▒▒▒▒▒▒▒▒▒▒▒▒▒▒▒▒▒▒▒▒▒▒▒▒▒▒▒▒▒▒▒▒▒▒▒▒ 
//  -----------------------------------------------------------------------------
//  Copyright 2019 Mauricio Pimenta | exit490
//  SuperTrend with Trailing Stop Loss script may be freely distributed under the MIT license.
//
//  Permission is hereby granted, free of charge, 
//  to any person obtaining a copy of this software and associated documentation files (the "Software"), 
//  to deal in the Software without restriction, including without limitation the rights to use, copy, modify, merge, 
//  publish, distribute, sublicense, and/or sell copies of the Software, and to permit persons to whom the Software is furnished to do so, 
//  subject to the following conditions:
//
//  The above copyright notice and this permission notice shall be included in all copies or substantial portions of the Software.
//
//  THE SOFTWARE IS PROVIDED "AS IS", WITHOUT WARRANTY OF ANY KIND, 
//  EXPRESS OR IMPLIED, INCLUDING BUT NOT LIMITED TO THE WARRANTIES OF MERCHANTABILITY, 
//  FITNESS FOR A PARTICULAR PURPOSE AND NONINFRINGEMENT. IN NO EVENT SHALL THE AUTHORS OR COPYRIGHT HOLDERS BE LIABLE FOR ANY CLAIM, 
//  DAMAGES OR OTHER LIABILITY, WHETHER IN AN ACTION OF CONTRACT, TORT OR OTHERWISE, ARISING FROM, 
//  OUT OF OR IN CONNECTION WITH THE SOFTWARE OR THE USE OR OTHER DEALINGS IN THE SOFTWARE.
//
//  -----------------------------------------------------------------------------
//
//  Authors:  @exit490
//  Revision: v1.0.0
//  Date:     5-Aug-2019
//
//  Description
//  ===========
//  SuperTrend is a moving stop and reversal line based on the volatility (ATR).
//  The strategy will ride up your stop loss when price moviment 1%.
//  The strategy will close your operation when the market price crossed the stop loss.
//  The strategy will close operation when the line based on the volatility will crossed
//
//  The strategy has the following parameters:
//
//  INITIAL STOP LOSS - Where can isert the value to first stop.
//  POSITION TYPE - Where can to select trade position.
//  ATR PERIOD - To select number of bars back to execute calculation
//  ATR MULTPLIER - To add a multplier factor on volatility
//  BACKTEST PERIOD - To select range.
//  
//  -----------------------------------------------------------------------------
//  Disclaimer:
//    1. I am not licensed financial advisors or broker dealers. I do not tell you 
//       when or what to buy or sell. I developed this software which enables you 
//       execute manual or automated trades multplierFactoriplierFactoriple trades using TradingView. The 
//       software allows you to set the criteria you want for entering and exiting 
//       trades.
//    2. Do not trade with money you cannot afford to lose.
//    3. I do not guarantee consistent profits or that anyone can make money with no 
//       effort. And I am not selling the holy grail.
//    4. Every system can have winning and losing streaks.
//    5. Money management plays a large role in the results of your trading. For 
//       example: lot size, account size, broker leverage, and broker margin call 
//       rules all have an effect on results. Also, your Take Profit and Stop Loss 
//       settings for individual pair trades and for overall account equity have a 
//       major impact on results. If you are new to trading and do not understand 
//       these items, then I recommend you seek education materials to further your
//       knowledge.
//
//    YOU NEED TO FIND AND USE THE TRADING SYSTEM THAT WORKS BEST FOR YOU AND YOUR 
//    TRADING TOLERANCE.
//
//    I HAVE PROVIDED NOTHING MORE THAN A TOOL WITH OPTIONS FOR YOU TO TRADE WITH THIS PROGRAM ON TRADINGVIEW.
//    
//    I accept suggestions to improve the script.
//    If you encounter any problems I will be happy to share with me.
//  -----------------------------------------------------------------------------
//
// ▒▒▒▒▒▒▒▒▒▒▒▒▒▒▒▒▒▒▒▒▒▒▒▒▒▒▒▒▒▒▒▒▒▒▒▒▒▒▒▒▒▒▒▒▒▒▒▒▒▒▒▒▒▒▒▒▒▒▒▒▒▒▒▒▒▒▒▒▒▒▒▒▒▒▒▒▒▒▒▒▒▒▒▒▒▒▒▒▒▒▒▒▒▒▒▒▒▒▒▒▒▒▒▒▒▒▒▒▒▒▒▒▒▒ //

strategy(title = "SUPERTREND ATR WITH TRAILING STOP LOSS",
         shorttitle = "SUPERTREND ATR WITH TSL",
         overlay = true,
         precision = 8,
         calc_on_order_fills = true,
         calc_on_every_tick = true,
         backtest_fill_limits_assumption = 0,
         default_qty_type = strategy.percent_of_equity,
         default_qty_value = 100,
         initial_capital = 1000,
         currency = currency.USD,
         linktoseries = true)

//
// ▒▒▒▒▒▒▒▒▒▒▒▒▒▒▒▒▒▒▒▒▒▒▒▒▒▒▒▒▒▒▒▒▒▒▒▒▒▒▒▒▒▒▒▒▒▒▒▒▒▒▒▒▒▒▒▒▒▒▒▒▒▒▒▒▒▒▒▒▒▒▒▒▒▒▒▒▒▒▒▒▒▒▒▒▒▒▒▒▒▒▒▒▒▒▒▒▒▒▒▒▒▒▒▒▒▒▒▒▒▒▒▒▒▒ //

// === BACKTEST RANGE ===
backTestSectionFrom = input(title = "═══════════════ FROM ═══════════════", defval = true, type = input.bool)

FromMonth       = input(defval = 1, title = "Month", minval = 1)
FromDay         = input(defval = 1, title = "Day", minval = 1)
FromYear        = input(defval = 2019, title = "Year", minval = 2014)

backTestSectionTo = input(title = "════════════════ TO ════════════════", defval = true, type = input.bool)
ToMonth         = input(defval = 31, title = "Month", minval = 1)
ToDay           = input(defval = 12, title = "Day", minval = 1)
ToYear          = input(defval = 9999, title = "Year", minval = 2014)

backTestPeriod() => (time > timestamp(FromYear, FromMonth, FromDay, 00, 00)) and (time < timestamp(ToYear, ToMonth, ToDay, 23, 59))

//
// ▒▒▒▒▒▒▒▒▒▒▒▒▒▒▒▒▒▒▒▒▒▒▒▒▒▒▒▒▒▒▒▒▒▒▒▒▒▒▒▒▒▒▒▒▒▒▒▒▒▒▒▒▒▒▒▒▒▒▒▒▒▒▒▒▒▒▒▒▒▒▒▒▒▒▒▒▒▒▒▒▒▒▒▒▒▒▒▒▒▒▒▒▒▒▒▒▒▒▒▒▒▒▒▒▒▒▒▒▒▒▒▒▒▒ //

parameterSection = input(title = "═════════════ STRATEGY ═════════════", defval = true, type = input.bool)
// === INPUT TO SELECT POSITION ===
positionType = input(defval="LONG", title="Position Type", options=["LONG", "SHORT"])

// === INPUT TO SELECT INITIAL STOP LOSS
initialStopLossPercent = input(defval = 3.0, minval = 0.0, title="Initial Stop Loss")

// === INPUT TO SELECT BARS BACK
barsBack = input(title="ATR Period", defval=1)

// === INPUT TO SELECT MULTPLIER FACTOR 
multplierFactor = input(title="ATR multplierFactoriplier", step=0.1, defval=3.0)

//
// ▒▒▒▒▒▒▒▒▒▒▒▒▒▒▒▒▒▒▒▒▒▒▒▒▒▒▒▒▒▒▒▒▒▒▒▒▒▒▒▒▒▒▒▒▒▒▒▒▒▒▒▒▒▒▒▒▒▒▒▒▒▒▒▒▒▒▒▒▒▒▒▒▒▒▒▒▒▒▒▒▒▒▒▒▒▒▒▒▒▒▒▒▒▒▒▒▒▒▒▒▒▒▒▒▒▒▒▒▒▒▒▒▒▒ //

// LOGIC TO FIND DIRECTION WHEN THERE IS TREND CHANGE ACCORDING VOLATILITY
atr = multplierFactor * atr(barsBack)

longStop = hl2 - atr
longStopPrev = nz(longStop[1], longStop)
longStop := close[1] > longStopPrev ? max(longStop, longStopPrev) : longStop

shortStop = hl2 + atr
shortStopPrev = nz(shortStop[1], shortStop)
shortStop := close[1] < shortStopPrev ? min(shortStop, shortStopPrev) : shortStop

direction = 1
direction := nz(direction[1], direction)
direction := direction == -1 and close > shortStopPrev ? 1 : direction == 1 and close < longStopPrev ? -1 : direction

longColor = color.blue
shortColor = color.blue

var valueToPlot = 0.0
var colorToPlot = color.white

if (direction == 1)
    valueToPlot := longStop
    colorToPlot := color.green
else
    valueToPlot := shortStop
    colorToPlot := color.red

//
// ▒▒▒▒▒▒▒▒▒▒▒▒▒▒▒▒▒▒▒▒▒▒▒▒▒▒▒▒▒▒▒▒▒▒▒▒▒▒▒▒▒▒▒▒▒▒▒▒▒▒▒▒▒▒▒▒▒▒▒▒▒▒▒▒▒▒▒▒▒▒▒▒▒▒▒▒▒▒▒▒▒▒▒▒▒▒▒▒▒▒▒▒▒▒▒▒▒▒▒▒▒▒▒▒▒▒▒▒▒▒▒▒▒▒ //
//
// === GLOBAL VARIABLES AND FUNCTIONS TO STORE IMPORTANT CONDITIONALS TO TRAILING STOP
hasEntryLongConditional() => direction == 1
hasCloseLongConditional() => direction == -1

hasEntryShortConditional() => direction == -1
hasCloseShortConditional() => direction == 1

stopLossPercent = positionType == "LONG" ? initialStopLossPercent * -1 : initialStopLossPercent

var entryPrice = 0.0
var updatedEntryPrice = 0.0
var stopLossPrice = 0.0

hasOpenTrade() => strategy.opentrades != 0
notHasOpenTrade() => strategy.opentrades == 0

strategyClose() =>
    if positionType == "LONG"
        strategy.close("LONG", when=true)
    else 
        strategy.close("SHORT", when=true)

strategyOpen() =>
    if positionType == "LONG"
        strategy.entry("LONG", strategy.long, when=true)
    else 
        strategy.entry("SHORT", strategy.short, when=true)

isLong() => positionType == "LONG" ? true : false
isShort() => positionType == "SHORT" ? true : false


//
// ▒▒▒▒▒▒▒▒▒▒▒▒▒▒▒▒▒▒▒▒▒▒▒▒▒▒▒▒▒▒▒▒▒▒▒▒▒▒▒▒▒▒▒▒▒▒▒▒▒▒▒▒▒▒▒▒▒▒▒▒▒▒▒▒▒▒▒▒▒▒▒▒▒▒▒▒▒▒▒▒▒▒▒▒▒▒▒▒▒▒▒▒▒▒▒▒▒▒▒▒▒▒▒▒▒▒▒▒▒▒▒▒▒▒ //
//
// === LOGIC TO TRAILING STOP IN LONG POSITION

if (isLong() and backTestPeriod())

    crossedStopLoss = close <= stopLossPrice
    terminateOperation = hasOpenTrade() and (crossedStopLoss or hasCloseLongConditional())

    if (terminateOperation)
        entryPrice := 0.0
        updatedEntryPrice := entryPrice
        stopLossPrice := 0.0
        strategyClose()
    
    startOperation = notHasOpenTrade() and hasEntryLongConditional()

    if(startOperation)
        entryPrice := close
        updatedEntryPrice := entryPrice
        stopLossPrice := entryPrice + (entryPrice * stopLossPercent) / 100
        strategyOpen()
        
    strategyPercentege = (close - updatedEntryPrice) / updatedEntryPrice * 100.00
    rideUpStopLoss = hasOpenTrade() and strategyPercentege > 1

    if (isLong() and rideUpStopLoss)
        stopLossPercent := stopLossPercent + strategyPercentege - 1.0
        newStopLossPrice = updatedEntryPrice + (updatedEntryPrice * stopLossPercent) / 100  
        stopLossPrice := max(stopLossPrice, newStopLossPrice)
        updatedEntryPrice := stopLossPrice

//
// ▒▒▒▒▒▒▒▒▒▒▒▒▒▒▒▒▒▒▒▒▒▒▒▒▒▒▒▒▒▒▒▒▒▒▒▒▒▒▒▒▒▒▒▒▒▒▒▒▒▒▒▒▒▒▒▒▒▒▒▒▒▒▒▒▒▒▒▒▒▒▒▒▒▒▒▒▒▒▒▒▒▒▒▒▒▒▒▒▒▒▒▒▒▒▒▒▒▒▒▒▒▒▒▒▒▒▒▒▒▒▒▒▒▒ //
//
// === LOGIC TO TRAILING STOP IN SHORT POSITION

if (isShort() and backTestPeriod())

    crossedStopLoss = close >= stopLossPrice
    terminateOperation = hasOpenTrade() and (crossedStopLoss or hasCloseShortConditional())

    if (terminateOperation)
        entryPrice := 0.0
        updatedEntryPrice := entryPrice
        stopLossPrice := 0.0
        strategyClose()
    
    startOperation = notHasOpenTrade() and hasEntryShortConditional()

    if(startOperation)
        entryPrice := close
        updatedEntryPrice := entryPrice
        stopLossPrice := entryPrice + (entryPrice * stopLossPercent) / 100
        strategyOpen()
        
    strategyPercentege = (close - updatedEntryPrice) / updatedEntryPrice * 100.00
    rideDownStopLoss = hasOpenTrade() and strategyPercentege < -1

    if (rideDownStopLoss)
        stopLossPercent := stopLossPercent + strategyPercentege + 1.0
        newStopLossPrice = updatedEntryPrice + (updatedEntryPrice * stopLossPercent) / 100  
        stopLossPrice := min(stopLossPrice, newStopLossPrice)
        updatedEntryPrice := stopLossPrice

//
// ▒▒▒▒▒▒▒▒▒▒▒▒▒▒▒▒▒▒▒▒▒▒▒▒▒▒▒▒▒▒▒▒▒▒▒▒▒▒▒▒▒▒▒▒▒▒▒▒▒▒▒▒▒▒▒▒▒▒▒▒▒▒▒▒▒▒▒▒▒▒▒▒▒▒▒▒▒▒▒▒▒▒▒▒▒▒▒▒▒▒▒▒▒▒▒▒▒▒▒▒▒▒▒▒▒▒▒▒▒▒▒▒▒▒ 
//
// === DRAWING SHAPES     

entryPricePlotConditinal = entryPrice == 0.0 ? na : entryPrice
trailingStopLossPlotConditional = stopLossPrice == 0.0  ? na : stopLossPrice

plotshape(entryPricePlotConditinal, title= "Entry Price", color=color.blue, style=shape.circle, location=location.absolute, size=size.tiny)
plotshape(trailingStopLossPlotConditional, title= "Stop Loss", color=color.red, style=shape.circle, location=location.absolute, size=size.tiny)

plot(valueToPlot == 0.0 ? na : valueToPlot, title="BuyLine", linewidth=2, color=colorToPlot)
plotshape(direction == 1 and direction[1] == -1 ? longStop : na, title="Buy", style=shape.labelup, location=location.absolute, size=size.normal, text="Buy", transp=0, textcolor = color.white, color=color.green, transp=0)
plotshape(direction == -1 and direction[1] == 1 ? shortStop : na, title="Sell", style=shape.labeldown, location=location.absolute, size=size.normal, text="Sell", transp=0, textcolor = color.white, color=color.red, transp=0)

alertcondition(direction == 1 and direction[1] == -1 ? longStop : na, title="Buy", message="Buy!")
alertcondition(direction == -1 and direction[1] == 1 ? shortStop : na, title="Sell", message="Sell!")