Strategi Ganda Bollinger+RSI (Hanya Beli) v1.2

1
Follow
1779
Followers
Nama Strategi
Bollinger + RSI strategi ganda multihead
Kedua, gambaran strategi
Strategi ini menggunakan kombinasi indikator Brinline dengan indikator RSI untuk melakukan overposing saat keduanya menunjukkan sinyal oversold dan overposing saat keduanya menunjukkan sinyal overbuy. Dibandingkan dengan indikator tunggal, lebih dapat diandalkan untuk mengkonfirmasi sinyal perdagangan dan menghindari sinyal palsu.
Ketiga, prinsip strategi.
- Menggunakan indikator RSI untuk menilai overbought dan oversold
- RSI di bawah 50 dianggap oversold
- RSI di atas 50 dianggap overbought
- Brinline untuk menilai abnormal harga
- Harga di bawah rel dianggap oversold
- Harga yang lebih tinggi dari harga di atas rel dianggap sebagai overbought.
- Ketika RSI dan Bollinger Bands menunjukkan sinyal oversold, lakukan over-posisi
- RSI di bawah 50
- Jalur harga di bawah rel Brin
- Ketika RSI dan Brinline menunjukkan sinyal overbought, posisi terendah
- RSI di atas 50
- Jalur harga lebih tinggi dari Jalur Brin
Keunggulan Strategis
- Kombinasi dua indikator ini membuat sinyal lebih dapat diandalkan dan menghindari sinyal palsu.
- Hanya membangun posisi multihead, menyederhanakan logika, mengurangi risiko perdagangan
Kelima, Risiko Strategis dan Solusi
- Parameter Brinline tidak disetel dengan benar, batas atas dan bawah terlalu luas, meningkatkan risiko kesalahan transaksi
- Optimalkan parameter garis putar, mengatur siklus garis putar dan standar deviasi secara rasional
- RSI parameter yang tidak tepat, overbought dan oversold penilaian standar yang tidak tepat, meningkatkan risiko perdagangan yang salah
- Mengoptimalkan parameter RSI, menyesuaikan siklus RSI, dan mengatur standar overbought dan oversold secara rasional
- Ravin tidak bekerja dengan baik jika tidak ada tren.
- Bergabung dengan indikator tren untuk menghindari pergerakan goyah
Keenam, optimalisasi strategi
- Pengoptimalan baris Brin dan parameter RSI
- Meningkatkan mekanisme penghentian kerugian
- Tergabung dengan indikator tren seperti MACD
- Menambahkan garis pendek dan garis panjang dalam penilaian.
VII. Kesimpulan
Strategi ini menggabungkan keunggulan dari kedua indikator Brinline dan RSI, perdagangan pada saat keduanya menunjukkan sinyal overbought dan oversold, menghindari sinyal palsu yang dihasilkan oleh satu indikator, sehingga meningkatkan akurasi sinyal. Dibandingkan dengan versi sebelumnya, hanya membangun posisi multihead, mengurangi risiko perdagangan.
Source
Pine
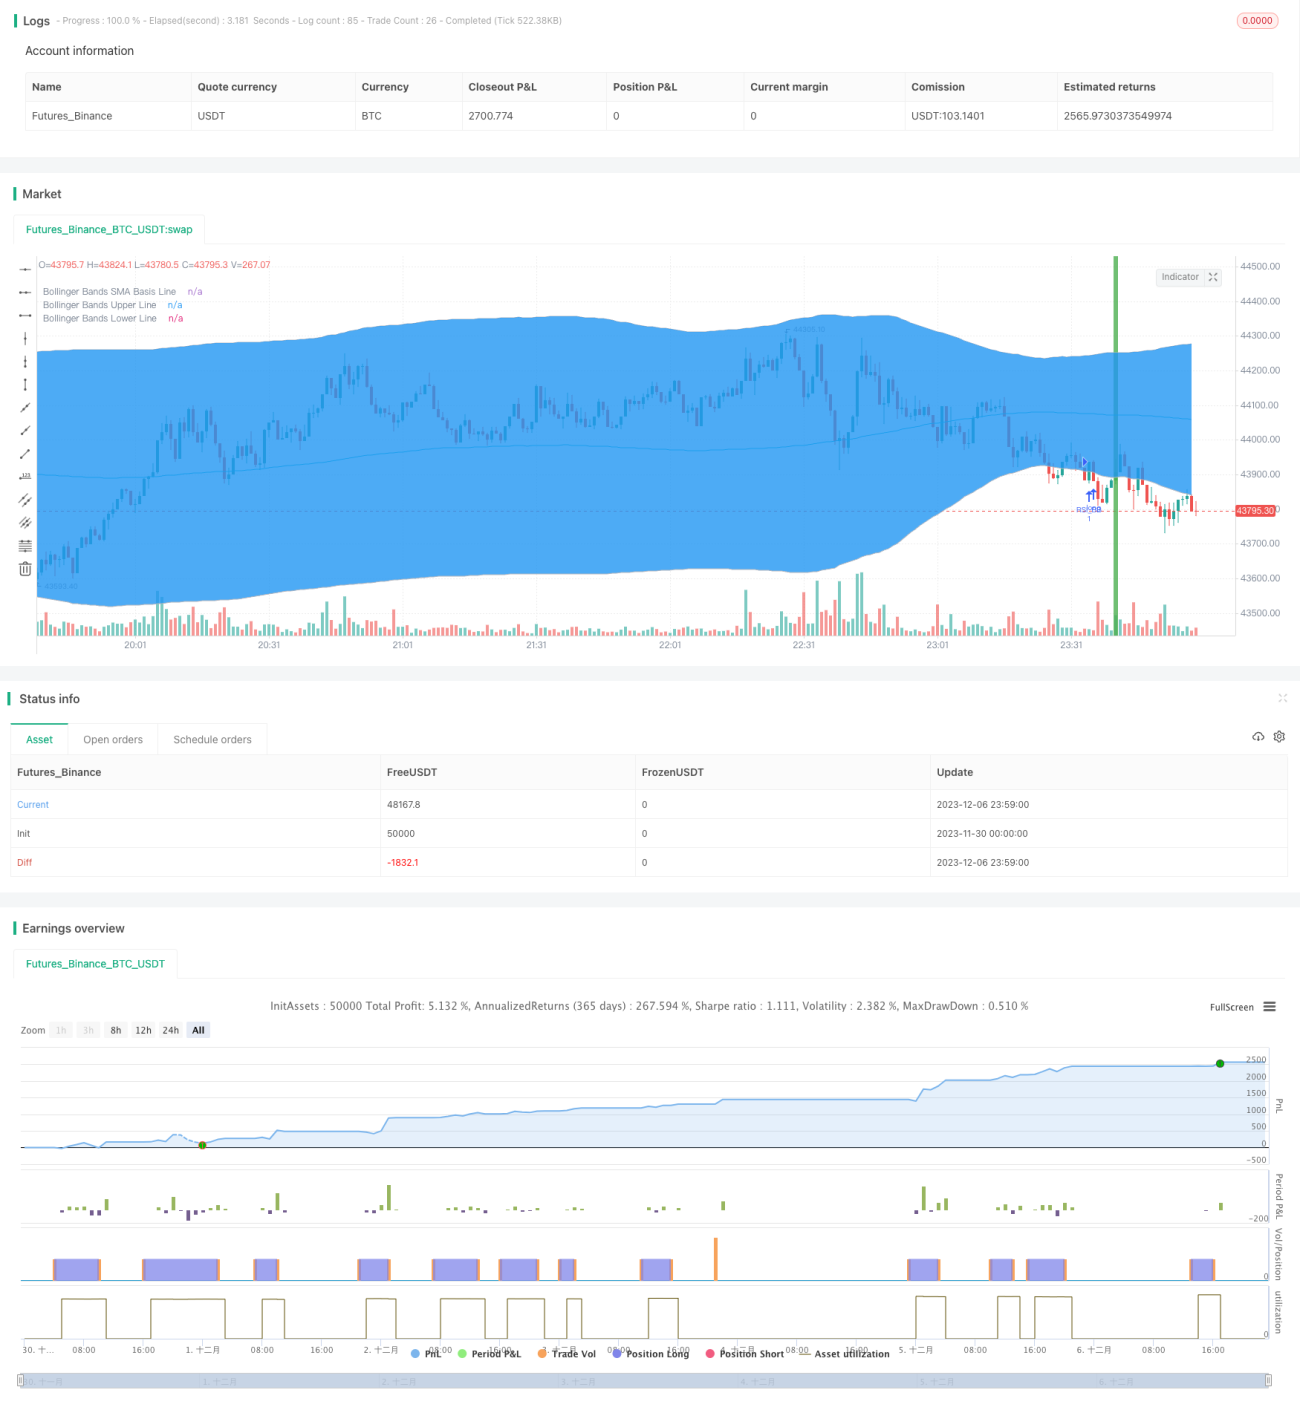
/*backtest
start: 2023-11-30 00:00:00
end: 2023-12-07 00:00:00
period: 1m
basePeriod: 1m
exchanges: [{"eid":"Futures_Binance","currency":"BTC_USDT"}]
*/

//@version=3
strategy("Bollinger + RSI, Double Strategy Long-Only (by ChartArt) v1.2", shorttitle="CA_-_RSI_Bol_Strat_1.2", overlay=true)

// ChartArt's RSI + Bollinger Bands, Double Strategy UPDATE: Long-OnlyStrategy parameters
Related strategies
Comment
All comments (0)
No data
- 1