R-Breaker 取引戦略
作者: リン・ハーン優しさ, 作成日: 2018-08-24 11:36:30, 更新日: 2020-06-03 17:16:34フォレックス取引システムでは,ピボットポイントの取引方法は古典的な取引戦略である.ピボットポイントは非常にシンプルなレジスタンスサポートシステムである.昨日の最高値,最低値,閉値に基づいて,ピボットポイント1点,3つのレジスタンスレベル,3つのサポートレベルを含む7つの価格ポイントが計算される. サポートラインとレジスタンスラインは,技術分析でよく使用されるツールの一つであり,サポートラインとプレッシャーラインの役割は相互に変換できる.取引の観点から,ピボットポイントは戦闘マップのようなもので,投資家が注意を払うべきサポートとレジスタンス価格を指摘する.特定の戦術協力については,ピボットポイントは投資家に依存して特に規定していない. この取引戦略では,投資家は,ピボットポイント,サポートレベル,レジスタンスレベルにおける日中の価格と関連するトレンドに基づいて柔軟に戦略を策定し,キーポイントに基づいてポジション調整さえ管理することができます.
R-Breaker 戦略の図面
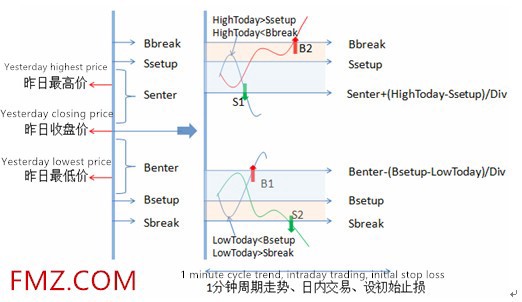 R-Breakerは,今日の日中取引の基準価格として,昨日の価格に基づいて6つの価格ポイントを計算したが,ピボットポイント設定よりも1ピボットポイントだけ低かった.R-Breakerとピボットポイントの違いは,パラメータ設定が6つの価格間の距離をより柔軟にし,R-Breakerが特定の取引戦略を明確にするということである.
日中の価格動きによると,トレンド追跡と逆転戦略が同時に採用される.画像の色の背景を持つエリアは観測エリアとみなすことができる.日中の最高価格がSETUPにヒットして戻り,参照Senterのレジスタンスラインを下回ると,逆転戦略が採用される.
つまり,ショートポジションはS1で開かれます.もしポジション保有がない場合,日中の価格がBbreakのレジスタンスラインを突破した場合,トレンド追跡戦略が採用されます.つまり,ショートポジションはB2で開かれます.同様に,B1ポイントは逆転し,S2ポイントはオープンショートポジションです.
R-Breakerは,今日の日中取引の基準価格として,昨日の価格に基づいて6つの価格ポイントを計算したが,ピボットポイント設定よりも1ピボットポイントだけ低かった.R-Breakerとピボットポイントの違いは,パラメータ設定が6つの価格間の距離をより柔軟にし,R-Breakerが特定の取引戦略を明確にするということである.
日中の価格動きによると,トレンド追跡と逆転戦略が同時に採用される.画像の色の背景を持つエリアは観測エリアとみなすことができる.日中の最高価格がSETUPにヒットして戻り,参照Senterのレジスタンスラインを下回ると,逆転戦略が採用される.
つまり,ショートポジションはS1で開かれます.もしポジション保有がない場合,日中の価格がBbreakのレジスタンスラインを突破した場合,トレンド追跡戦略が採用されます.つまり,ショートポジションはB2で開かれます.同様に,B1ポイントは逆転し,S2ポイントはオープンショートポジションです.
ポジションを開設するトリガー条件は複数の価格ポジションを含み,日中の価格変動に敏感であるため,この戦略は1分間の取引に適用されます.また,この戦略によって引き起こす取引数は,クロスサイクルの条件に関係なく,多くありません.
NPeriod=2 //period
f1=0.47   //Middle rail upper and lower top section coefficient
f2=0.07   //Mid-rail upper and lower interval coefficient
f3=0.25   //Upper and lower rail coefficients

//==========================================
//API: A simple example of the Chart function (drawing function)
var chart = { // This chart is an object in the JS language. Before using the Chart function, we need to declare an object variable chart that configures the chart.
  __isStock: true,                                    // Whether the markup is a general chart, if you are interested, you can change it to false and run it.
  tooltip: {xDateFormat: '%Y-%m-%d %H:%M:%S, %A'},    // Zoom tool
  title : { text : 'Market analysis chart'},          // title
  rangeSelector: {                                    // Selection range
      buttons:  [{type: 'hour',count: 1, text: '1h'}, {type: 'hour',count: 3, text: '3h'}, {type: 'hour', count: 8, text: '8h'}, {type: 'all',text: 'All'}],
      selected: 0,
      inputEnabled: false
  },
  xAxis: { type: 'datetime'},                         // The horizontal axis of the coordinate axis is: x axis. The currently set type is: time.
  yAxis : {                                           // The vertical axis of the coordinate axis is the y-axis. The default value is adjusted according to the data size.
      title:{text: 'Market calculus'},                // title
      opposite:false,                                 // Whether to enable the right vertical axis
  },
  series : [                                          // Data series, this property holds the various data series (line, K-line diagram, label, etc..)
      {name:"0X",id:"0",color:'#FF83FA',data:[]},
      {name:"1X",id:"1",color:'#FF3E96',dashStyle:'shortdash',data:[]},
      {name:"2X",id:"2",color:'#FF0000',data:[]},

      {name:"3X",id:"3",color:'#7D26CD',dashStyle:'shortdash',data:[]},

      {name:"4X",id:"4",color:'#2B2B2B',data:[]},
      {name:"5X",id:"5",color:'#707070',dashStyle:'shortdash',data:[]},
      {name:"6X",id:"6",color:'#778899',data:[]},

      {name:"7X",id:"7",color:'#0000CD',data:[]},

      //RGB color comparison table  http://www.114la.com/other/rgb.htm
  ]
};

/*
//Pivot Points strategy
chart["series"][0]["name"]="resistance3:";
chart["series"][1]["name"]="resistance2:";
chart["series"][2]["name"]="resistance1:";

chart["series"][3]["name"]="Pivot point:";

chart["series"][4]["name"]="Support position1:";
chart["series"][5]["name"]="Support position2:";
chart["series"][6]["name"]="Support position3:";
chart["series"][6]["name"]="Current price:";
*/
///*
//R-Breaker strategy
chart["series"][0]["name"]="Bbreak_A1:";
chart["series"][1]["name"]="Ssetup_A2:";
chart["series"][2]["name"]="Senter_A3:";

chart["series"][4]["name"]="Benter_B1:";
chart["series"][5]["name"]="Sbreak_B2:";
chart["series"][6]["name"]="Bsetup_B3:";
chart["series"][7]["name"]="Current price:";
//*/


var ObjChart = Chart(chart);  // Call the Chart function to initialize the chart.
ObjChart.reset();           // clear
function onTick(e){
        var records = _C(e.GetRecords);  //Return a K-line history data
        var ticker = _C(e.GetTicker);    //Return a Ticker structure
        var account = _C(e.GetAccount);  //Return the main exchange account information

        var High = TA.Highest(records, NPeriod, 'High'); //Highest price
        var Close = TA.Lowest(records, NPeriod, 'Close');       //Closing price
        var Low = TA.Lowest(records, NPeriod, 'Low');   //Lowest price

        /*
        //Pivot Points strategy
        //A up 7235 A middle 7259 A down 7275 B up 7195 B middle 7155 B down 7179
        Pivot = (High+Close+Low)/3 //Pivot point

        var Senter=High+2*(Pivot-Low)  //resistance3
        var Ssetup=Pivot+(High-Low)  //resistance2
        var Bbreak=2*Pivot-Low  //resistance1

        var Benter=2*Pivot-High  //Support position1
        var Sbreak=Pivot-(High-Low)  //Support position2
        var Bsetup=Low-2*(High-Pivot)  //Support position3
        //Draw line
        var nowTime = new Date().getTime(); //Get the timestamp,
        ObjChart.add([0, [nowTime,_N(Senter,3)]]); //resistance3
        ObjChart.add([1, [nowTime,_N(Ssetup,3)]]); //resistance2
        ObjChart.add([2, [nowTime,_N(Bbreak,3)]]); //resistance1

        ObjChart.add([3, [nowTime,_N(Pivot,3)]]); //Pivot point

        ObjChart.add([4, [nowTime,_N(Benter,3)]]);  //support point1
        ObjChart.add([5, [nowTime,_N(Sbreak,3)]]);  //support point2
        ObjChart.add([6, [nowTime,_N(Bsetup,3)]]);  //support point3

        ObjChart.add([7, [nowTime,_N(ticker.Last,3)]]); //Last transaction price

        ObjChart.update(chart);  // Update the chart to display it.
        */


        ///*
        //R-Breaker strategy
        //A up 7261.46 A middle 7246.76 A down 7228.68 B up 7204.48 B middle 7187.96 B down 7173.26
        var Ssetup = High + f1 * (Close - Low);  //A middle
        var Bsetup = Low - f1 * (High - Close);  //B down

        var Bbreak = Ssetup + f3 * (Ssetup - Bsetup);  //A up
        var Senter = ((1 + f2) / 2) * (High + Close) - f2 * Low;  //A down

        var Benter = ((1 + f2) / 2) * (Low + Close) - f2 * High;  //B up
        var Sbreak = Bsetup - f3 * (Ssetup - Bsetup);  //B middle
        //Draw line
        var nowTime = new Date().getTime(); //Get timestamp
        ObjChart.add([0, [nowTime,_N(Bbreak,3)]]); //A up
        ObjChart.add([1, [nowTime,_N(Ssetup,3)]]); //A middle
        ObjChart.add([2, [nowTime,_N(Senter,3)]]); //A down

        //ObjChart.add([3, [nowTime,_N(Pivot,3)]]); //Pivot point

        ObjChart.add([4, [nowTime,_N(Benter,3)]]);  //B up
        ObjChart.add([5, [nowTime,_N(Sbreak,3)]]);  //B middle
        ObjChart.add([6, [nowTime,_N(Bsetup,3)]]);  //B down

        ObjChart.add([7, [nowTime,_N(ticker.Last,3)]]); //Last transaction price

        ObjChart.update(chart);  // Update the chart to display it.
        //*/

        Log('A up',_N(Bbreak,3),'A middle',_N(Ssetup,3),'A down',_N(Senter,3),'B up',_N(Benter,3),'B middle',_N(Bsetup,3),'B down',_N(Sbreak,3));
}


function main() {
    Log("Strategy Startup");
    while(true){
        onTick(exchanges[0]);
        Sleep(1000);
    }
}
- 新しいバージョンのダイナミックバランス
- ブロックチェーンの定量投資シリーズコース (3)
カレンダー・スプレッド・アービトラージ - コモディティ・フューチャーズのTick受領制限を突破する方法
- マルチプラットフォーム・ヘージング・スタビライゼーション・アービトラージ V2.1 (注釈版)
- エラー:Error: (Decrypt): Abort at __decrypt (__FILE__:2) at Register (__FILE__:2) at __reg__ (__FILE__:16) at global (__FILE__:27) preventsyield このエラーが起きたのは,
- いくつかの基本的な体系的な取引スキルについての電子書籍の純英語バージョン
- Futures_OP 4: Get https://www.bitmex.comuser/affiliateStatus: lookup www.bitmex.comuser: no such host エラー:
- プログラム型取引戦略の10つの典型的なモデルアイデア
- 模擬1分間のティッカーデータを復元
- OKex現貨は口座情報を入手し,テストディスクは問題なく,実盤ではエラーが報告されています.
- ネットワーク取引戦略
- Python は多種多様性のMACDトレンド戦略フレームワークを簡素化しました
- 拡張APIに復習インターフェースがないので,復習をしたい場合はどうしますか?
- 注文の誤報をチェックする.
- BITMEXのXBTUSD回線はどうする? コード回線オプションでは見ていません.
- 株式市場が安値を下げていると,なぜかわからない.
- 支持速度修正を要請する BUG
- グローバル変数は0で,
- 流動管理戦略について
- メインで TypeError: IO() は最大 3 つの引数 (5 が与えられている) を取る