新人,チェックアウト 暗号通貨量的な取引に連れて行きます (5)
作者: リン・ハーンニナバダス, 作成日: 2022-04-18 17:20:53, 更新日: 2022-04-18 17:30:27新人,チェックアウト 暗号通貨量的な取引に連れて行きます (5)
簡単なグリッド戦略の取引論理分析を説明しました. この記事では,この学習戦略の設計を完了していきます.
-
取引論理分析 前回の記事で述べたように,グリッドの各グリッドラインを横切って,現在の価格がグリッドラインを上下に横切ると判断する限り,トレードアクションが起動できます. しかし,実際には,まだ多くの論理の詳細があり,戦略書き方を理解していない初心者は,論理が非常に単純で,コードは数行しかならず,実際の書き方でまだ多くの詳細が見つかったと誤解する傾向があります.
この infinite grid の設計を考える必要があります. 前回の記事で,関数を設計したのを覚えてください.
createNetこの関数は,有限数のグリッドラインを持つグリッドデータ構造を生成します. 戦略を実行しているときに,価格がこのグリッドデータ構造の境界を超えるとどうなるでしょうか (価格が最も高い上方グリッドラインを超えて,価格が最も低い下方グリッドラインを超えて)? まず 格子データ構造に拡張メカニズムを追加する必要があります戦略の実行が始まるコードです 実行が始まるコードです 実行が始まるコードです
var diff = 50                                 // global variable, the grid interval, can be designed as parameter; for an easy explanation, we write it in an infinite loop
function main() {
    // After the bot starts running, execute the strategy code from here
    var ticker = _C(exchange.GetTicker)       // obtain the latest ticker data in the market; for the ticker data structure, you can refer to FMZ API documentation: https://www.fmz.com/api#ticker
    var net = createNet(ticker.Last, diff)    // the function to initially construct the grid data structure we designed in the previous article; here we construct a grid data structure net

    while (true) {                            // then, the program logic enters the while infinite loop, and the strategy will repeatedly execute the code within the {} symbol from here
        ticker = _C(exchange.GetTicker)       // the first line of the infinite loop code gets the latest market quote data, and updates it to the variable ticker
        // check the grid range
        while (ticker.Last >= net[net.length - 1].price) {
            net.push({
                buy : false,
                sell : false,
                price : net[net.length - 1].price + diff,
            })
        }
        while (ticker.Last <= net[0].price) {
            var price = net[0].price - diff
            if (price <= 0) {
                break
            }
            net.unshift({
                buy : false,
                sell : false,
                price : price,
            })
        }

        // the code is not completed...
    }
}
格子データ構造を拡張可能にするコード (上記コードから抜粋):
      // check the grid range
      while (ticker.Last >= net[net.length - 1].price) {   // if the price exceeds the grid line with the highest price in the grid,
          net.push({                                       // add a new grid line after the grid line with the highest price in the grid
              buy : false,                                 // initialize the sell mark
              sell : false,                                // initialize the buy mark
              price : net[net.length - 1].price + diff,    // add a grid interval on the basis of the previous highest price
          })
      }
      while (ticker.Last <= net[0].price) {                // if the price is lower than the grid line with the lowest price in the grid,
          var price = net[0].price - diff                  // distinguished from adding upwards, you should notice the price of the newly added grid line downwards cannot be less than or equal to 0, so you need to judge here
          if (price <= 0) {                                // do not add when the price is less than or equal to 0, and break the loop
              break
          }
          net.unshift({                                    // add a new grid line before the grid line with the lowest price in the grid
              buy : false,
              sell : false,
              price : price,
          })
      }
次に,取引のトリガーを 導入する方法を考えなければなりません.
var diff = 50
var amount = 0.002       // add a global variable, which can also be designed as a parameter; for easy explanation, we can write it in an infinite loop
                         // the parameter controls the trading amount on the grid line each time the trading is triggered
function main() {
    var ticker = _C(exchange.GetTicker)
    var net = createNet(ticker.Last, diff)
    var preTicker = ticker       // before the start of the main (infinite) loop, set a variable, to record the market quotes of last time
    while (true) {
        ticker = _C(exchange.GetTicker)
        // check the grid range
        while (ticker.Last >= net[net.length - 1].price) {
            net.push({
                buy : false,
                sell : false,
                price : net[net.length - 1].price + diff,
            })
        }
        while (ticker.Last <= net[0].price) {
            var price = net[0].price - diff
            if (price <= 0) {
                break
            }
            net.unshift({
                buy : false,
                sell : false,
                price : price,
            })
        }

        // index the grid
        for (var i = 0 ; i < net.length ; i++) {     // traverse all grid lines in the grid data structure
            var p = net[i]
            if (preTicker.Last < p.price && ticker.Last > p.price) {         // upcross, and sell; when the current node has been traded, no matter SELL or BUY, no more trade
                if (i != 0) {
                    var downP = net[i - 1]
                    if (downP.buy) {
                        exchange.Sell(-1, amount, ticker)
                        downP.buy = false
                        p.sell = false
                        continue
                    }
                }
                if (!p.sell && !p.buy) {
                    exchange.Sell(-1, amount, ticker)
                    p.sell = true
                }
            } else if (preTicker.Last > p.price && ticker.Last < p.price) {  // downcross, and buy
                if (i != net.length - 1) {
                    var upP = net[i + 1]
                    if (upP.sell) {
                        exchange.Buy(-1, amount * ticker.Last, ticker)
                        upP.sell = false
                        p.buy = false
                        continue
                    }
                }
                if (!p.buy && !p.sell) {
                    exchange.Buy(-1, amount * ticker.Last, ticker)
                    p.buy = true
                }
            }
        }
        preTicker = ticker    // record the current market quotes in preTicker, which will be used as the "last" market quote data to compare with the new one in next loop, to judge upcross and downcross
        Sleep(500)
    }
}
この例では
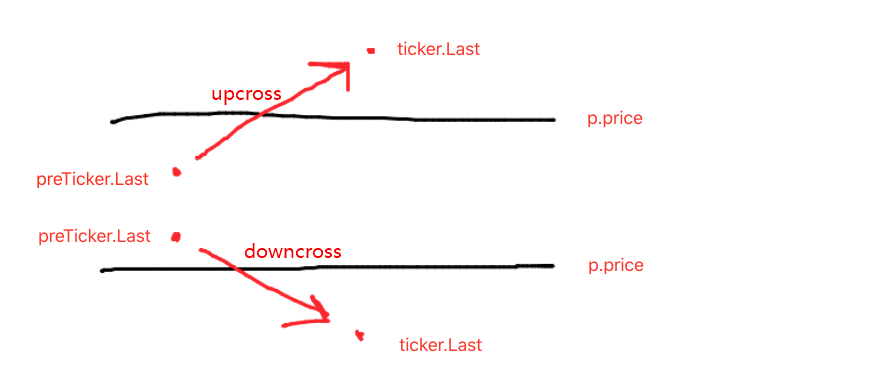
- ネットワーク線を横断する条件:
preTicker.Last < p.price && ticker.Last > p.price - ネットワーク線下を横断する条件:
preTicker.Last > p.price && ticker.Last < p.price
これは前回の記事で紹介したものです
上下を判断するのは,注文と取引を決定する最初のステップに過ぎず,グリッドラインデータにおけるマークも判断する必要があります.
価格が現在のグリッドラインよりも低いか判断し,最新のグリッドラインの購入マークよりも低いか判断します. 購入マークの値が真である場合は,最後のグリッドラインが実行された購入を意味し,最後のグリッドラインの購入マークを偽としてリセットし,現在のグリッドラインの販売マークを偽としてリセットします.
既存のグリッドラインの買取マークと販売マークの両方が偽である場合,それは現在のグリッドラインが取引できることを意味します.それは上方なので,ここで我々は販売操作を実行し,実行後にグリッドラインの販売マークを真実としてマークします.
ダウンクロスを処理する論理は同じです (初心者は自分で考えてください)
- ネットワーク線を横断する条件:
戦略のバックテストを完了
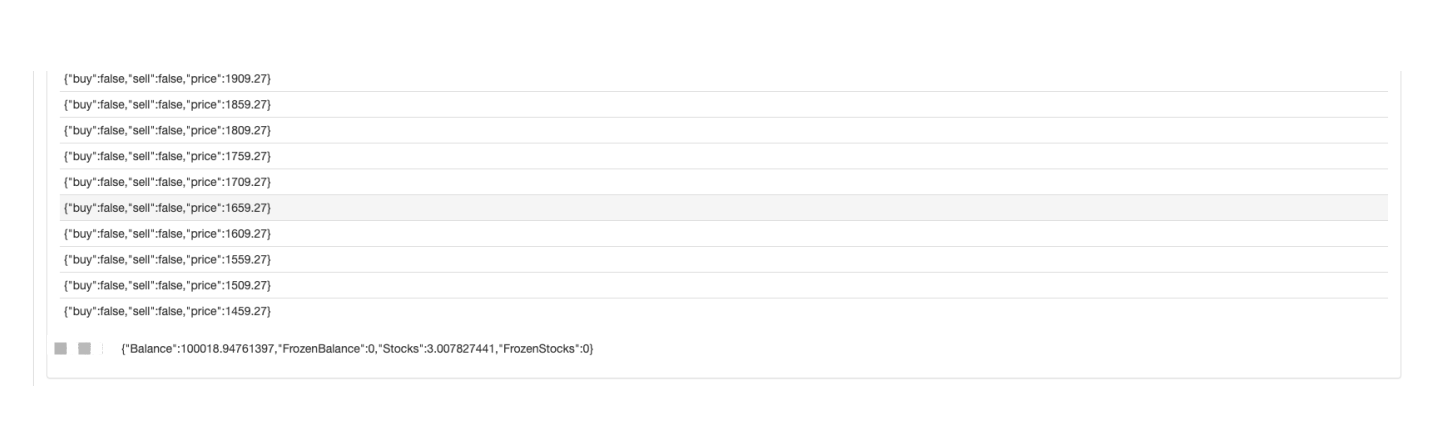
バックテスト中にいくつかのデータを見るために,関数showTblデータを表示するために書かれています
function showTbl(arr) {
    var tbl = {
        type : "table",
        title : "grid",
        cols : ["grid information"],
        rows : []
    }
    var arrReverse = arr.slice(0).reverse()
    _.each(arrReverse, function(ele) {
        var color = ""
        if (ele.buy) {
            color = "#FF0000"
        } else if (ele.sell) {
            color = "#00FF00"
        }
        tbl.rows.push([JSON.stringify(ele) + color])
    })
    LogStatus(_D(), "\n`" + JSON.stringify(tbl) + "`", "\n account information:", exchange.GetAccount())
}
完全な戦略コード:
/*backtest
start: 2021-04-01 22:00:00
end: 2021-05-22 00:00:00
period: 1d
basePeriod: 1m
exchanges: [{"eid":"OKEX","currency":"ETH_USDT","balance":100000}]
*/

var diff = 50
var amount = 0.002
function createNet(begin, diff) {
    var oneSideNums = 10
    var up = []
    var down = []
    for (var i = 0 ; i < oneSideNums ; i++) {
        var upObj = {
            buy : false,
            sell : false,
            price : begin + diff / 2 + i * diff,
        }
        up.push(upObj)

        var j = (oneSideNums - 1) - i
        var downObj = {
            buy : false,
            sell : false,
            price : begin - diff / 2 - j * diff,
        }
        if (downObj.price <= 0) {  // the price cannot be less than or equal to 0
            continue
        }
        down.push(downObj)
    }

    return down.concat(up)
}

function showTbl(arr) {
    var tbl = {
        type : "table",
        title : "grid",
        cols : ["grid information"],
        rows : []
    }
    var arrReverse = arr.slice(0).reverse()
    _.each(arrReverse, function(ele) {
        var color = ""
        if (ele.buy) {
            color = "#FF0000"
        } else if (ele.sell) {
            color = "#00FF00"
        }
        tbl.rows.push([JSON.stringify(ele) + color])
    })
    LogStatus(_D(), "\n`" + JSON.stringify(tbl) + "`", "\n account information:", exchange.GetAccount())
}

function main() {
    var ticker = _C(exchange.GetTicker)
    var net = createNet(ticker.Last, diff)
    var preTicker = ticker
    while (true) {
        ticker = _C(exchange.GetTicker)
        // check the grid range
        while (ticker.Last >= net[net.length - 1].price) {
            net.push({
                buy : false,
                sell : false,
                price : net[net.length - 1].price + diff,
            })
        }
        while (ticker.Last <= net[0].price) {
            var price = net[0].price - diff
            if (price <= 0) {
                break
            }
            net.unshift({
                buy : false,
                sell : false,
                price : price,
            })
        }

        // index grid
        for (var i = 0 ; i < net.length ; i++) {
            var p = net[i]
            if (preTicker.Last < p.price && ticker.Last > p.price) {         // upcross, and sell; when the current node has been traded, no matter SELL or BUY, no more trade
                if (i != 0) {
                    var downP = net[i - 1]
                    if (downP.buy) {
                        exchange.Sell(-1, amount, ticker)
                        downP.buy = false
                        p.sell = false
                        continue
                    }
                }
                if (!p.sell && !p.buy) {
                    exchange.Sell(-1, amount, ticker)
                    p.sell = true
                }
            } else if (preTicker.Last > p.price && ticker.Last < p.price) {  // downcross, and buy
                if (i != net.length - 1) {
                    var upP = net[i + 1]
                    if (upP.sell) {
                        exchange.Buy(-1, amount * ticker.Last, ticker)
                        upP.sell = false
                        p.buy = false
                        continue
                    }
                }
                if (!p.buy && !p.sell) {
                    exchange.Buy(-1, amount * ticker.Last, ticker)
                    p.buy = true
                }
            }
        }

        showTbl(net)
        preTicker = ticker
        Sleep(500)
    }
}
戦略バックテスト:
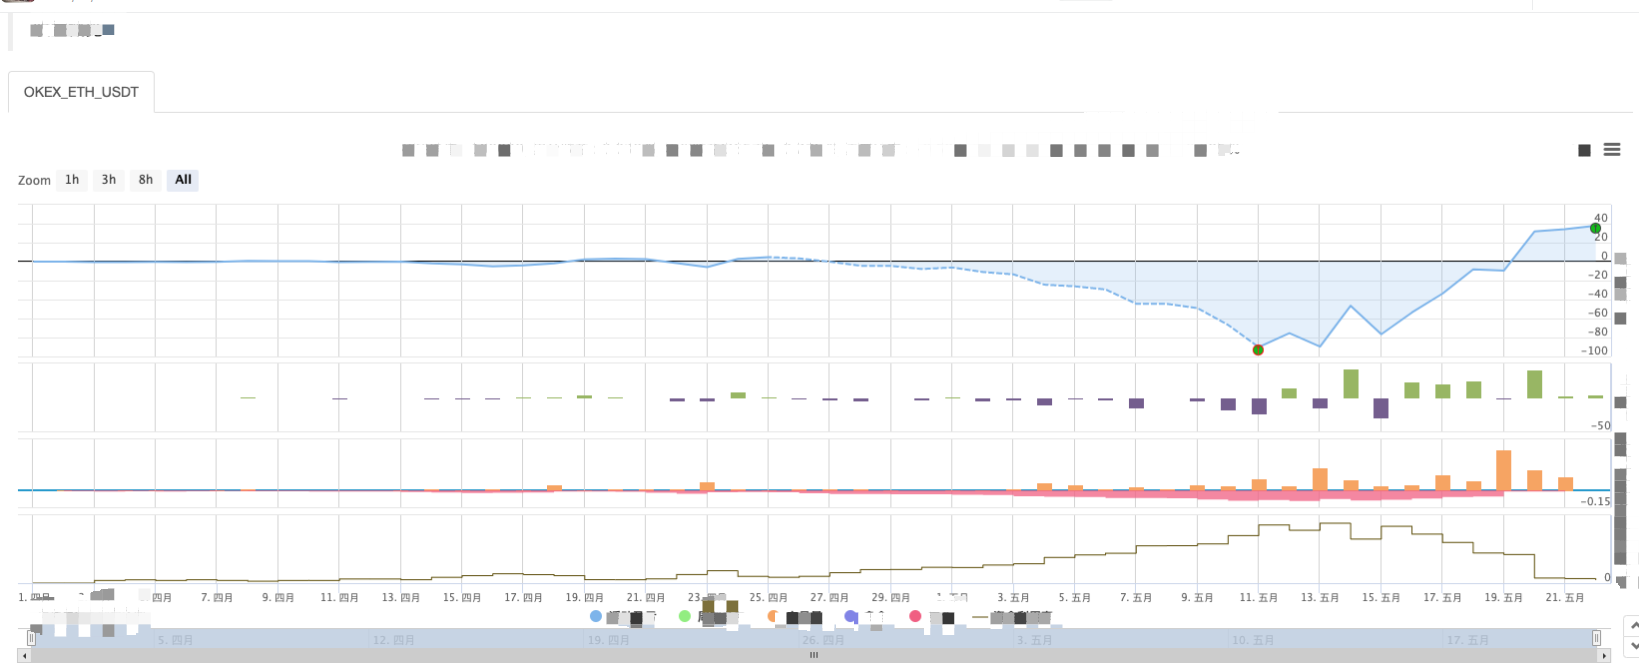
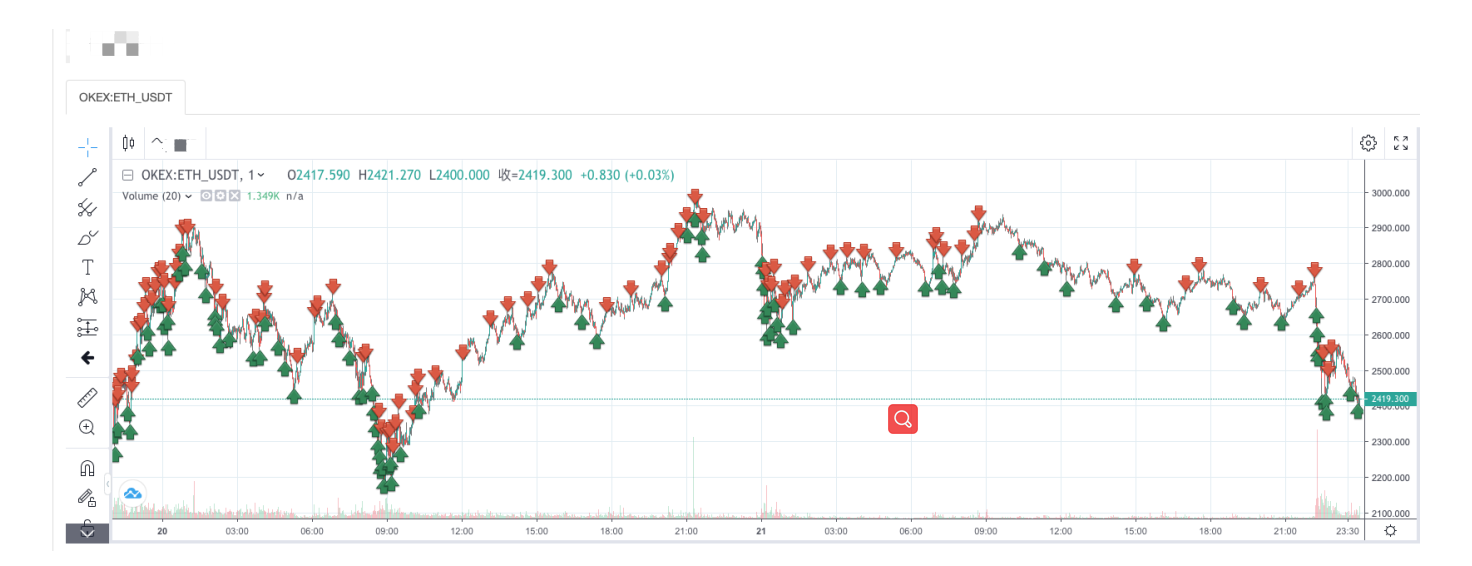
格子戦略の特徴は 市場が動いているとき 大きな浮動損失があり 変動する市場では 利益が反発します したがって,グリッド戦略はリスクのないものではありません.スポット戦略は依然として平衡を維持することができますが,フューチャー契約のグリッド戦略はよりリスクがあり,グリッドパラメータを保守的に設定する必要があります.
- My言語では,この文字を入力して信号を出力します.
- 負債の負債の負債の負債の負債の負債の負債の負債の負債の負債
- SQLite を使って FMZ 量子データベースを構成する
- 新人,チェックアウト
暗号通貨量的な取引に連れて行きます (8) - 新人,チェックアウト
暗号通貨量的な取引にあなたを連れて行く (7) - 新人,チェックアウト
仮想通貨量的な取引に連れて行きます (6) - 新人,チェックアウト
暗号通貨量的な取引にあなたを連れて行く (3) - 新人,チェックアウト
仮想通貨量的な取引にあなたを連れて行く (2) - 私の発明家のタイミングが間違っています
- 代名詞の策略についてアイデアを教えてください!
- 新人,チェックアウト
暗号通貨量的な取引にあなたを連れて行く (4) - オーダー作成時間とオーダー完了時間
- マルチンの即日ネット戦略
- 私の言語を理解しているお兄さんたち,このコードの意味を教えてください.
- リアルディスクのエラー報告の質問
- 新人,チェックアウト
仮想通貨量的な取引に連れて行きます (1) - タイプスクリプトのサポートは追加できますか?
- クリプト通貨のスポットヘッジ戦略 (2)
- クリプト通貨のスポットヘッジ戦略 (1)
- Bitget APIでは,順序の取引がADA,AVAX,AXS,BCH,DOT,EOS,ETC,FIL,LINK,LTC,LUNA,MATIC,SOL,XRPを平衡するときに問題が発生する.