MACD指標に基づく双方向取引戦略

1
Follow
1779
Followers
概要
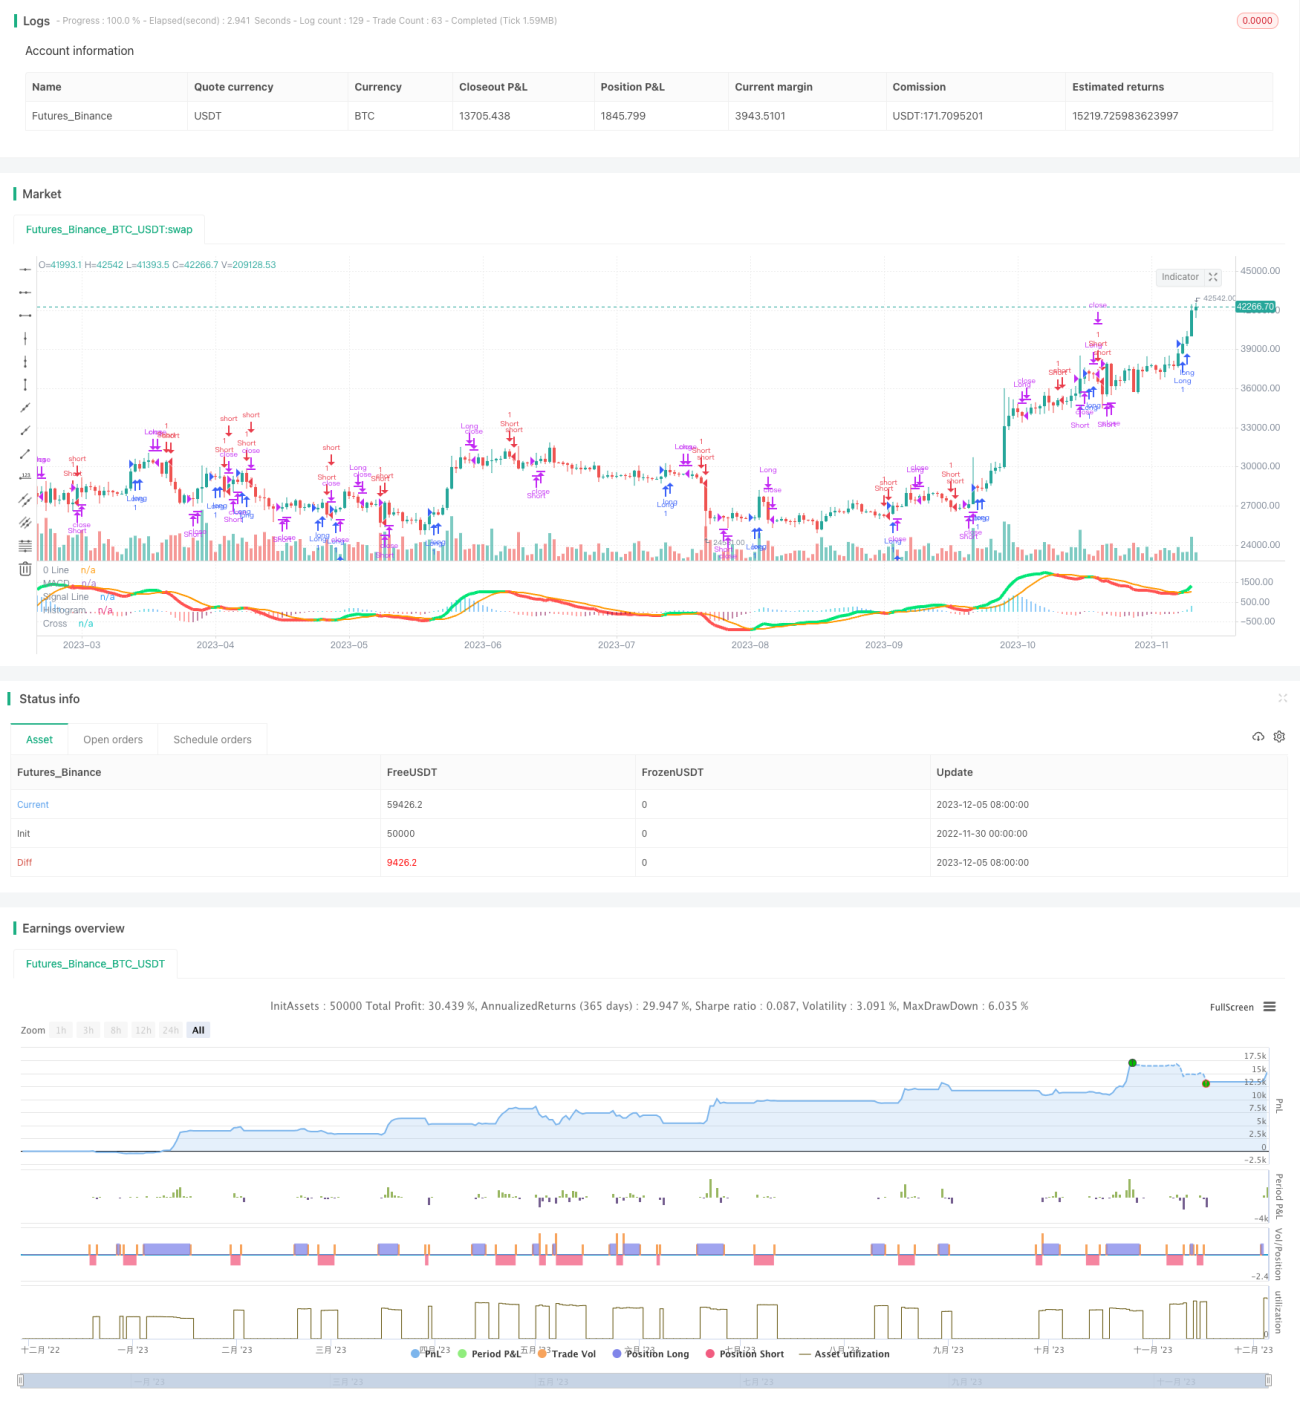
この戦略は,MACD指数に基づく二方向取引戦略を実現する.これは,MACD指数上での金叉と死叉の時に分別的に高値と空値を打つことができ,他の指標判断と組み合わせていくつかの信号をフィルターすることができます.
戦略原則
この戦略は,主にMACD指標を利用して双方向取引を行う.具体的には,高速移動平均,遅い移動平均およびMACD信号ラインを計算する.高速移動平均の上を通過すると,金叉信号が多く発生し,高速移動平均の下を通過すると,死叉信号が空になる.
部分的に無効な信号をフィルタリングするために,この戦略は±30の範囲をフィルターとして設定し,MACD柱状線がこの範囲を超えた場合にのみ取引信号をトリガーする.さらに,平仓時にMACD柱状線の方向を判断し,連続した2本の柱の方向が変化したときにのみ平仓する.
戦略的優位性
- MACD指標を主要取引シグナルとして使用し,この指標は両方向の株式市場の動きに比較的敏感である
- フィルターが追加され,無効信号の一部をフィルターします.
- 連続した2本の柱の方向を判断する平仓論理を採用し,偽突破を一定程度に回避できる.
戦略リスク
- MACD指標は,頻繁に取引するシグナルを生じやすく,過剰な取引頻度をもたらす可能性があります.
- シングル指標戦略で,信号の遅延は損失につながる可能性があります.
- 柱状線方向判断の平仓論理は厳格ではないため,信号漏れのリスクがある.
戦略最適化の方向性
- KDJ指標,ブリン帯指標など,他の指標と組み合わせて信号を確認することを考慮することができる.
- KD指数などのMACD指数に代わる他のより高度な指標を研究することができます.
- 単一損失を制御するために,平仓ロジックを最適化し,ストップとストップを設定できます.
要約する
この戦略は,全体として基本的には利用可能な二方向取引戦略である.それはMACD指標の優位性を利用し,同時に,信号の質を制御するためのフィルターを追加している.しかし,MACD指標自体にもいくつかの問題があり,その戦略をより信頼性のあるものにするために,現場でさらなるテストと最適化が必要である.全体的に,この戦略は,二方向取引戦略の基礎を築き,その基礎を継続的に最適化し,強力な量化取引戦略にすることができる.
]
Source
Pine
/*backtest
start: 2022-11-30 00:00:00
end: 2023-12-06 00:00:00
period: 1d
basePeriod: 1h
exchanges: [{"eid":"Futures_Binance","currency":"BTC_USDT"}]
*/

//@version=3

//Created by user ChrisMoody updated 4-10-2014
//Regular MACD Indicator with Histogram that plots 4 Colors Based on Direction Above and Below the Zero LineStrategy parameters
Related strategies
Comment
All comments (0)
No data
- 1