
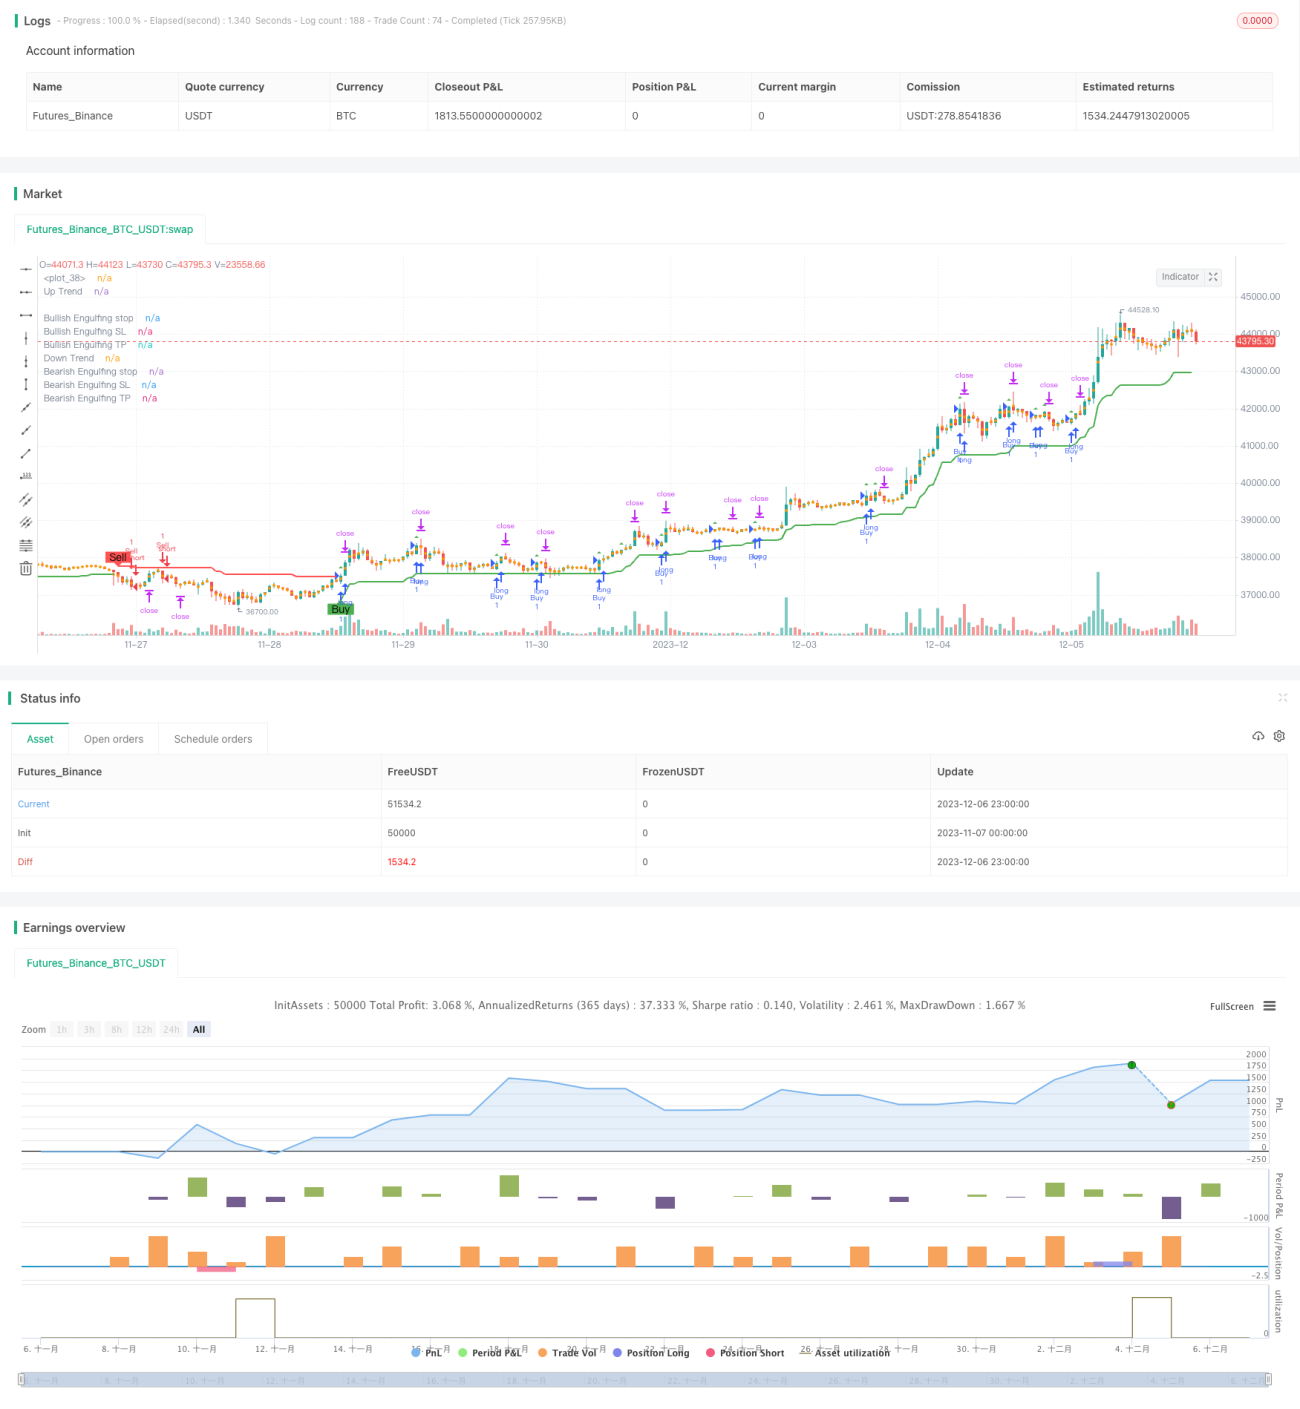
超トレンドのエサボウ戦略は,平均真波幅 (ATR),超トレンドの指標とエサボウ形状を組み合わせてトレンドの方向を識別し,エサボウ形状の確認とともに優遇率の入場機会を探すトレンド追跡戦略である.
この戦略は,まずATRと超トレンド指標を使ってCURRENT市場のトレンド方向を判断する.具体的には,価格が上線より低ければ下線として定義され,価格が下線より高ければ上線として定義される.
トレンドの方向を確認すると同時に,戦略は,K線が吞食形態を形成しているかどうかを判断する.コードの論理によれば,上昇傾向では,前K線の閉じる価格が現在のK線の開く価格より高く,現在のK線の閉じる価格が開く価格より低い場合が多頭吞食を誘発する.下降傾向では,前K線の閉じる価格が現在のK線の開く価格より低く,現在のK線の閉じる価格も開く価格より高い場合が空頭吞食を誘発する.
吞食形状がトレンド方向と一致すると,取引シグナルが生成されます. さらに,戦略は,吞食形状に基づいてストップ価格とストップ価格を計算します. 入場後,価格がストップまたはストップ価格に触れた場合,現在のポジションから退出します.
この戦略は,トレンド追跡と形状識別の優位性を組み合わせて,トレンドの動きの中で反転シグナルを認識することができ,市場転換点で大きな動きを捕捉することができる.また,ストップ・ロスのメカニズムは,損失のリスクを効果的に制御することができます.
この戦略の最大のリスクは,吞食形が偽破裂し,誤った信号を生む可能性があることにある.また,止損と止止の設定があまりにも恣意的であり,利益と損失のバランスを達成することができないこともある.パラメータの組み合わせを最適化し,止損の位置を適切に調整することが推奨されている.
ATRのパラメータをリアルタイムで最適化することで,市場の変動率の変化をよりよく捉える事が考えられます. さらに,他の指標のトレンドを特定し,戦略の安定性をさらに向上させることも考えられます. ストップ・ストップの観点から考えると,動態追跡も実行可能な最適化思考です.
超トレンドサッピング戦略は,トレンド追跡と形状認識の優位性を統合し,市場転換点において反転信号としてサッピング形状を戦略することで,高い効果を得ることができる.しかし,この戦略には,一定の偽信号リスクがあり,リスクを制御するためにさらなるテストと最適化が必要である.
/*backtest
start: 2023-11-07 00:00:00
end: 2023-12-07 00:00:00
period: 1h
basePeriod: 15m
exchanges: [{"eid":"Futures_Binance","currency":"BTC_USDT"}]
*/
// This source code is subject to the terms of the Mozilla Public License 2.0 at https://mozilla.org/MPL/2.0/
// © Armanhammer
//@version=5
strategy("Engulfing with Trend", overlay=true)
Periods = input.int(title="ATR Period", defval=10)
src = input(hl2, title="Source")
Multiplier = input.float(title="ATR Multiplier", step=0.1, defval=3.0)
changeATR= input.bool(title="Change ATR Calculation Method ?", defval=true)
showsignals = input.bool(title="Show Buy/Sell Signals ?", defval=true)
highlighting = input.bool(title="Highlighter On/Off ?", defval=true)
atr2 = ta.sma(src, Periods)
atr= changeATR ? ta.atr(Periods) : atr2
up=src-(Multiplier*atr)
up1 = nz(up[1],up)
up := close[1] > up1 ? math.max(up,up1) : up
dn=src+(Multiplier*atr)
dn1 = nz(dn[1], dn)
dn := close[1] < dn1 ? math.min(dn, dn1) : dn
var trend = 1
trend := nz(trend[1], trend)
trend := trend == -1 and close > dn1 ? 1 : trend == 1 and close < up1 ? -1 : trend
upPlot = plot(trend == 1 ? up : na, title="Up Trend", style=plot.style_linebr, linewidth=2, color=color.green)
buySignal = trend == 1 and trend[1] == -1
plotshape(buySignal and showsignals ? up : na, title="Buy", style=shape.labelup, location=location.absolute, color=color.new(color.green, 0), text="Buy")
//plotshape(buySignal ? up : na, title="UpTrend Begins", location=location.absolute, style=shape.circle, size=size.tiny, color=color.green, transp=0)
//plotshape(buySignal and showsignals ? up : na, title="Buy", text="Buy", location=location.absolute, style=shape.labelup, size=size.tiny, color=color.green, textcolor=color.white, transp=0)
dnPlot = plot(trend == 1 ? na : dn, title="Down Trend", style=plot.style_linebr, linewidth=2, color=color.red)
sellSignal = trend == -1 and trend[1] == 1
plotshape(sellSignal and showsignals ? dn : na, title="Sell", style=shape.labeldown, location=location.absolute, color=color.new(color.red, 0), text="Sell")
//plotshape(sellSignal ? dn : na, title="DownTrend Begins", location=location.absolute, style=shape.circle, size=size.tiny, color=color.red, transp=0)
//plotshape(sellSignal and showsignals ? dn : na, title="Sell", text="Sell", location=location.absolute, style=shape.labeldown, size=size.tiny, color=color.red, textcolor=color.white, transp=0)
mPlot = plot(ohlc4, title="", style=plot.style_circles, linewidth=0)
longFillColor = highlighting and trend == 1 ? color.new(color.green, 0) : na
shortFillColor = highlighting and trend == -1 ? color.new(color.red, 0) : na
fill(upPlot, dnPlot, color=longFillColor)
fill(dnPlot, upPlot, color=shortFillColor)
alertcondition(buySignal, title="SuperTrend Buy", message="SuperTrend Buy!")
alertcondition(sellSignal, title="SuperTrend Sell", message="SuperTrend Sell!")
changeCond = trend != trend[1]
alertcondition(changeCond, title="SuperTrend Direction Change", message="SuperTrend has changed direction!")
// Define Downtrend and Uptrend conditions
downtrend = trend == -1
uptrend = trend == 1
// Engulfing
boringThreshold = input.float(25, title="Boring Candle Threshold (%)", minval=1, maxval=100)
engulfingThreshold = input.float(50, title="Engulfing Candle Threshold (%)", minval=1, maxval=100)
stopLevel = input.int(200, title="Stop Level (Pips)", minval=1)
// Boring Candle (Inside Bar) and Engulfing Candlestick Conditions
isBoringCandle = math.abs(open[1] - close[1]) * 100 / math.abs(high[1] - low[1]) <= boringThreshold
isEngulfingCandle = math.abs(open - close) * 100 / math.abs(high - low) <= engulfingThreshold
// Bullish and Bearish Engulfing Conditions
bullEngulfing = uptrend and close[1] < open[1] and close > open[1] and not isBoringCandle and not isEngulfingCandle
bearEngulfing = downtrend and close[1] > open[1] and close < open[1] and not isBoringCandle and not isEngulfingCandle
// Stop Loss, Take Profit, and Entry Price Calculation
bullStop = close + (stopLevel * syminfo.mintick)
bearStop = close - (stopLevel * syminfo.mintick)
bullSL = low
bearSL = high
bullTP = bullStop + (bullStop - low)
bearTP = bearStop - (high - bearStop)
// Entry Conditions
enterLong = bullEngulfing and uptrend
enterShort = bearEngulfing and downtrend
// Exit Conditions
exitLong = ta.crossover(close, bullTP) or ta.crossover(close, bullSL)
exitShort = ta.crossover(close, bearTP) or ta.crossover(close, bearSL)
// Check if exit conditions are met by the next candle
exitLongNextCandle = exitLong and (ta.crossover(close[1], bullTP[1]) or ta.crossover(close[1], bullSL[1]))
exitShortNextCandle = exitShort and (ta.crossover(close[1], bearTP[1]) or ta.crossover(close[1], bearSL[1]))
// Strategy Execution
if enterLong
strategy.entry("Buy", strategy.long)
if enterShort
strategy.entry("Sell", strategy.short)
// Exit Conditions for Long (Buy) Positions
if bullEngulfing and not na(bullTP) and not na(bullSL)
strategy.exit("Exit Long", from_entry="Buy", stop=bullSL, limit=bullTP)
// Exit Conditions for Short (Sell) Positions
if bearEngulfing and not na(bearTP) and not na(bearSL)
strategy.exit("Exit Short", from_entry="Sell", stop=bearSL, limit=bearTP)
// Plot Shapes and Labels
plotshape(series=bullEngulfing, style=shape.triangleup, location=location.abovebar, color=color.green)
plotshape(series=bearEngulfing, style=shape.triangledown, location=location.abovebar, color=color.red)
// Determine OP, SL, and TP
plot(series=bullEngulfing ? bullStop : na, title="Bullish Engulfing stop", color=color.red, linewidth=3, style=plot.style_linebr)
plot(series=bearEngulfing ? bearStop : na, title="Bearish Engulfing stop", color=color.red, linewidth=3, style=plot.style_linebr)
plot(series=bullEngulfing ? bullSL : na, title="Bullish Engulfing SL", color=color.red, linewidth=3, style=plot.style_linebr)
plot(series=bearEngulfing ? bearSL : na, title="Bearish Engulfing SL", color=color.red, linewidth=3, style=plot.style_linebr)
plot(series=bullEngulfing ? bullTP : na, title="Bullish Engulfing TP", color=color.green, linewidth=3, style=plot.style_linebr)
plot(series=bearEngulfing ? bearTP : na, title="Bearish Engulfing TP", color=color.green, linewidth=3, style=plot.style_linebr)
// Create labels if the condition for bullEngulfing or bearEngulfing is met
//if bullEngulfing
// label.new(x=bar_index, y=bullSL, text="SL: " + str.tostring(bullSL), color=color.red, textcolor=color.white, style=label.style_labelup, size=size.tiny)
//if bearEngulfing
// label.new(x=bar_index, y=bearSL, text="SL: " + str.tostring(bearSL), color=color.red, textcolor=color.white, style=label.style_labeldown, size=size.tiny)
//if bullEngulfing
// label.new(x=bar_index, y=bullTP, text="TP: " + str.tostring(bullTP), color=color.green, textcolor=color.white, style=label.style_labeldown, size=size.tiny)
//if bearEngulfing
// label.new(x=bar_index, y=bearTP, text="TP: " + str.tostring(bearTP), color=color.green, textcolor=color.white, style=label.style_labelup, size=size.tiny)