フュージョン移動平均マルチクロスオーバー取引戦略

1
Follow
1779
Followers
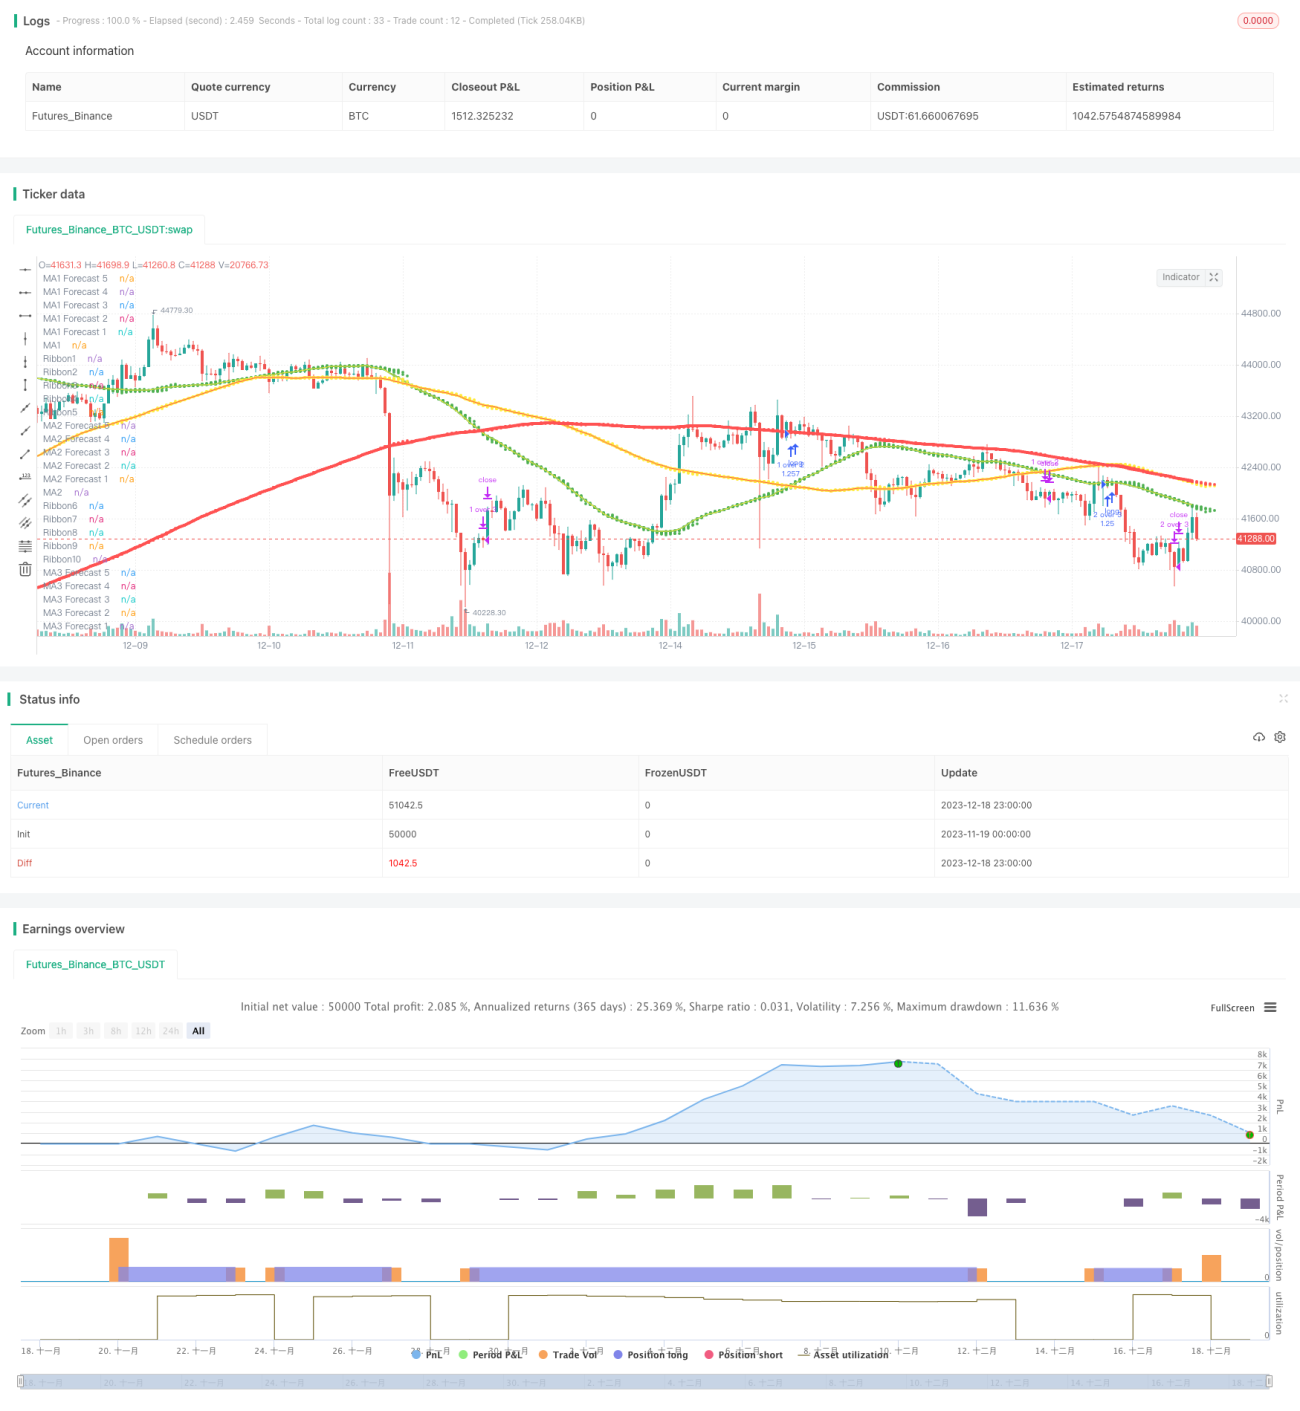
概要
この戦略は,3つの移動平均 (MA1,MA2,MA3) の交差に基づく取引戦略である. 3つの移動平均のタイプ,周期,価格データソースおよび解像度,およびそれらの間の交差が取引されるかどうかを設定することにより,柔軟な取引戦略の組み合わせが得られる.
原則
この戦略は,主に3つの移動平均線の間に発生する交差および複写信号を取引信号として利用する.より短い周期の移動平均線がより長い周期の移動平均線を上下から横切るときは,長期ポジション開設シグナルを生成し,より短い周期の移動平均線がより長い周期の移動平均線を上下から横切るときは,平仓シグナルを生成する.
ユーザーは,3つの移動平均のタイプ (SMA,EMAなど),周期,価格データソース (閉盤価格,最高価格など),K線解像度 (分線,日線など) を自由に選択できます. また,各移動平均の間の交差を起動するかどうかを選択して,特定の交差に対して取引行動を起こすかどうかを決定することもできます.
この戦略は,現在,市場価格のみでポジションを開設し,ポジションを和平にするだけです. 取引ごとに投資資金は,口座総権益の100%となります.
利点
- 移動平均の種類,周期などのパラメータを自由に選択して最適化および組み合わせることができ,曲線適合のリスクを軽減します.
- 複数の移動平均の交差は,取引の機会を増やし,取引の頻度を高めます.
- 長期,中期,短期の移動平均を使って,トレンドと逆転のバランスをとることができます.
- 複数のK線解像度に対応し,複数の時間枠解析が可能
- 自動予測機能で,パラメータマッチングの効果をテストできます.
リスク
- 大量のパラメータの組み合わせは,過度に最適化につながる可能性があります.
- 取引の頻度が高いため,取引手数料とスライドポイントコストが増加する可能性があります.
- 市場価格のチケットは,入場を制限できません.
- 複数の移動平均値が衝突する可能性がある
- 回測とリールディスクのパフォーマンスに差がある可能性がある
改善の提案
- ウォークス・フォワード解析で有効なパラメータ範囲を得ます.
- 取引手数料とスライドポイントのコストを回測に追加する
- 市場価格の代わりに 制限価格の切符を試す
- フィルタリング条件を増やして 衝突信号を回避する
- リアル環境を模擬したフィードバックで検証策略
要約する
この戦略は,移動平均の滑らかな性質と交差信号のパターン認識能力を総合的に利用しています. ユーザーは,トレンドフォローと逆転認識の間のバランスを取るために,パラメータを柔軟に選択できます. 同時に,過剰な最適化リスクを制御することに注意する必要があります.
Source
Pine
Strategy parameters
Related strategies
Comment
All comments (0)
No data
- 1