R-Breaker 거래 전략
저자:선함, 2018-08-24 11:36:30, 업데이트: 2020-06-03 17:16:34외환 거래 시스템에서 피보트 포인트 거래 방법은 고전적인 거래 전략입니다. 피보트 포인트는 매우 간단한 저항 지원 시스템입니다. 어제의 최고, 최저 및 폐쇄 가격에 기초하여 하나의 피보트 포인트, 3 개의 저항 수준 및 3 개의 지원 수준을 포함하여 7 개의 가격 포인트가 계산됩니다. 저항선과 지지선은 기술분석에서 자주 사용되는 도구 중 하나이며, 지지선과 압력선의 역할은 상호 변형될 수 있다. 거래 관점에서, 피보트 포인트는 투자자가 주의해야 할 지지와 저항 가격을 지적하는 전투 지도와 같다. 구체적인 전술 협력을 በተመለከተ, 피보트 포인트는 투자자 자체에 따라 구체적으로 규정하지 않는다. 이 거래 전략에서 투자자는 플렉서블하게 중추점, 지원 수준 및 저항 수준에서 Intraday 가격과 관련 트렌드를 기반으로 전략을 수립 할 수 있으며 주요 포인트에 기반한 위치 조정도 관리 할 수 있습니다.
R-Breaker 전략의 스케마
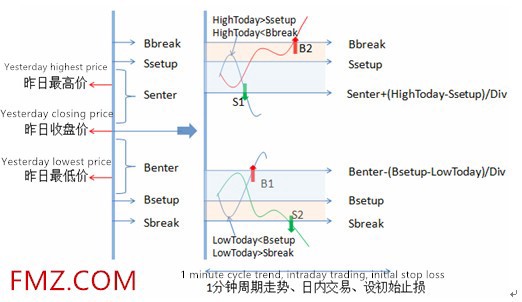 R-Breaker는 어제의 가격에 기초하여 오늘 내일 거래의 기준 가격으로 6개의 가격 포인트를 계산했지만, Pivot Point 설정보다 1개의 피보트 포인트만 적습니다. R-Breaker와 Pivot Points의 차이점은 매개 변수 설정이 6개의 가격 사이의 거리를 더 유연하게 만들고, R-Breaker는 특정 거래 전략을 명확하게한다는 것입니다.
내일 가격 움직임에 따라 트렌드 추적 및 역전 전략이 동시에 채택됩니다. 그림의 색상 배경이있는 영역은 관측 영역으로 간주 될 수 있습니다. 하루 최고 가격이 세트업에 도달하고 다시 떨어지고 참조 센터의 저항 라인 아래에 떨어지면 역전 전략이 채택됩니다.
즉, 짧은 지점은 S1 지점에서 열립니다. 지점 보유가 없다면, 내일 가격이 Bbreak의 저항선을 깨면 트렌드 추적 전략을 채택합니다. 즉, 긴 지점은 B2에서 열립니다. 마찬가지로, B1 지점은 반전되고 S2 지점은 열린 짧은 지점입니다.
R-Breaker는 어제의 가격에 기초하여 오늘 내일 거래의 기준 가격으로 6개의 가격 포인트를 계산했지만, Pivot Point 설정보다 1개의 피보트 포인트만 적습니다. R-Breaker와 Pivot Points의 차이점은 매개 변수 설정이 6개의 가격 사이의 거리를 더 유연하게 만들고, R-Breaker는 특정 거래 전략을 명확하게한다는 것입니다.
내일 가격 움직임에 따라 트렌드 추적 및 역전 전략이 동시에 채택됩니다. 그림의 색상 배경이있는 영역은 관측 영역으로 간주 될 수 있습니다. 하루 최고 가격이 세트업에 도달하고 다시 떨어지고 참조 센터의 저항 라인 아래에 떨어지면 역전 전략이 채택됩니다.
즉, 짧은 지점은 S1 지점에서 열립니다. 지점 보유가 없다면, 내일 가격이 Bbreak의 저항선을 깨면 트렌드 추적 전략을 채택합니다. 즉, 긴 지점은 B2에서 열립니다. 마찬가지로, B1 지점은 반전되고 S2 지점은 열린 짧은 지점입니다.
포지션 개설의 트리거 조건은 여러 가격 포지션을 포함하고 내일 가격 움직임에 민감하기 때문에, 이 전략은 1분 기간에 거래에 적용됩니다. 또한, 이 전략에 의해 트리거되는 거래 수는 크로스 사이클의 조건과 관계없이 많지 않습니다.
NPeriod=2 //period
f1=0.47   //Middle rail upper and lower top section coefficient
f2=0.07   //Mid-rail upper and lower interval coefficient
f3=0.25   //Upper and lower rail coefficients

//==========================================
//API: A simple example of the Chart function (drawing function)
var chart = { // This chart is an object in the JS language. Before using the Chart function, we need to declare an object variable chart that configures the chart.
  __isStock: true,                                    // Whether the markup is a general chart, if you are interested, you can change it to false and run it.
  tooltip: {xDateFormat: '%Y-%m-%d %H:%M:%S, %A'},    // Zoom tool
  title : { text : 'Market analysis chart'},          // title
  rangeSelector: {                                    // Selection range
      buttons:  [{type: 'hour',count: 1, text: '1h'}, {type: 'hour',count: 3, text: '3h'}, {type: 'hour', count: 8, text: '8h'}, {type: 'all',text: 'All'}],
      selected: 0,
      inputEnabled: false
  },
  xAxis: { type: 'datetime'},                         // The horizontal axis of the coordinate axis is: x axis. The currently set type is: time.
  yAxis : {                                           // The vertical axis of the coordinate axis is the y-axis. The default value is adjusted according to the data size.
      title:{text: 'Market calculus'},                // title
      opposite:false,                                 // Whether to enable the right vertical axis
  },
  series : [                                          // Data series, this property holds the various data series (line, K-line diagram, label, etc..)
      {name:"0X",id:"0",color:'#FF83FA',data:[]},
      {name:"1X",id:"1",color:'#FF3E96',dashStyle:'shortdash',data:[]},
      {name:"2X",id:"2",color:'#FF0000',data:[]},

      {name:"3X",id:"3",color:'#7D26CD',dashStyle:'shortdash',data:[]},

      {name:"4X",id:"4",color:'#2B2B2B',data:[]},
      {name:"5X",id:"5",color:'#707070',dashStyle:'shortdash',data:[]},
      {name:"6X",id:"6",color:'#778899',data:[]},

      {name:"7X",id:"7",color:'#0000CD',data:[]},

      //RGB color comparison table  http://www.114la.com/other/rgb.htm
  ]
};

/*
//Pivot Points strategy
chart["series"][0]["name"]="resistance3:";
chart["series"][1]["name"]="resistance2:";
chart["series"][2]["name"]="resistance1:";

chart["series"][3]["name"]="Pivot point:";

chart["series"][4]["name"]="Support position1:";
chart["series"][5]["name"]="Support position2:";
chart["series"][6]["name"]="Support position3:";
chart["series"][6]["name"]="Current price:";
*/
///*
//R-Breaker strategy
chart["series"][0]["name"]="Bbreak_A1:";
chart["series"][1]["name"]="Ssetup_A2:";
chart["series"][2]["name"]="Senter_A3:";

chart["series"][4]["name"]="Benter_B1:";
chart["series"][5]["name"]="Sbreak_B2:";
chart["series"][6]["name"]="Bsetup_B3:";
chart["series"][7]["name"]="Current price:";
//*/


var ObjChart = Chart(chart);  // Call the Chart function to initialize the chart.
ObjChart.reset();           // clear
function onTick(e){
        var records = _C(e.GetRecords);  //Return a K-line history data
        var ticker = _C(e.GetTicker);    //Return a Ticker structure
        var account = _C(e.GetAccount);  //Return the main exchange account information

        var High = TA.Highest(records, NPeriod, 'High'); //Highest price
        var Close = TA.Lowest(records, NPeriod, 'Close');       //Closing price
        var Low = TA.Lowest(records, NPeriod, 'Low');   //Lowest price

        /*
        //Pivot Points strategy
        //A up 7235 A middle 7259 A down 7275 B up 7195 B middle 7155 B down 7179
        Pivot = (High+Close+Low)/3 //Pivot point

        var Senter=High+2*(Pivot-Low)  //resistance3
        var Ssetup=Pivot+(High-Low)  //resistance2
        var Bbreak=2*Pivot-Low  //resistance1

        var Benter=2*Pivot-High  //Support position1
        var Sbreak=Pivot-(High-Low)  //Support position2
        var Bsetup=Low-2*(High-Pivot)  //Support position3
        //Draw line
        var nowTime = new Date().getTime(); //Get the timestamp,
        ObjChart.add([0, [nowTime,_N(Senter,3)]]); //resistance3
        ObjChart.add([1, [nowTime,_N(Ssetup,3)]]); //resistance2
        ObjChart.add([2, [nowTime,_N(Bbreak,3)]]); //resistance1

        ObjChart.add([3, [nowTime,_N(Pivot,3)]]); //Pivot point

        ObjChart.add([4, [nowTime,_N(Benter,3)]]);  //support point1
        ObjChart.add([5, [nowTime,_N(Sbreak,3)]]);  //support point2
        ObjChart.add([6, [nowTime,_N(Bsetup,3)]]);  //support point3

        ObjChart.add([7, [nowTime,_N(ticker.Last,3)]]); //Last transaction price

        ObjChart.update(chart);  // Update the chart to display it.
        */


        ///*
        //R-Breaker strategy
        //A up 7261.46 A middle 7246.76 A down 7228.68 B up 7204.48 B middle 7187.96 B down 7173.26
        var Ssetup = High + f1 * (Close - Low);  //A middle
        var Bsetup = Low - f1 * (High - Close);  //B down

        var Bbreak = Ssetup + f3 * (Ssetup - Bsetup);  //A up
        var Senter = ((1 + f2) / 2) * (High + Close) - f2 * Low;  //A down

        var Benter = ((1 + f2) / 2) * (Low + Close) - f2 * High;  //B up
        var Sbreak = Bsetup - f3 * (Ssetup - Bsetup);  //B middle
        //Draw line
        var nowTime = new Date().getTime(); //Get timestamp
        ObjChart.add([0, [nowTime,_N(Bbreak,3)]]); //A up
        ObjChart.add([1, [nowTime,_N(Ssetup,3)]]); //A middle
        ObjChart.add([2, [nowTime,_N(Senter,3)]]); //A down

        //ObjChart.add([3, [nowTime,_N(Pivot,3)]]); //Pivot point

        ObjChart.add([4, [nowTime,_N(Benter,3)]]);  //B up
        ObjChart.add([5, [nowTime,_N(Sbreak,3)]]);  //B middle
        ObjChart.add([6, [nowTime,_N(Bsetup,3)]]);  //B down

        ObjChart.add([7, [nowTime,_N(ticker.Last,3)]]); //Last transaction price

        ObjChart.update(chart);  // Update the chart to display it.
        //*/

        Log('A up',_N(Bbreak,3),'A middle',_N(Ssetup,3),'A down',_N(Senter,3),'B up',_N(Benter,3),'B middle',_N(Bsetup,3),'B down',_N(Sbreak,3));
}


function main() {
    Log("Strategy Startup");
    while(true){
        onTick(exchanges[0]);
        Sleep(1000);
    }
}
- 동적 균형의 새로운 버전
- 블록체인 양적 투자 시리즈 과정 (3)
캘린더 스프레드 중재 - 어떻게 상품 선물의 틱 수신 한도를 돌파하는 방법
- 멀티 플랫폼 헤지 안정화 중재 V2.1 (주석판)
- 오류:Error: (Decrypt): Abort at __decrypt (__FILE__:2) at Register (__FILE__:2) at __reg__ (__FILE__:16) at global (__FILE__:27) preventsyield [역주: 이 암호를 삭제하는 데 필요한 오류]
- 일부 기본적인 체계적인 거래 기술에 대한 e-책의 순수 영어 버전
- 오류 Futures_OP 4: Get https://www.bitmex.comuser/affiliateStatus: lookup www.bitmex.comuser: no such host
- 프로그램적 거래 전략의 10가지 고전적인 모델 아이디어
- 1분 틱어 데이터를 다시 테스트합니다.
- OKex 현금으로 계좌 정보를 얻었고, 테스트 디스크는 문제가 없었지만 실제 디스크에서는 오류가 발생했습니다.
- 네트워크 거래 전략
- 파이썬의 간소화된 다종류 MACD 트렌딩 전략 프레임워크
- 이 확장 API에는 리테스트 인터페이스가 없습니다. 만약 리테스트를 하고 싶다면 어떻게 해야 할까요?
- 오더에 대한 문의는 오류를 보고합니다.
- BITMEX의 XBTUSD 재검토는 어떻게 해야 할까요?
- 왜인지 모르겠지만, 이 지표에 실수가 있었습니다.
币安市价单BUG ~~~~ 지원 속도의 수정을 요청합니다. - 어떻게 전 세계 변수가 0이 될 수 있을까요?
- 유동성 관리 전략
- 주요에서 TypeError: IO() 는 최대 3개의 인수를 (5개 주어)