초보자, 확인해 보세요 암호화폐 양적 거래에 안내 (5)
저자:니나바다스, 창작: 2022-04-18 17:20:53, 업데이트: 2022-04-18 17:30:27초보자, 확인해 보세요 암호화폐 양적 거래에 안내 (5)
지난 기사에서 우리는 간단한 그리드 전략의 거래 논리 분석을 설명했습니다. 이 기사에서는이 교육 전략의 디자인을 계속 완료 할 것입니다.
-
거래 논리 분석 우리가 지난 기사에서 언급했듯이, 당신이 그리드의 각 그리드 라인을 가로질러 현재 가격이 그리드 라인을 위로 또는 아래로 가로질러 판단하는 한, 거래 액션은 유발 될 수 있습니다. 그러나 실제로는 여전히 많은 논리 세부 사항이 있습니다.
우리가 고려해야 할 첫 번째 세부 사항은 무한 격자 설계입니다. 지난 기사에서 함수를 설계했음을 기억하세요.
createNet초기 그리드 데이터 구조를 함께 생성하기 위해서요? 이 함수는 유한 수의 그리드 라인을 가진 그리드 데이터 구조를 생성합니다. 그렇다면 전략이 실행될 때 가격이 이 그리드 데이터 구조의 경계를 넘어서면 어떨까요? (가격이 가장 높은 상위 그리드 라인과 가장 낮은 하위 그리드 라인) 그래서 우리는 먼저 네트워크 데이터 구조에 확장 메커니즘을 추가해야 합니다.전략의 주요 함수를 작성하기 시작하세요. 주요 함수는 전략이 실행되기 시작하는 코드입니다.
var diff = 50                                 // global variable, the grid interval, can be designed as parameter; for an easy explanation, we write it in an infinite loop
function main() {
    // After the bot starts running, execute the strategy code from here
    var ticker = _C(exchange.GetTicker)       // obtain the latest ticker data in the market; for the ticker data structure, you can refer to FMZ API documentation: https://www.fmz.com/api#ticker
    var net = createNet(ticker.Last, diff)    // the function to initially construct the grid data structure we designed in the previous article; here we construct a grid data structure net

    while (true) {                            // then, the program logic enters the while infinite loop, and the strategy will repeatedly execute the code within the {} symbol from here
        ticker = _C(exchange.GetTicker)       // the first line of the infinite loop code gets the latest market quote data, and updates it to the variable ticker
        // check the grid range
        while (ticker.Last >= net[net.length - 1].price) {
            net.push({
                buy : false,
                sell : false,
                price : net[net.length - 1].price + diff,
            })
        }
        while (ticker.Last <= net[0].price) {
            var price = net[0].price - diff
            if (price <= 0) {
                break
            }
            net.unshift({
                buy : false,
                sell : false,
                price : price,
            })
        }

        // the code is not completed...
    }
}
그것은 그리드 데이터 구조를 확장할 수 있도록 하는 코드입니다 (위 코드에서 추출):
      // check the grid range
      while (ticker.Last >= net[net.length - 1].price) {   // if the price exceeds the grid line with the highest price in the grid,
          net.push({                                       // add a new grid line after the grid line with the highest price in the grid
              buy : false,                                 // initialize the sell mark
              sell : false,                                // initialize the buy mark
              price : net[net.length - 1].price + diff,    // add a grid interval on the basis of the previous highest price
          })
      }
      while (ticker.Last <= net[0].price) {                // if the price is lower than the grid line with the lowest price in the grid,
          var price = net[0].price - diff                  // distinguished from adding upwards, you should notice the price of the newly added grid line downwards cannot be less than or equal to 0, so you need to judge here
          if (price <= 0) {                                // do not add when the price is less than or equal to 0, and break the loop
              break
          }
          net.unshift({                                    // add a new grid line before the grid line with the lowest price in the grid
              buy : false,
              sell : false,
              price : price,
          })
      }
다음으로, 우리는 거래 트리거를 어떻게 구현할지 고려해야 합니다.
var diff = 50
var amount = 0.002       // add a global variable, which can also be designed as a parameter; for easy explanation, we can write it in an infinite loop
                         // the parameter controls the trading amount on the grid line each time the trading is triggered
function main() {
    var ticker = _C(exchange.GetTicker)
    var net = createNet(ticker.Last, diff)
    var preTicker = ticker       // before the start of the main (infinite) loop, set a variable, to record the market quotes of last time
    while (true) {
        ticker = _C(exchange.GetTicker)
        // check the grid range
        while (ticker.Last >= net[net.length - 1].price) {
            net.push({
                buy : false,
                sell : false,
                price : net[net.length - 1].price + diff,
            })
        }
        while (ticker.Last <= net[0].price) {
            var price = net[0].price - diff
            if (price <= 0) {
                break
            }
            net.unshift({
                buy : false,
                sell : false,
                price : price,
            })
        }

        // index the grid
        for (var i = 0 ; i < net.length ; i++) {     // traverse all grid lines in the grid data structure
            var p = net[i]
            if (preTicker.Last < p.price && ticker.Last > p.price) {         // upcross, and sell; when the current node has been traded, no matter SELL or BUY, no more trade
                if (i != 0) {
                    var downP = net[i - 1]
                    if (downP.buy) {
                        exchange.Sell(-1, amount, ticker)
                        downP.buy = false
                        p.sell = false
                        continue
                    }
                }
                if (!p.sell && !p.buy) {
                    exchange.Sell(-1, amount, ticker)
                    p.sell = true
                }
            } else if (preTicker.Last > p.price && ticker.Last < p.price) {  // downcross, and buy
                if (i != net.length - 1) {
                    var upP = net[i + 1]
                    if (upP.sell) {
                        exchange.Buy(-1, amount * ticker.Last, ticker)
                        upP.sell = false
                        p.buy = false
                        continue
                    }
                }
                if (!p.buy && !p.sell) {
                    exchange.Buy(-1, amount * ticker.Last, ticker)
                    p.buy = true
                }
            }
        }
        preTicker = ticker    // record the current market quotes in preTicker, which will be used as the "last" market quote data to compare with the new one in next loop, to judge upcross and downcross
        Sleep(500)
    }
}
보실 수 있습니다.
- 전력망 선을 가로지르는 상태:
preTicker.Last < p.price && ticker.Last > p.price - 전력망선을 가로질러 이동하는 조건:
preTicker.Last > p.price && ticker.Last < p.price
이것은 지난 기사에서 언급한 것입니다.
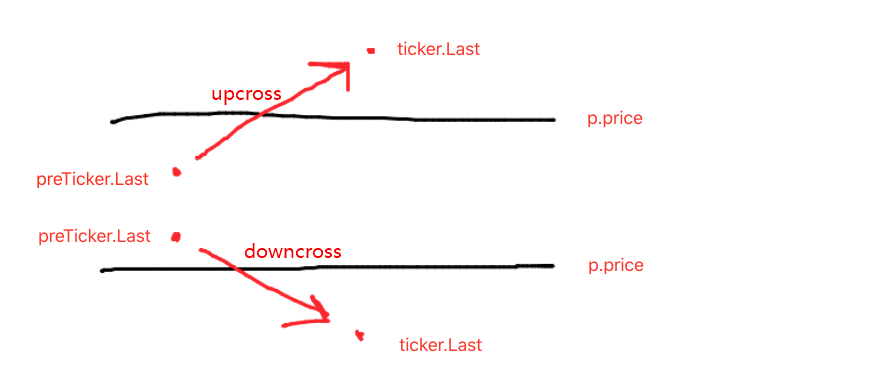
위와 아래를 판단하는 것은 주문과 거래를 결정하는 첫 번째 단계일 뿐이고, 그리드 라인 데이터의 마크도 판단해야 합니다.
만약 위와 같다면, 현재 그리드 라인, 그리고 최신 그리드 라인의 구매 마크보다 가격이 낮는지 판단합니다. 만약 구매 마크의 값이 사실이라면, 이는 마지막 그리드 라인의 실행 구매를 의미하며, 마지막 그리드 라인의 구매 마크를 거짓으로 재설정하고, 현재 그리드 라인의 판매 마크를 거짓으로 재설정합니다.
지금 언급 된 조건을 판단 한 후, 그들이 촉발되지 않는 경우, 판단을 계속합니다. 현재 그리드 라인의 구매 마크와 판매 마크가 모두 거짓이라면, 이는 현재 그리드 라인이 거래 할 수 있음을 의미합니다. 그것은 상향이기 때문에, 여기 우리는 판매 작업을 실행하고 실행 후 그리드 라인의 판매 마크를 진실로 표시합니다.
다운크로스를 처리하는 논리는 동일합니다.
- 전력망 선을 가로지르는 상태:
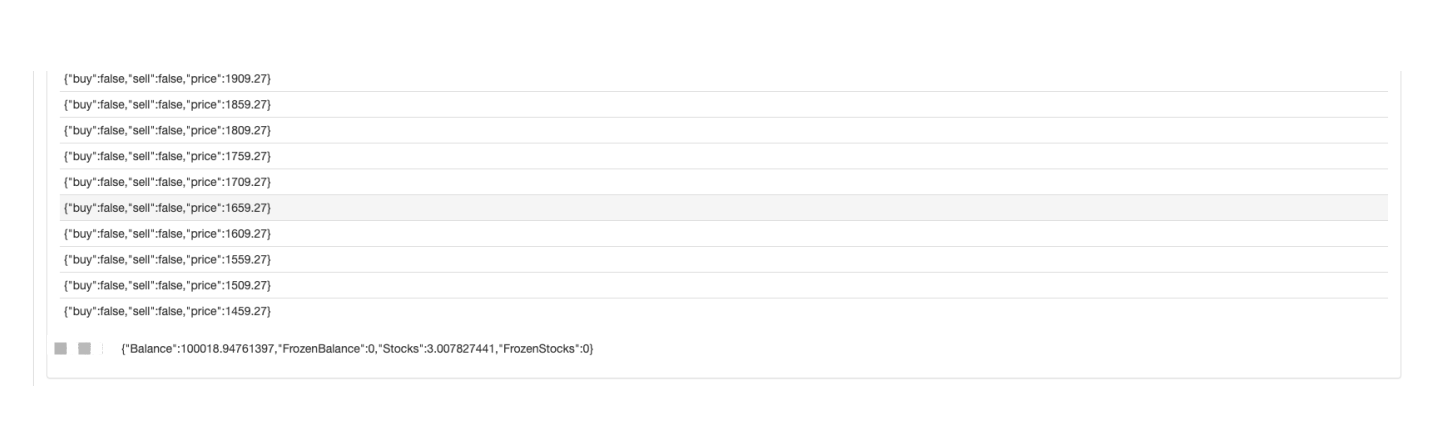
전체 전략 백테스트
백테스트 중에 어떤 데이터를 보려면, 함수showTbl데이터를 표시하기 위해 작성되었습니다.
function showTbl(arr) {
    var tbl = {
        type : "table",
        title : "grid",
        cols : ["grid information"],
        rows : []
    }
    var arrReverse = arr.slice(0).reverse()
    _.each(arrReverse, function(ele) {
        var color = ""
        if (ele.buy) {
            color = "#FF0000"
        } else if (ele.sell) {
            color = "#00FF00"
        }
        tbl.rows.push([JSON.stringify(ele) + color])
    })
    LogStatus(_D(), "\n`" + JSON.stringify(tbl) + "`", "\n account information:", exchange.GetAccount())
}
전체 전략 코드:
/*backtest
start: 2021-04-01 22:00:00
end: 2021-05-22 00:00:00
period: 1d
basePeriod: 1m
exchanges: [{"eid":"OKEX","currency":"ETH_USDT","balance":100000}]
*/

var diff = 50
var amount = 0.002
function createNet(begin, diff) {
    var oneSideNums = 10
    var up = []
    var down = []
    for (var i = 0 ; i < oneSideNums ; i++) {
        var upObj = {
            buy : false,
            sell : false,
            price : begin + diff / 2 + i * diff,
        }
        up.push(upObj)

        var j = (oneSideNums - 1) - i
        var downObj = {
            buy : false,
            sell : false,
            price : begin - diff / 2 - j * diff,
        }
        if (downObj.price <= 0) {  // the price cannot be less than or equal to 0
            continue
        }
        down.push(downObj)
    }

    return down.concat(up)
}

function showTbl(arr) {
    var tbl = {
        type : "table",
        title : "grid",
        cols : ["grid information"],
        rows : []
    }
    var arrReverse = arr.slice(0).reverse()
    _.each(arrReverse, function(ele) {
        var color = ""
        if (ele.buy) {
            color = "#FF0000"
        } else if (ele.sell) {
            color = "#00FF00"
        }
        tbl.rows.push([JSON.stringify(ele) + color])
    })
    LogStatus(_D(), "\n`" + JSON.stringify(tbl) + "`", "\n account information:", exchange.GetAccount())
}

function main() {
    var ticker = _C(exchange.GetTicker)
    var net = createNet(ticker.Last, diff)
    var preTicker = ticker
    while (true) {
        ticker = _C(exchange.GetTicker)
        // check the grid range
        while (ticker.Last >= net[net.length - 1].price) {
            net.push({
                buy : false,
                sell : false,
                price : net[net.length - 1].price + diff,
            })
        }
        while (ticker.Last <= net[0].price) {
            var price = net[0].price - diff
            if (price <= 0) {
                break
            }
            net.unshift({
                buy : false,
                sell : false,
                price : price,
            })
        }

        // index grid
        for (var i = 0 ; i < net.length ; i++) {
            var p = net[i]
            if (preTicker.Last < p.price && ticker.Last > p.price) {         // upcross, and sell; when the current node has been traded, no matter SELL or BUY, no more trade
                if (i != 0) {
                    var downP = net[i - 1]
                    if (downP.buy) {
                        exchange.Sell(-1, amount, ticker)
                        downP.buy = false
                        p.sell = false
                        continue
                    }
                }
                if (!p.sell && !p.buy) {
                    exchange.Sell(-1, amount, ticker)
                    p.sell = true
                }
            } else if (preTicker.Last > p.price && ticker.Last < p.price) {  // downcross, and buy
                if (i != net.length - 1) {
                    var upP = net[i + 1]
                    if (upP.sell) {
                        exchange.Buy(-1, amount * ticker.Last, ticker)
                        upP.sell = false
                        p.buy = false
                        continue
                    }
                }
                if (!p.buy && !p.sell) {
                    exchange.Buy(-1, amount * ticker.Last, ticker)
                    p.buy = true
                }
            }
        }

        showTbl(net)
        preTicker = ticker
        Sleep(500)
    }
}
전략 백테스트:
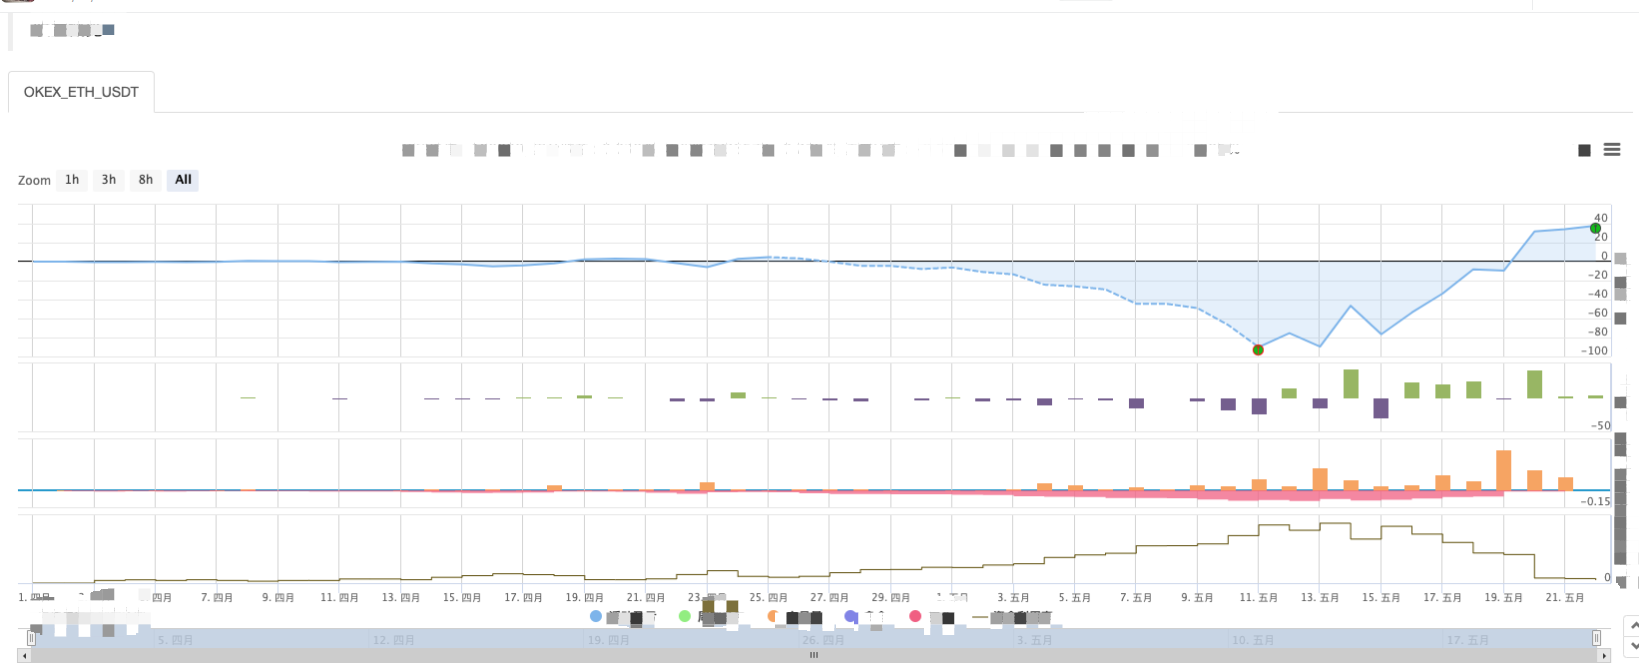
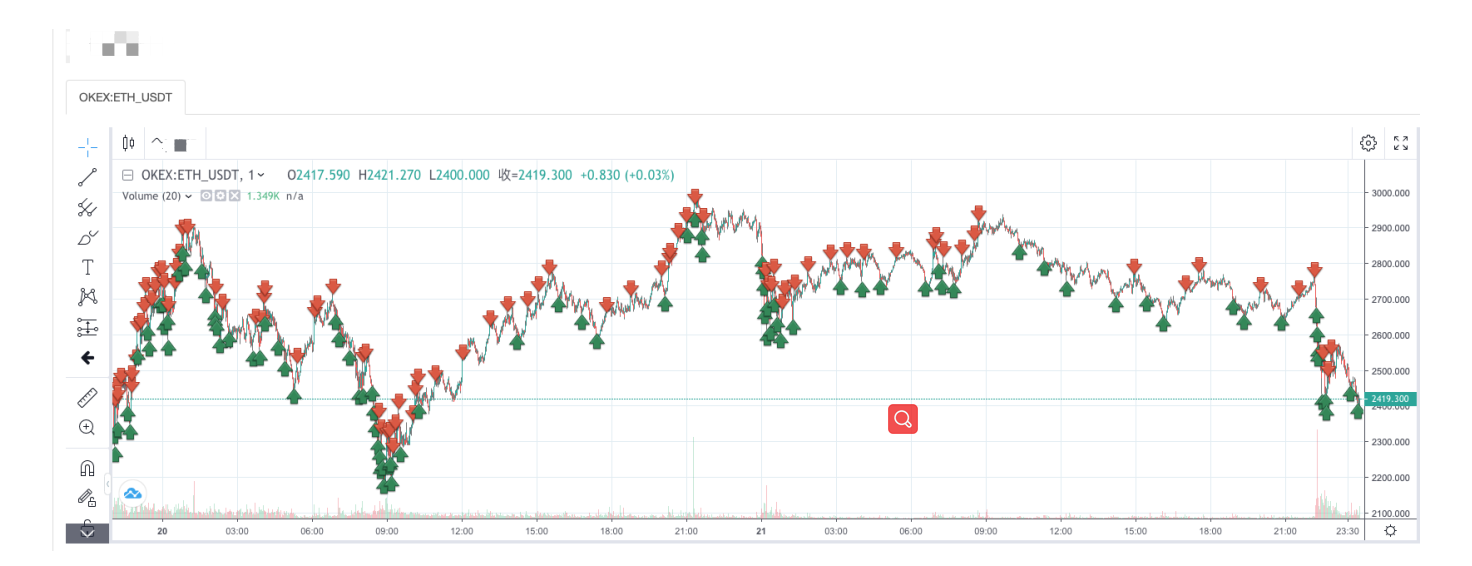
그리드 전략의 특징을 볼 수 있습니다. 트렌딩 시장이 있을 때 큰 부동 손실이 발생하고 수익은 변동적인 시장에서 회복됩니다. 따라서 네트워크 전략은 위험성이 없습니다. 스팟 전략은 여전히 평준화 할 수 있지만 선물 계약의 네트워크 전략은 더 위험하며 네트워크 매개 변수를 보수적으로 설정해야합니다.
- my 언어는 신호를 입력하기 위해 여기에 어떻게 쓰는지 한번만 출력하면 됩니다.
- 소액액액액액액액액액액액액액액액액액액
- FMZ 양자 데이터베이스를 구성하기 위해 SQLite를 사용
- 초보자, 확인해 보세요
암호화폐 양적 거래로 안내 (8) - 초보자, 확인해 보아라
암호화폐 양적 거래에 안내해 (7) - 초보자, 확인해 보세요
암호화폐 양적 거래에 안내 (6) - 초보자, 확인해 보세요
암호화폐 양적 거래로 안내 (3) - 초보자, 확인해 보세요
암호화폐 양적 거래로 안내합니다 (2) - 제 발명가의 시계는 틀렸습니다.
- 이 글은 제주도 서귀포시 서귀포시 서귀포시 서귀포시 서귀포시 서귀포시 서귀포시 서귀포시
- 초보자, 확인해 보세요
암호화폐 양적 거래로 안내 (4) - 주문 생성 시간 및 주문 완료 시간
- 마틴을 구매하기 위한 현금 네트워크 전략
- My 언어에 대해 알고 있는 여러분, 이 코드가 무엇을 의미하는지 설명해 주세요.
- 실체 오류 보고 질문
- 초보자, 확인해 보세요. 암호화폐 양적 거래에 안내합니다.
- 타이프스크립트 지원이 추가될 수 있을까요?
- 암호화폐 현금 헤지 전략 (2)
- 암호화폐 현금 헤지 전략 (1)
- Bitget API에서 ADA, AVAX, AXS, BCH, DOT, EOS, ETC, FIL, LINK, LTC, LUNA, MATIC, SOL, XRP를 평준화 할 때 문제가 발생합니다.