
이 전략은 동력 지표 RSI와 트렌드 추적 스톱 로드 지표 SuperTrend을 기반으로 중장선 동력 거래 전략을 설계했다. 이 전략은 주식 가격에 존재하는 트렌드적인 동력을 식별하는 데 주로 사용되며, 스톱 로드와 함께 수익을 고정하여 큰 회수 가능성을 감소시킵니다.
RSI 지표는 주식 가격의 동향을 효과적으로 식별할 수 있습니다. RSI 60 이상은 오버 바이 지역이며, 현재 주식은 강력한 상승 추세에 있음을 나타냅니다. RSI 40 이하는 오버 판매 지역이며, 현재 주식은 하락 추세에 있음을 나타냅니다.
이 전략은 RSI가 60보다 크면 구매 신호를 발생시키고, 주식 가격의 상승 동력을 인식하여 더 많이 구매할 수 있음을 나타냅니다.
슈퍼트렌드 (SuperTrend) 는 ATR과 가격 자체를 기반으로 동적 중지선을 계산하는 추세를 추적하는 지표입니다. 가격이 이 중지선을 뚫었을 때, 추세가 반전되어 현재의 위치를 중지해야한다는 것을 의미합니다.
이 전략은 슈퍼 트렌드 지표에 의해 계산된 스톱 로드 라인을 전략의 스톱 로드 지점으로 사용하고, 가격이 이 스톱 로드를 돌파했을 때 즉시 매매를 중단한다.
RSI를 사용하면 주식 가격에 존재하는 트렌드적 동력을 효과적으로 식별 할 수 있으므로 가격 추세가 형성되는 초기 단계에서 잠재적으로 더 많은 수익을 얻을 수 있습니다.
슈퍼 트렌드 지표의 스톱 라인을 통해 적시에 손실을 막고 과도한 회수를 피할 수 있습니다. 또한 트렌드가 진행됨에 따라 스톱 라인을 점차 높여 수익을 고정 할 수 있습니다.
이 전략은 두 가지 지표의 조합을 사용하며, 각각의 지표는 명확한 의미가 있으며, 전략 논리는 간단하고 명확하며, 이해하기 쉽고 검증됩니다.
회수 기간 동안, 가격에는 몇 가지 단기간의 돌파구가 발생할 수 있으며, 빠르게 회수되는 가짜 돌파구가 발생할 수 있습니다. 이것은 스톱 라인이 유발되어 불필요한 손실이 발생할 수 있습니다.
이 전략은 주식에서의 트렌드적 동력을 인식하기 때문에, 그 성과는 대시장 시장의 움직임을 어느 정도 따라 할 것이다. 대시장 시장의 조정이 있을 때, 전략은 추가적인 손실을 초래할 수 있다.
이 전략은 트렌드를 식별하고 추적하는 데 초점을 맞추고 있으며, 트렌드 반전의 경우를 효과적으로 식별 할 수 없습니다. 갑작스러운 트렌드 반전이 발생하면 전략이 어렵고 시간 손실로 인해 큰 손실이 발생할 수 있습니다.
다양한 RSI 변수를 테스트하여 최적의 변수 조합을 찾아 RSI가 트렌드를 식별하는 정확도를 높일 수 있습니다.
다른 유형의 상쇄 방법을 시도할 수 있습니다. 예를 들어, 출전하기 전에 일정 주기 동안 기다림 등으로, 높은 빈도의 가짜 돌파 상쇄로 인해 상쇄되는 것을 피할 수 있습니다.
MACD와 같은 지표를 추가하는 것을 고려하여 트렌드 반전을 미리 식별하여 강력한 트렌드 반전 후의 큰 손실을 피할 수 있습니다.
대시장이 큰 조정에 직면했을 때, 전략의 시장 관련성을 낮추는 특정 포트폴리오를 추가하는 것을 고려할 수 있습니다.
이 전략은 RSI의 트렌드 동력을 식별하고 SuperTrend의 트렌드 추적을 통해 두 가지 중요한 요소를 구축합니다. 이 전략은 트렌드를 효과적으로 추적 할 수 있으며, 손실을 제어 할 수 있습니다.
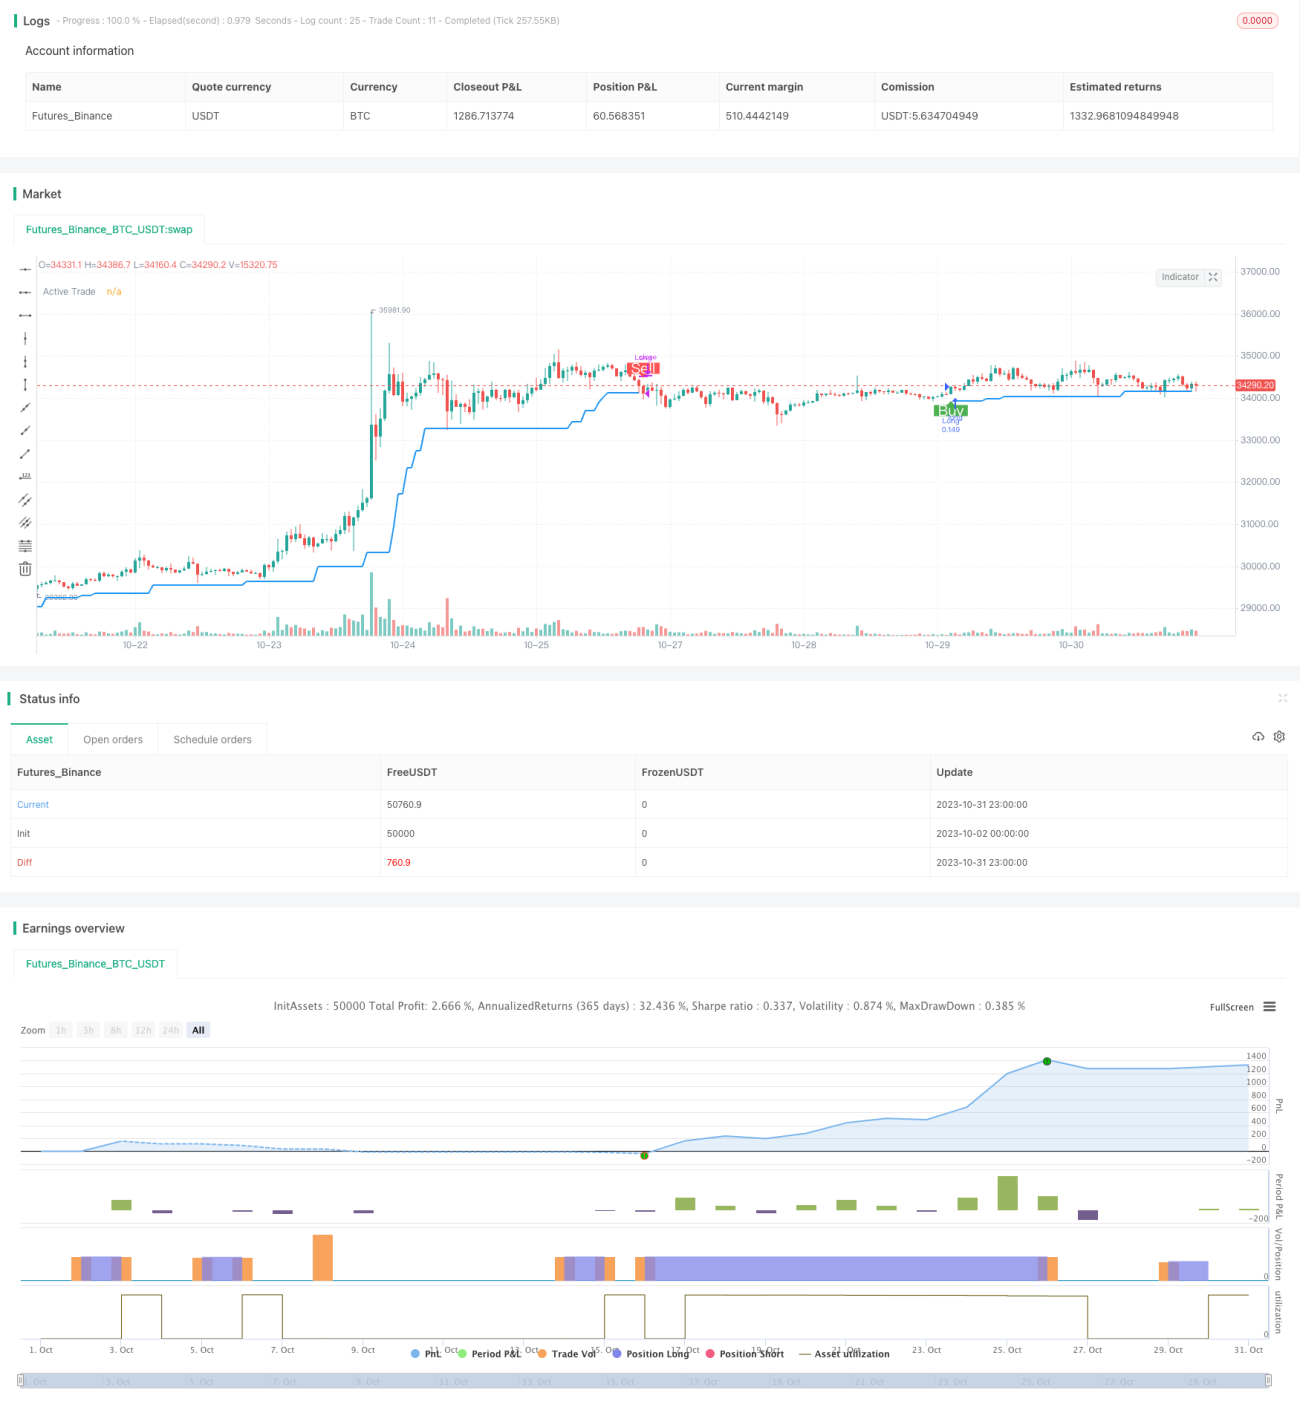
/*backtest
start: 2023-10-02 00:00:00
end: 2023-11-01 00:00:00
period: 1h
basePeriod: 15m
exchanges: [{"eid":"Futures_Binance","currency":"BTC_USDT"}]
*/
//@version=4
//
// ▒▒▒▒▒▒▒▒▒▒▒▒▒▒▒▒▒▒▒▒▒▒▒▒▒▒▒▒▒▒▒▒▒▒▒▒▒▒▒▒▒▒▒▒▒▒▒▒▒▒▒▒▒▒▒▒▒▒▒▒▒▒▒▒▒▒▒▒▒▒▒▒▒▒▒▒▒▒▒▒▒▒▒▒▒▒▒▒▒▒▒▒▒▒▒▒▒▒▒▒▒▒▒▒▒▒▒▒▒▒▒▒▒▒
// -----------------------------------------------------------------------------
// Copyright 2021 Amey Tavkar
// Momentum Trading Strategy (Weekly Chart) script may be freely distributed under the MIT license.
//
// Permission is hereby granted, free of charge,
// to any person obtaining a copy of this software and associated documentation files (the "Software"),
// to deal in the Software without restriction, including without limitation the rights to use, copy, modify, merge,
// publish, distribute, sublicense, and/or sell copies of the Software, and to permit persons to whom the Software is furnished to do so,
// subject to the following conditions:
//
// The above copyright notice and this permission notice shall be included in all copies or substantial portions of the Software.
//
// THE SOFTWARE IS PROVIDED "AS IS", WITHOUT WARRANTY OF ANY KIND,
// EXPRESS OR IMPLIED, INCLUDING BUT NOT LIMITED TO THE WARRANTIES OF MERCHANTABILITY,
// FITNESS FOR A PARTICULAR PURPOSE AND NONINFRINGEMENT. IN NO EVENT SHALL THE AUTHORS OR COPYRIGHT HOLDERS BE LIABLE FOR ANY CLAIM,
// DAMAGES OR OTHER LIABILITY, WHETHER IN AN ACTION OF CONTRACT, TORT OR OTHERWISE, ARISING FROM,
// OUT OF OR IN CONNECTION WITH THE SOFTWARE OR THE USE OR OTHER DEALINGS IN THE SOFTWARE.
//
// -----------------------------------------------------------------------------
//
// Description
// ===========
// The strategy will open position when there is momentum in the stock
// The strategy will ride up your stop loss based on the super trend.
// The strategy will close your operation when the market price crossed the stop loss.
// The strategy will close operation when the line based on the volatility will crossed
//
//
// -----------------------------------------------------------------------------
// Disclaimer:
// 1. I am not licensed financial advisors or broker dealers. I do not tell you
// when or what to buy or sell. I developed this software which enables you
// execute manual or automated trades multplierFactoriplierFactoriple trades using TradingView. The
// software allows you to set the criteria you want for entering and exiting
// trades.
// 2. Do not trade with money you cannot afford to lose.
// 3. I do not guarantee consistent profits or that anyone can make money with no
// effort. And I am not selling the holy grail.
// 4. Every system can have winning and losing streaks.
// 5. Money management plays a large role in the results of your trading. For
// example: lot size, account size, broker leverage, and broker margin call
// rules all have an effect on results. Also, your Take Profit and Stop Loss
// settings for individual pair trades and for overall account equity have a
// major impact on results. If you are new to trading and do not understand
// these items, then I recommend you seek education materials to further your
// knowledge.
//
// YOU NEED TO FIND AND USE THE TRADING SYSTEM THAT WORKS BEST FOR YOU AND YOUR
// TRADING TOLERANCE.
//
// I HAVE PROVIDED NOTHING MORE THAN A TOOL WITH OPTIONS FOR YOU TO TRADE WITH THIS PROGRAM ON TRADINGVIEW.
//
// I accept suggestions to improve the script.
// If you encounter any problems I will be happy to share with me.
// -----------------------------------------------------------------------------
//
// ▒▒▒▒▒▒▒▒▒▒▒▒▒▒▒▒▒▒▒▒▒▒▒▒▒▒▒▒▒▒▒▒▒▒▒▒▒▒▒▒▒▒▒▒▒▒▒▒▒▒▒▒▒▒▒▒▒▒▒▒▒▒▒▒▒▒▒▒▒▒▒▒▒▒▒▒▒▒▒▒▒▒▒▒▒▒▒▒▒▒▒▒▒▒▒▒▒▒▒
strategy("Momentum Trading Strategy (Weekly Chart)", precision = 2, overlay = true, default_qty_type = strategy.percent_of_equity, default_qty_value = 10)
//Entry
[fastSupertrend, fastSupertrendDir] = supertrend(5, 1)
rsi = rsi(close, 14)
entry = close > fastSupertrend and rsi > 60
strategy.entry("Long", strategy.long, when = entry)
plotshape(entry and strategy.opentrades == 0,color=color.green,text="Buy",location=location.belowbar,style=shape.labelup,textcolor=color.white, size = size.normal)
plot(fastSupertrendDir == -1 and strategy.opentrades == 1 ? fastSupertrend : na, title="Active Trade", style=plot.style_linebr, linewidth=2, color=color.blue)
//Exit
exit = close < fastSupertrend
strategy.close("Long", when = exit)
plotshape(exit and strategy.opentrades == 1,color=color.red,text="Sell",style=shape.labeldown,textcolor=color.white, size=size.normal)