더블 슈퍼 트렌드에 따른 손절매 전략

개요
이 전략은 초강력 지수 평면 이동 평균과 상대적으로 강한 지수를 기반으로, 두 개의 트렌드 추적 메커니즘을 설계하여, 동향을 정확하게 판단하고 합리적인 중단 중단 지점을 설정할 수 있습니다. 전략은 동향에 따라 중단 지점, 중단 지점, 트렌드에 따라 설정, 두 개의 트렌드 판단 등의 특징을 가지고 있으며, 개별 거래의 위험을 효과적으로 제어하여, 동향 동향에서 초강력 수익을 얻을 수 있습니다.
전략 원칙
-
슈퍼 트렌드 (Super Trend) 를 계산하여 주요 트렌드 방향을 판단할 수 있다. 슈퍼 트렌드 (Super Trend) 는 트렌드 방향을 정확하게 판단하고, 이상적인 진입 지점을 제공한다.
-
상대적으로 강하고 약한 지수 ((RSI) 를 계산하여 트렌드를 판단하는 보조 지표로 <unk> RSI가 높을 때 초상 구매 지역은 불 시장 추세를 나타냅니다. RSI가 낮을 때 초상 판매 지역은 불 시장 추세를 나타냅니다.
-
닫기 가격이 초강 지수 평면 이동 평균을 넘었을 때, 더 많이; 닫기 가격이 초강 지수 평면 이동 평균을 넘어섰을 때, 공백을 <unk>다.
-
합리적으로 스톱로스 스톱포인트를 설정한다. 초강 지수 평평 이동 평균을 스톱로스로, 초강 지수 평평 이동 평균을 합리적 이윤 스톱포인트로 설정한다.
-
정지점은 거래상황의 변동에 따라 변동한다. 거래상황이 유리한 방향으로 변하면 정지선은 유리한 방향으로 움직여 수익을 보장한다.
-
RSI가 초강한 지수 평면 이동 평균 방향과 일치할 때, 현재 트렌드가 강하다는 것을 나타내고, 이 때 전략이 출전한다. RSI가 초강한 지수 평면 이동 평균 방향과 일치하지 않을 때, 트렌드 전환의 가능성을 나타내고, 이 때 전략은 일시적으로 퇴출된다.
우위 분석
-
이중 트렌드 판단 메커니즘은 잘못된 신호를 줄이고 전략의 안정성을 향상시킵니다.
-
동향에 따라 이동하는 스톱로스는 수익을 최대한 고정시키고 너무 일찍 손실을 방지합니다.
-
RSI 지표의 사용은 일부 약한 거래 신호를 필터링 할 수 있습니다.
-
이윤을 극대화하기 위해 정지 위치를 합리적으로 설정하십시오.
-
정책의 매개 변수는 조정할 수 있으며, 다양한 품종과 상황 특성에 따라 최적화할 수 있다.
-
전략적 철회 제어, 강력한 위험 관리 능력.
위험 분석
-
중요한 정책 소식과 같은 갑작스러운 사건이 발생하면 시장이 급격하게 변동하여 막힘이 뚫려 큰 손실을 초래할 수 있습니다. 막힘을 적절히 풀어 주거나 중요한 위험 사건이 발생하기 전에 적시에 퇴출 할 수 있습니다.
-
매개 변수 설정이 잘못되면, 손실을 막기 위해 막점을 부당하게 설정하여 손실을 확대하거나 수익을 줄일 수 있습니다. 반복적으로 테스트를 통해 최적의 매개 변수 조합을 찾을 수 있습니다.
-
다중 공간 혼동 단계에서는 RSI와 초강한 지수 평평한 이동 평균이 일정한 이탈이 발생할 수 있으며, 전략이 잘못된 거래 신호를 발생시킨다. 이 시기는 일시적으로 거래하지 않고, 명확한 추세가 다시 들어오는 것을 기다릴 수 있다.
최적화 방향
-
ATR 주기 변수를 최적화하여 다른 품종의 특성에 더 적합하게 만듭니다.
-
RSI 변수 설정을 최적화하여 보다 안정적이고 신뢰할 수 있는 보조 트렌드 판단 조건을 찾습니다.
-
다른 지표 판단과 결합하여, 브린 띠, KDJ 등과 같이, 더 정확한 진출 출전 근거를 설정한다.
-
다양한 차단 전략을 테스트합니다. 추적 차단, 계단 차단, 그림자 차단과 같은 수익 수준을 최적화합니다.
-
재검토 결과에 따라 포지션 관리 전략을 조정하여 단일 거래의 위험을 줄입니다.
요약하다
이 전략은 전체적으로 강한 안정성과 지속적인 수익성을 가지고 있다. 이중 트렌드 판단 메커니즘은 잡음을 효과적으로 필터링 할 수 있고, 손해 차단 전략은 수익을 잠금하고 위험을 제어 할 수 있다. 변수 설정과 출입 출구 조건을 지속적으로 최적화함으로써 전략은 다양한 시장 환경에서 좋은 성과를 낼 수 있다.
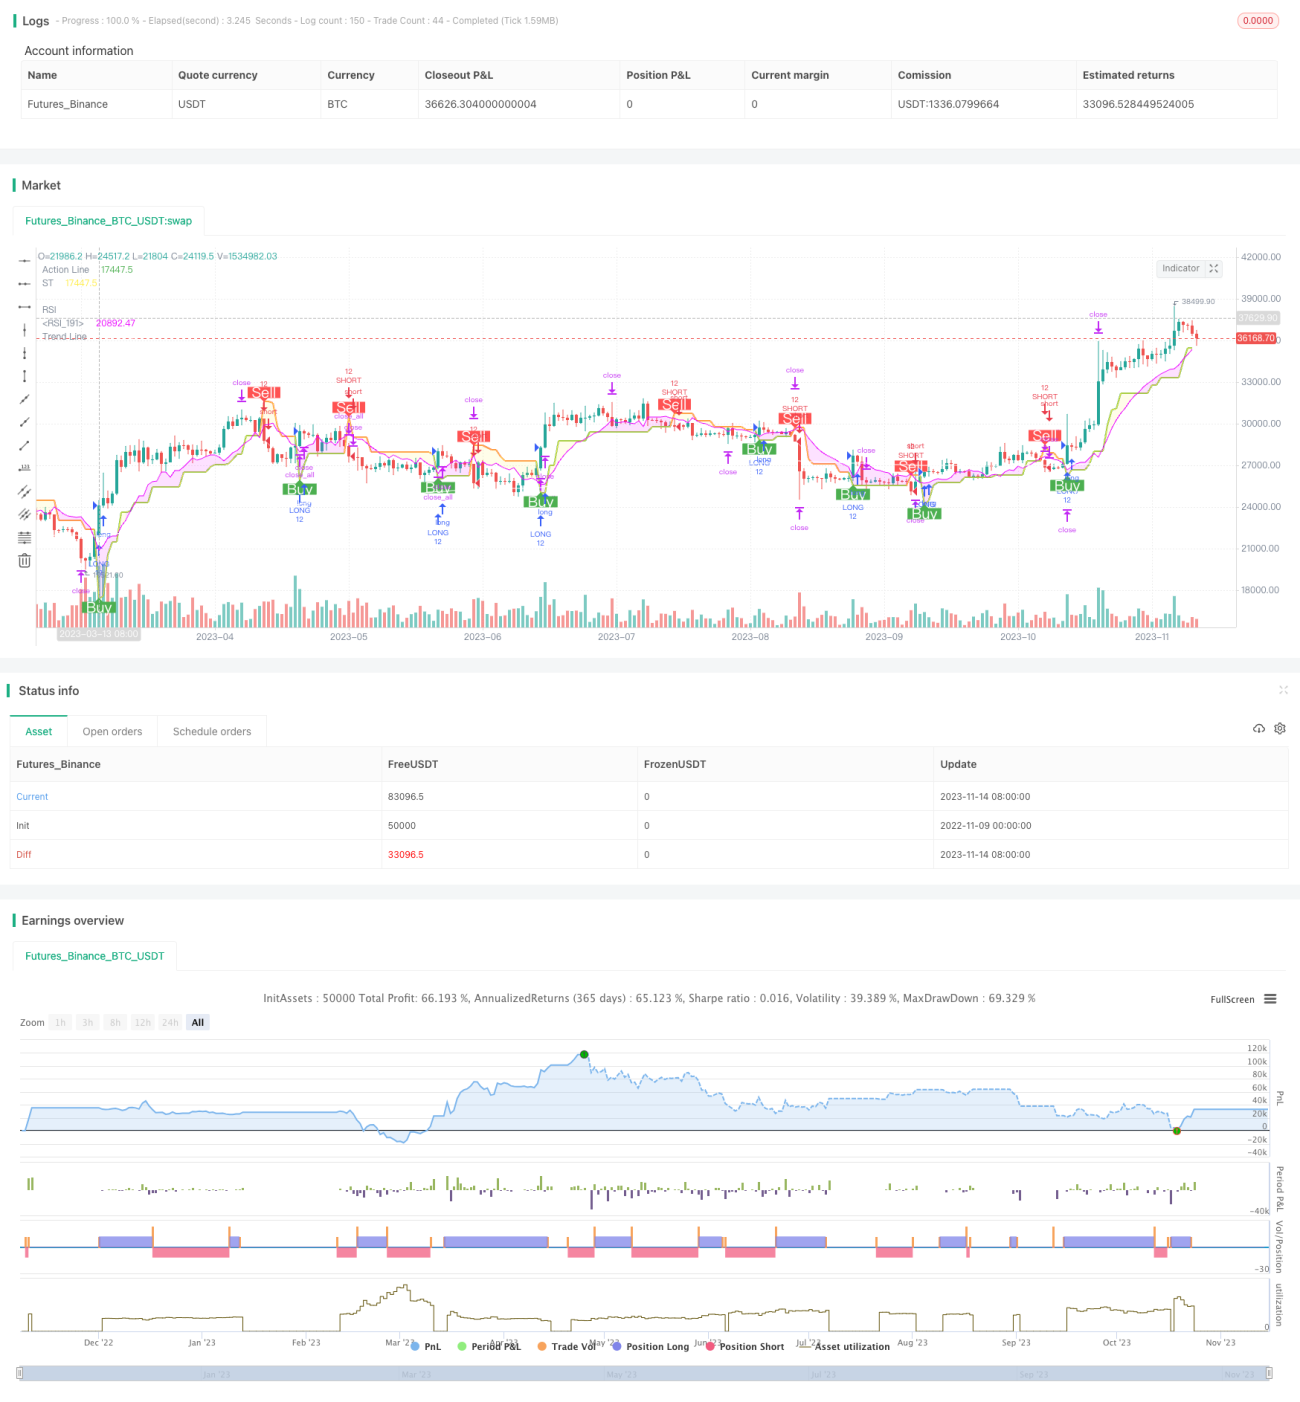
/*backtest
start: 2022-11-09 00:00:00
end: 2023-11-15 00:00:00
period: 1d
basePeriod: 1h
exchanges: [{"eid":"Futures_Binance","currency":"BTC_USDT"}]
*/

//@version=5
//
// ▒▒▒▒▒▒▒▒▒▒▒▒▒▒▒▒▒▒▒▒▒▒▒▒▒▒▒▒▒▒▒▒▒▒▒▒▒▒▒▒▒▒▒▒▒▒▒▒▒▒▒▒▒▒▒▒▒▒▒▒▒▒▒▒▒▒▒▒▒▒▒▒▒▒▒▒▒▒▒▒▒▒▒▒▒▒▒▒▒▒▒▒▒▒▒▒▒▒▒▒▒▒▒▒▒▒▒▒▒▒▒▒▒▒
// ------------------------------------------------------------------------------ 1