STARC 채널 백테스팅 전략

개요
STARC 채널 리테크 전략은 STARC 지표에 기반한 양적 거래 전략이다. 이 전략은 STARC 상하 채널을 구축하여, 파격적 인 구매와 파격적 인 판매 거래 신호 생성을 구현한다. 또한, 전략은 장단점 전환 메커니즘을 내장하고 있으며, 다양한 시장 환경에 적응할 수 있다.
전략 원칙
STARC 채널 응답 전략의 핵심은 STARC 지표입니다. 이 지표는 다음과 같습니다.
- 기준선: n일 간단한 이동 평균 SMA
- 상단: SMA + K × 평균 실제 변동幅 ATR
- 아래 트랙: SMA - K × ATR
종결 가격이 상반도를 넘어선 경우, 구매 신호를 생성하고, 종결 가격이 하반도를 넘어선 경우, 판매 신호를 생성한다.
이 전략은 STARC 통로의 상하 궤도를 매일 계산하고, 종전 가격이 상하 궤도를 뚫고 거래 신호를 생성하는지 판단한다. 동시에, 전략은 반전 파라미터를 설정하여, 긴 포지션과 빈 포지션 사이에 전환하여, 다른 시장 상황에 적응할 수 있다.
우위 분석
STARC 채널 응답 전략은 다음과 같은 장점이 있습니다:
- STARC 지표를 사용하여 상하 통로를 구축하고, 다시 측정하는 것은 좋은 결과입니다.
- 내장된 빈 창고 전환 장치, 다양한 시장 환경에 적응할 수 있습니다.
- K값과 평균선 길이를 조정할 수 있는 유연한 변수 설정.
- 전략규칙은 명확하고 이해하기 쉽고, 이해하기 쉽게 구현됩니다.
- 시각적 지표, 직관적으로 시장 위치를 판단한다.
위험 분석
STARC 통로 응답 전략에는 위험도 있습니다.
- STARC 지표는 중장기 거래에 자주 사용되며, 단기간에 효과가 좋지 않을 수 있습니다.
- 이 거래는 거래소와 거래소와 거래소와 거래소와 거래소와 거래소와 거래소와 거래소와 거래소와 거래소와 거래소와 거래소와 거래소와 거래소와 거래소입니다.
- 회전 변수 설정이 잘못되면 거래가 너무 자주 발생할 수 있습니다.
- 매개 변수 최적화가 잘못되면 곡선이 잘 맞을 수 있다.
위험은 다음과 같습니다.
- 적절한 거래주기를 선택하세요.
- 합리적인 스톱 포지션을 설정하여 단편적 손실을 제어합니다.
- 포지션을 자주 바꾸지 않도록 회전 매개 변수를 신중하게 설정하십시오.
- 다중 조합 파라미터 최적화, 과 적합 방지 <unk>
최적화 방향
STARC 채널 응답 전략의 주요 최적화 방향은 다음과 같습니다.
- 최적화 변수: 평균선 길이, K 값, ATR 주기 등의 변수를 조정하여 최적의 변수 조합을 찾습니다.
- 손해 제도를 추가합니다. 이동 손해, 시간 손해, 비율 손해 등을 설정하여 위험을 제어합니다.
- 다른 지표와 결합하여: 거래량, 브린 띠와 같은 지표를 추가하여 필터링을 통해 효율성을 향상시킵니다.
- 동적 조정 매개 변수: 시장 변화에 따라 자동으로 조정 매개 변수를 최적화하여 안정성을 높인다.
이러한 최적화 방향은 위험을 통제하면서 전략의 수익률과 안정성을 높일 수 있습니다.
요약하다
STARC 채널 리테인먼트 전략은 전체적으로 잘 작동하며, STARC 지표를 기반으로 중장선 돌파 거래를 달성했다. 전략의 장점은 STARC 채널을 사용하여 거래 신호 안정성을 생성하고, 시장 변화에 적응할 수 있는 반전 메커니즘을 설정하는 것입니다. 우리는 또한 shean을 보호하고, 스톱 손실을 설정하고, 전략을 더 안정적이고 효율적으로 만들기 위해 최적화 매개 변수를 설정해야합니다.
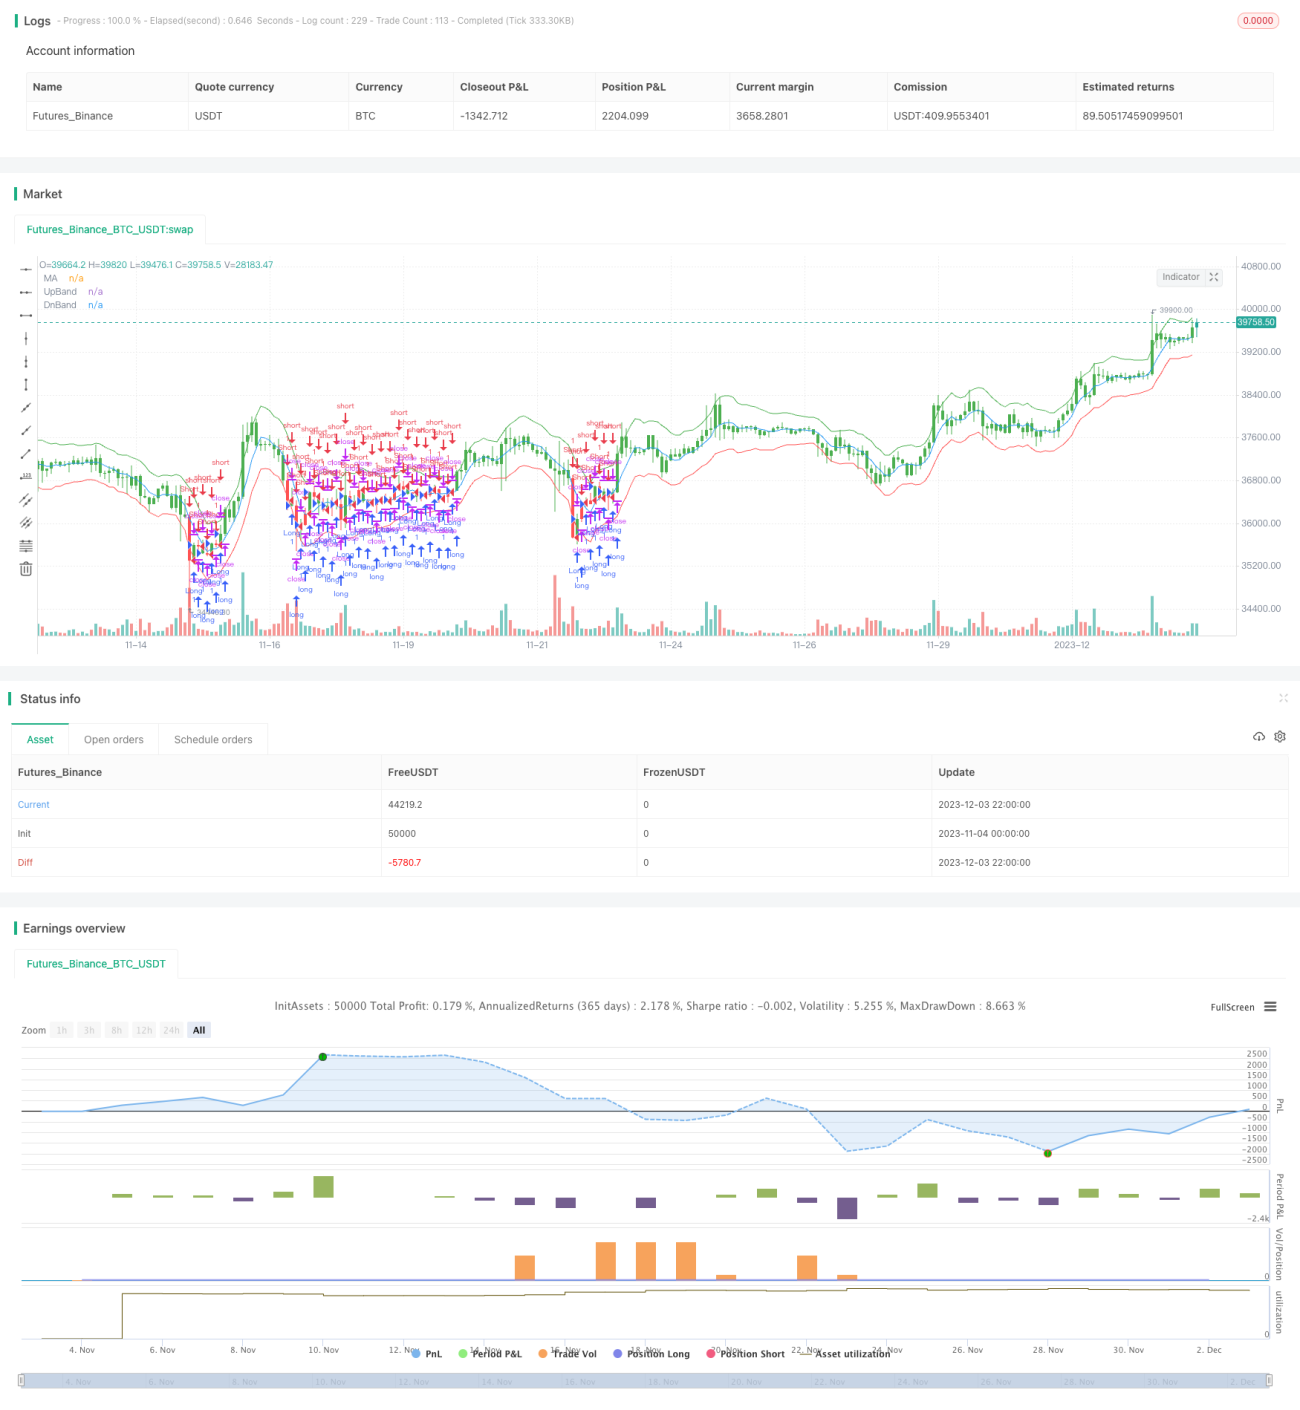
/*backtest
start: 2023-11-04 00:00:00
end: 2023-12-04 00:00:00
period: 2h
basePeriod: 15m
exchanges: [{"eid":"Futures_Binance","currency":"BTC_USDT"}]
*/

//@version=2
////////////////////////////////////////////////////////////
//  Copyright by HPotter v1.0 23/04/2018
// A type of technical indicator that is created by plotting two bands around - 1