오실레이터 변동성 우수한 지표 거래 전략

개요
흔들림 오비탈 우수 지표 거래 전략은 빌 윌리엄스가 그의 저서 ?? 새로운 거래 차원 <unk>에서 제시한 제안에 기초하여 개발된 양적 거래 전략이다. 이 전략은 빠른 이동 평균과 느린 이동 평균의 차원을 사용하여 흔들림 지표를 구성하고, 기둥 모양의 그래프 형태로 표시되며, 기둥 모양의 색상의 변화로 거래 신호를 발산한다.
전략 원칙
이 전략의 핵심 지표는 흔들림 진동 우수 지표 (Awesome Oscillator, AO) 이며, 계산 공식은 다음과 같다.
AO = SMA(Median Price, Fast Length) - SMA(Median Price, Slow Length)
그 중, Median Price는 높은 가격과 낮은 가격의 평균을 취한다. Fast Length는 빠른 이동 평균의 주기 길이를 나타내고, Slow Length는 느린 이동 평균의 주기 길이를 나타낸다.
AO 지표는 빠른 이동 평균과 느린 이동 평균의 차이를 통해 시장 가격의 변동 상황을 다른 시간 스케일에서 반영한다. 빠른 이동 평균이 느린 이동 평균보다 높을 때, 단기 가격 힘이 장기 가격 힘보다 강하다는 것을 의미하며, 구매 신호를 발산한다. 빠른 이동 평균이 느린 이동 평균보다 낮을 때, 단기 가격 힘이 장기 가격 힘보다 약하다는 것을 의미하며, 판매 신호를 발산한다.
이 전략은 AO 지표의 현재값과 이전 주기의 차치값을 사용하여 현재 주기의 빈 상태를 판단하고, 기둥 모양의 도표에 다른 색으로 표시한다: 현재 AO 값이 이전 주기보다 크면 파란색으로 표시되어 구매를 적합하게 나타낸다. 현재 AO 값이 이전 주기보다 작으면 빨간색으로 표시되어 판매를 적합하게 나타낸다.
우위 분석
이 전략은 다음과 같은 장점을 가지고 있습니다.
- 이동 평균의 차이를 사용하여 지표를 구성하여 가격 데이터를 평형화하여 시장 소음을 필터링하는 데 도움이됩니다.
- 급속한 평균의 차이는 시장의 가격 추세 변화를 다른 시간대에서 포착합니다.
- 기둥 모양의 도표는 직관적으로 공백 상태를 표시하여 거래 방향을 쉽게 판단할 수 있습니다.
- 사용자 정의 파라미터를 사용하여 지표의 민감도를 조정할 수 있습니다.
위험 분석
이 전략에는 위험도 있습니다.
- 잘못된 매개 변수 설정은 거래 신호의 빈도를 높여서 과다 거래로 이어질 수 있습니다.
- 지표의 구조는 복잡하고, 변수가 잘못되면 거래 기회를 놓칠 수 있습니다.
- pointed 소스는 단일이며, 다른 지표와 결합하여 검증 개선을 수행할 수 있다.
위와 같은 위험을 줄이기 위해, 매개 변수 설정을 최적화하고, 지표를 구성하는 방법을 조정할 수 있으며, 다른 지표와 함께 검증할 수 있다.
최적화 방향
이 전략은 다음과 같은 부분에서 최적화될 수 있습니다.
- 빠른 속도와 느린 평균선의 길이 변수를 최적화하여 최적의 변수 조합을 찾습니다.
- 다른 종류의 이동 평균을 사용하여 EMA, LWMA 등과 같은 AO 지표를 만들도록 시도하십시오.
- 동향형 지표와 진동형 지표의 결합으로 지표의 효과를 높여라.
- 단편적 손실을 통제하기 위해 손해 방지 장치를 추가하십시오.
요약하다
요약하자면, 흔들림 변동 우수 지표 거래 전략은 빠른 속도로 움직이는 평균의 차이를 사용하여 가격 추세 변화를 판단하여 단기 반전의 기회를 효과적으로 발견 할 수 있습니다. 이 전략의 개념은 명확하고 실행하기 쉽고, 매개 변수를 최적화하고 다른 지표와 결합하여 더 나은 거래 효과를 얻을 수 있습니다.
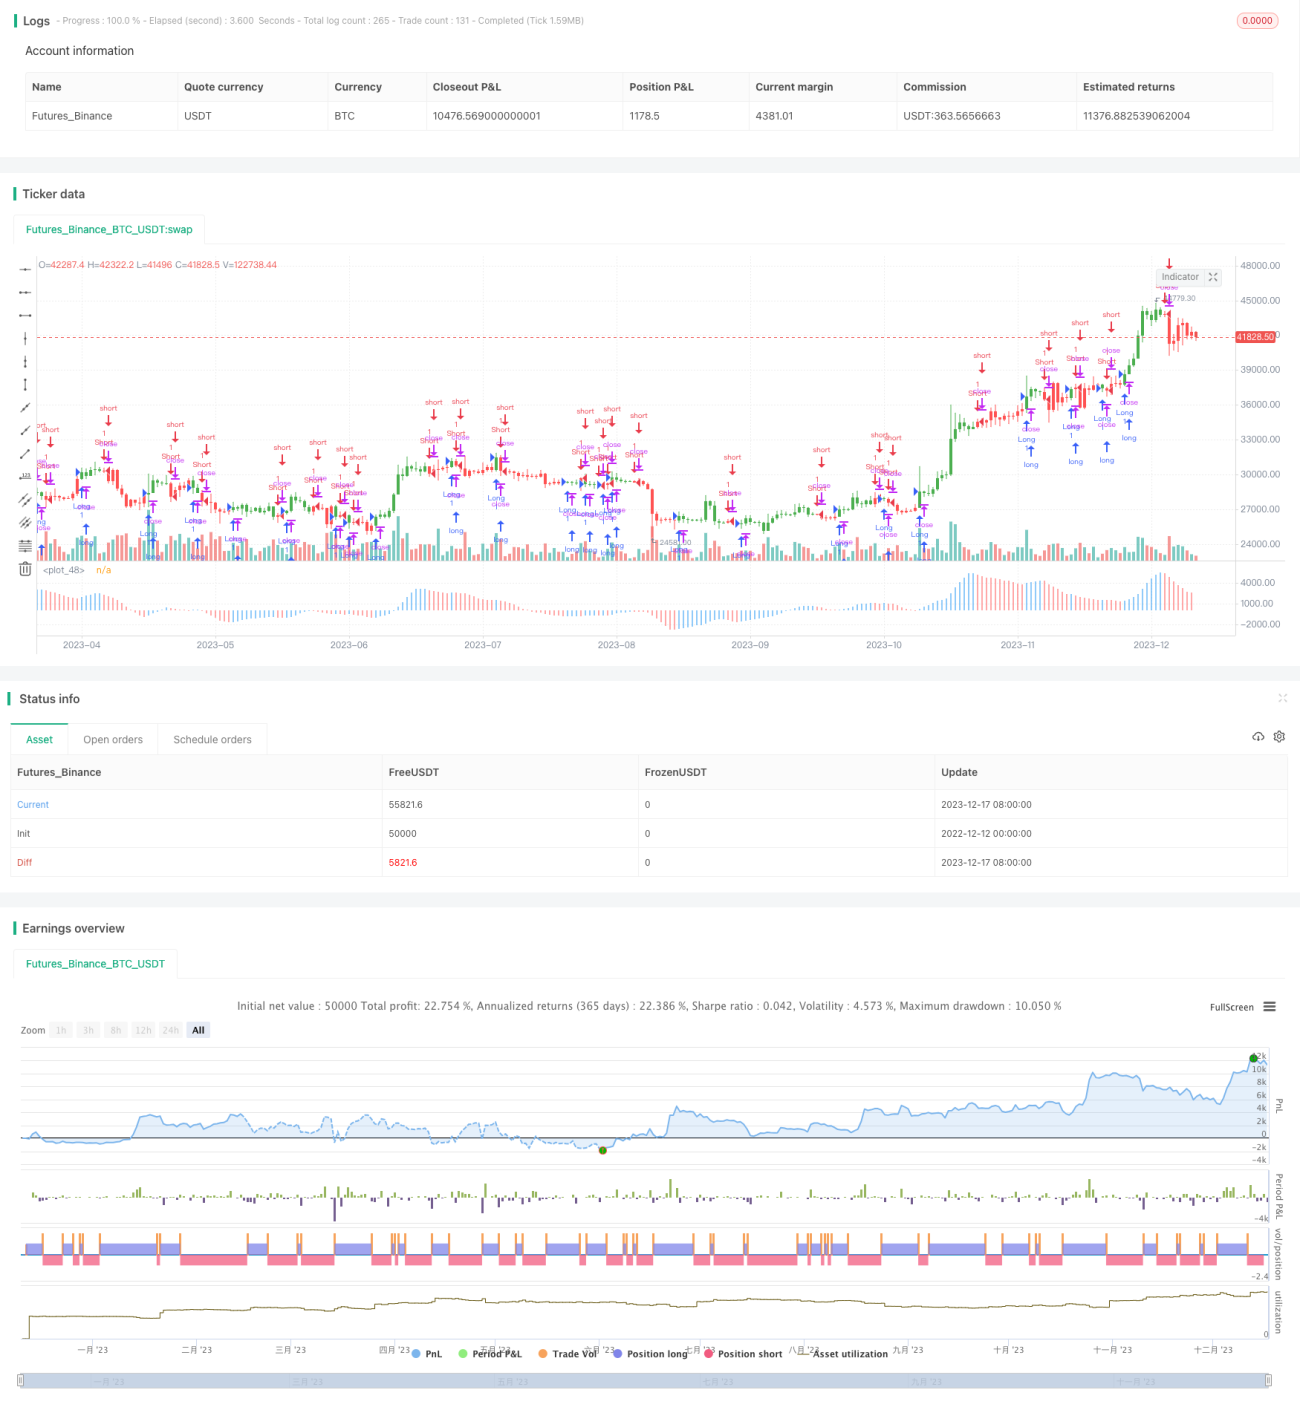
/*backtest
start: 2022-12-12 00:00:00
end: 2023-12-18 00:00:00
period: 1d
basePeriod: 1h
exchanges: [{"eid":"Futures_Binance","currency":"BTC_USDT"}]
*/

//@version=2
////////////////////////////////////////////////////////////
//  Copyright by HPotter v1.0 29/12/2016
// This indicator is based on Bill Williams` recommendations from his book - 1