퓨전 이동 평균 다중 교차 거래 전략

개요
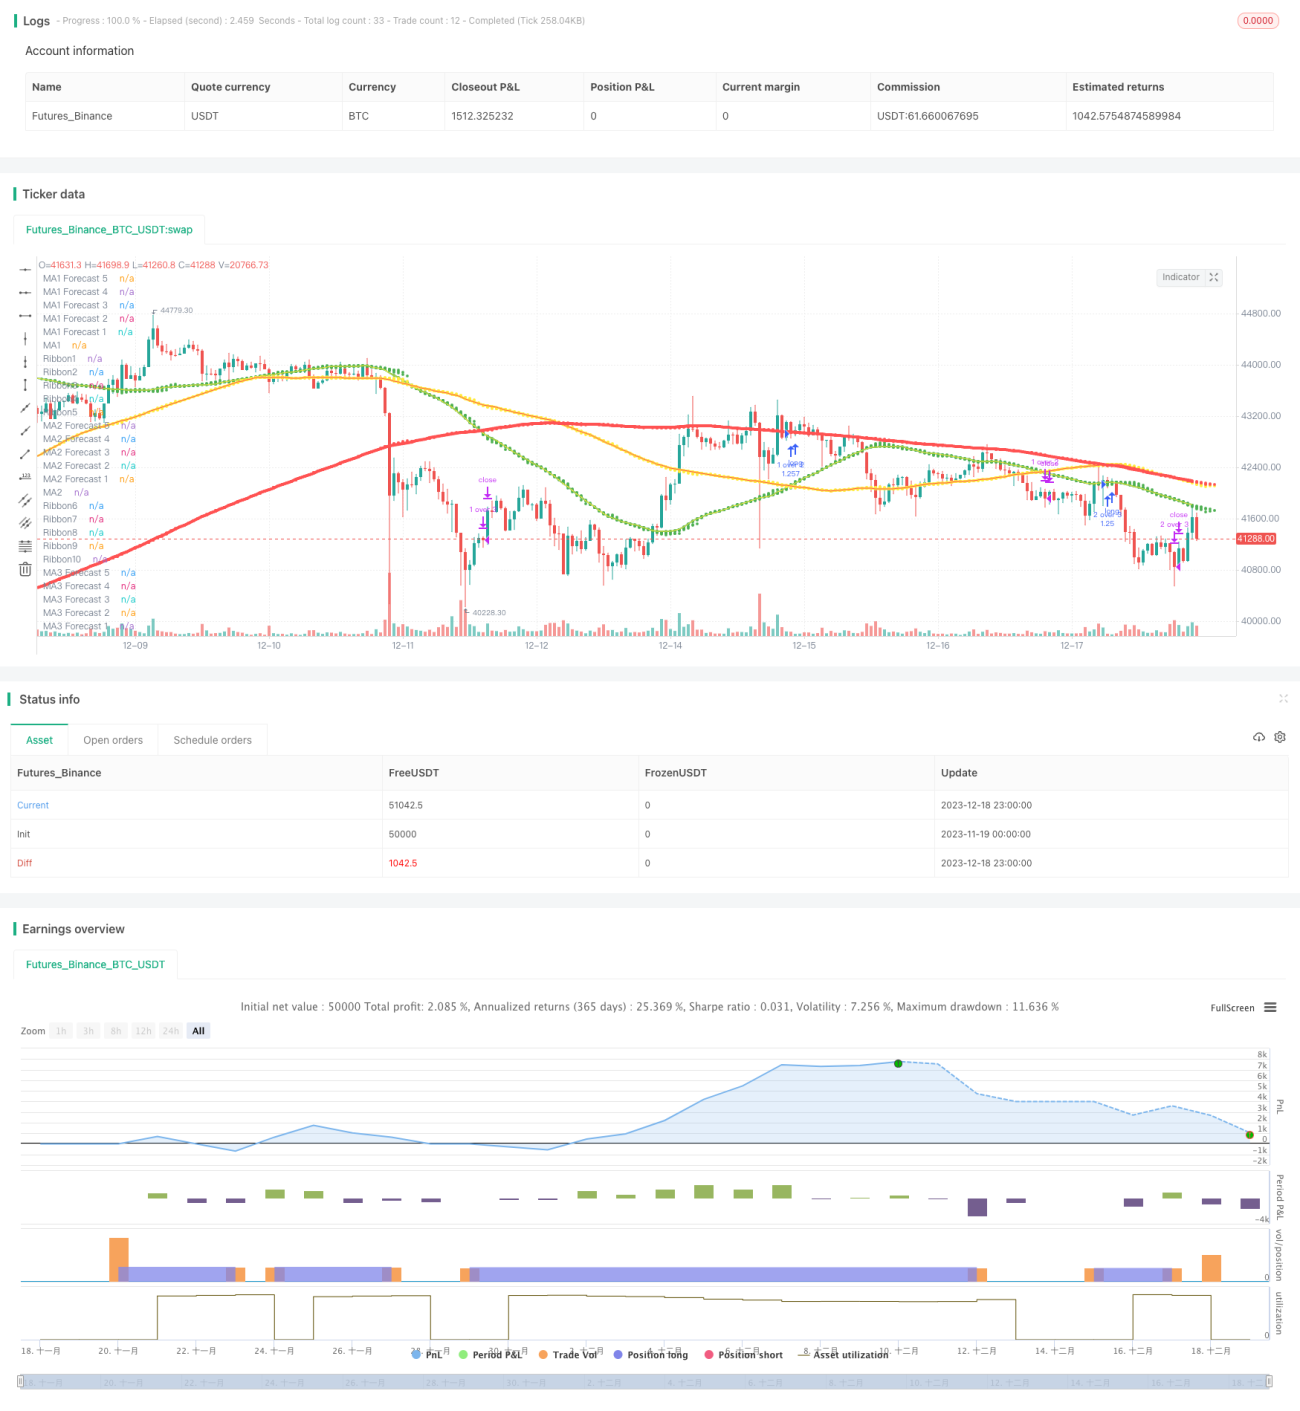
이 전략은 세 개의 이동 평균 (MA1, MA2, MA3) 의 교차를 기반으로 한 거래 전략이다. 세 개의 이동 평균의 유형, 주기, 가격 데이터 소스 및 해상도를 설정하고, 거래가 그들 사이의 교차를 허용하는지 여부를 설정함으로써 유연한 거래 전략의 조합을 얻을 수 있다.
원칙
이 전략은 주로 세 개의 이동 평균 사이에 생성 된 교차 및 중복 신호를 거래 신호로 사용합니다. 더 짧은 기간의 이동 평균이 더 긴 기간의 이동 평균을 상향으로 넘어가면 긴 포지션을 개시하는 신호를 생성합니다. 더 짧은 기간의 이동 평균이 더 긴 기간의 이동 평균을 상향으로 넘어가면 평소 포지션 신호를 생성합니다.
사용자는 3개의 이동 평균의 유형 (SMA, EMA 등), 주기, 가격 데이터 소스 (폐쇄 가격, 최고 가격 등), K선 해상도 (분선, 일선 등) 을 자유롭게 선택할 수 있다. 또한 각 이동 평균 사이의 교차 거래를 열거나 열지 여부를 선택할 수 있으며, 특정 교차에 대한 거래 조치를 취할지 여부를 결정할 수 있다.
이 전략은 현재는 시장 가격으로만 포지션을 열고 포지션을 <unk>니다. 매 거래마다 투자된 자금은 계좌의 총권익의 100%에 해당한다.
장점
- 이동 평균의 유형, 주기 등과 같은 변수를 자유롭게 선택할 수 있는 최적화 및 조합, 곡선 적합의 위험을 줄일 수 있다
- 다중 이동 평균의 교차는 거래의 빈도를 높이는 여러 거래 기회를 만듭니다.
- 동향과 반향을 균형 잡는 데에는 장기, 중기, 단기 이동 평균을 이용합니다.
- 다양한 K선 해상도를 지원하며, 여러 시간 프레임 분석이 가능합니다.
- 자율 예측 기능, 매개 변수 적합성을 테스트 할 수 있습니다.
위험
- 대량 변수 조합으로 인해 과잉 최적화가 발생할 수 있습니다.
- 거래 빈도가 높기 때문에 거래 수수료와 슬라이드 포인트 비용이 증가할 수 있습니다.
- 시장 가격 표를 사용하면 입장이 제한되지 않습니다.
- 다중 이동 평균 충돌 신호가 발생할 수 있습니다.
- 리포트와 실 디스크의 성능이 다를 수 있다
최적화 제안
- 워크스 포워드 분석을 사용하여 유효한 변수 범위를 얻습니다.
- 트랜잭션 수수료와 슬라이드 포인트 비용을 재측정에 포함합니다.
- 시장 가격 대신 한정 가격표를 시도해 보세요.
- 필터링 조건을 추가하여 충돌 신호를 방지합니다.
- 모의 현실 환경의 피드백에서 검증 전략
요약하다
이 전략은 이동 평균의 평평한 특성과 교차 신호의 패턴 인식 능력을 통합하여 사용한다. 사용자는 유연하게 변수를 선택할 수 있으며, 트렌드 따라와 역전 인식 사이에 균형을 잡는다. 또한 과도한 최적화 위험을 통제하는 데 주의를 기울여야하며, 실제 환경을 모방하는 복잡한 시장에서 전략의 건전성을 검증한다.
- 1