 ["abc", "def", {"type": "button", "cmd": "coverAll", "name": "close position"}]
      ]
  })"_json;

  auto ticker = exchange.GetTicker();
  json jsonTicker = R"({"Buy": 0, "Sell": 0, "High": 0, "Low": 0, "Volume": 0, "Last": 0, "Time": 0})"_json;
  jsonTicker["Buy"] = ticker.Buy;
  jsonTicker["Sell"] = ticker.Sell;
  jsonTicker["Last"] = ticker.Last;
  jsonTicker["Volume"] = ticker.Volume;
  jsonTicker["Time"] = ticker.Time;
  jsonTicker["High"] = ticker.High;
  jsonTicker["Low"] = ticker.Low;

  json arr = R"([{"body": {}, "colspan": 2}, "abc"])"_json;
  arr[0]["body"] = jsonTicker;
  table["rows"].push_back(arr);
  LogStatus("`" + table.dump() + "`");
}
)
- Vertical merger
```js
function main() {
var table = {
type: 'table',
title: 'Table demo',
cols: ['ColumnA', 'ColumnB', 'ColumnC'],
rows: [
['A1', 'B1', {'type':'button', 'cmd': 'coverAll', 'name': 'C1'}]
]
}
var ticker = exchange.GetTicker()
var name = exchange.GetName()
table.rows.push([{body : "A2 + B2:" + JSON.stringify(ticker), colspan : 2}, "C2"])
table.rows.push([{body : "A3 + A4 + A5:" + name, rowspan : 3}, "B3", "C3"])
// A3 is merged by the first cell in the previous row
table.rows.push(["B4", "C4"])
// A2 is merged by the first cell in the previous row
table.rows.push(["B5", "C5"])
table.rows.push(["A6", "B6", "C6"])
LogStatus('`' + JSON.stringify(table) + '`')
}
import json
def main():
    table = {
        "type" : "table",
        "title" : "Table demo",
        "cols" : ["ColumnA", "ColumnB", "ColumnC"],
        "rows" : [
            ["A1", "B1", {"type": "button", "cmd": "coverAll", "name": "C1"}]
        ]
    }

    ticker = exchange.GetTicker()
    name = exchange.GetName()

    table["rows"].append([{"body": "A2 + B2:" + json.dumps(ticker), "colspan": 2}, "C2"])
    table["rows"].append([{"body": "A3 + A4 + A5:" + name, "rowspan": 3}, "B3", "C3"])
    table["rows"].append(["B4", "C4"])
    table["rows"].append(["B5", "C5"])
    table["rows"].append(["A6", "B6", "C6"])
    LogStatus("`" + json.dumps(table) + "`")
void main() {
    json table = R"({
        "type" : "table",
        "title" : "Table demo",
        "cols" : ["ColumnA", "ColumnB", "ColumnC"],
        "rows" : [
            ["A1", "B1", {"type": "button", "cmd": "coverAll", "name": "C1"}]
        ]
    })"_json;
    // In order to test, the code is short and easy to read, and the constructed data is used here
    json jsonTicker = R"({"High": 0, "Low": 0, "Buy": 0, "Sell": 0, "Last": 0, "Time": 0, "Volume": 0})"_json;
    auto name = exchange.GetName();
    json arr1 = R"([{"body": "", "colspan": 2}, "C2"])"_json;
    arr1[0]["body"] = "A2 + B2:" + jsonTicker.dump();
    json arr2 = R"([{"body": "", "rowspan": 3}, "B3", "C3"])"_json;
    arr2[0]["body"] = "A3 + A4 + A5:" + name;
    table["rows"].push_back(arr1);
    table["rows"].push_back(arr2);
    table["rows"].push_back(R"(["B4", "C4"])"_json);
    table["rows"].push_back(R"(["B5", "C5"])"_json);
    table["rows"].push_back(R"(["A6", "B6", "C6"])"_json);
    LogStatus("`" + table.dump() + "`");
}
)
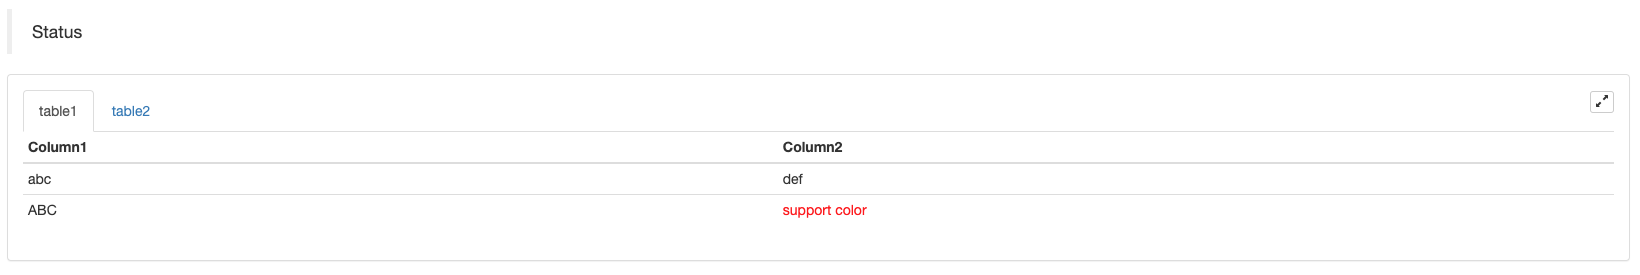
Tampilan bar status halaman jadual:
function main() {
    var table1 = {type: 'table', title: 'table1', cols: ['Column1', 'Column2'], rows: [ ['abc', 'def'], ['ABC', 'support color #ff0000']]}
    var table2 = {type: 'table', title: 'table2', cols: ['Column1', 'Column2'], rows: [ ['abc', 'def'], ['ABC', 'support color #ff0000']]}
    LogStatus('`' + JSON.stringify([table1, table2]) + '`')
}
import json
def main():
    table1 = {"type": "table", "title": "table1", "cols": ["Column1", "Column2"], "rows": [ ["abc", "def"], ["ABC", "support color #ff0000"]]}
    table2 = {"type": "table", "title": "table2", "cols": ["Column1", "Column2"], "rows": [ ["abc", "def"], ["ABC", "support color #ff0000"]]}
    LogStatus("`" + json.dumps([table1, table2]) + "`")
void main() {
    json table1 = R"({"type": "table", "title": "table1", "cols": ["Column1", "Column2"], "rows": [ ["abc", "def"], ["ABC", "support color #ff0000"]]})"_json;
    json table2 = R"({"type": "table", "title": "table2", "cols": ["Column1", "Column2"], "rows": [ ["abc", "def"], ["ABC", "support color #ff0000"]]})"_json;
    json arr = R"([])"_json;
    arr.push_back(table1);
    arr.push_back(table2);
    LogStatus("`" + arr.dump() + "`");
}
Sebagai tambahan kepada halaman jadual, pelbagai jadual boleh disusun dari atas ke bawah.
function main(){
    var tab1 = {
        type : "table",
        title : "table1",
        cols : ["1", "2"],
        rows : []
    }
    var tab2 = {
        type : "table",
        title : "table2",
        cols : ["1", "2", "3"],
        rows : []
    }
    var tab3 = {
        type : "table",
        title : "table3",
        cols : ["A", "B", "C"],
        rows : []
    }

    tab1.rows.push(["jack", "lucy"])
    tab2.rows.push(["A", "B", "C"])
    tab3.rows.push(["A", "B", "C"])

    LogStatus('`' + JSON.stringify(tab1) + '`\n' +
        '`' + JSON.stringify(tab2) + '`\n' +
        '`' + JSON.stringify(tab3) + '`')

    Log("exit")
}
import json
def main():
    tab1 = {
        "type": "table",
        "title": "table1",
        "cols": ["1", "2"],
        "rows": []
    }
    tab2 = {
        "type": "table",
        "title": "table2",
        "cols": ["1", "2", "3"],
        "rows": []
    }
    tab3 = {
        "type": "table",
        "title": "table3",
        "cols": ["A", "B", "C"],
        "rows": []
    }

    tab1["rows"].append(["jack", "lucy"])
    tab2["rows"].append(["A", "B", "C"])
    tab3["rows"].append(["A", "B", "C"])
    LogStatus("`" + json.dumps(tab1) + "`\n" +
        "`" + json.dumps(tab2) + "`\n" +
        "`" + json.dumps(tab3) + "`")
void main() {
    json tab1 = R"({
        "type": "table",
        "title": "table1",
        "cols": ["1", "2"],
        "rows": []
    })"_json;
    json tab2 = R"({
        "type": "table",
        "title": "table2",
        "cols": ["1", "2", "3"],
        "rows": []
    })"_json;
    json tab3 = R"({
        "type": "table",
        "title": "table3",
        "cols": ["A", "B", "C"],
        "rows": []
    })"_json;
    tab1["rows"].push_back(R"(["jack", "lucy"])"_json);
    tab2["rows"].push_back(R"(["A", "B", "C"])"_json);
    tab3["rows"].push_back(R"(["A", "B", "C"])"_json);
    LogStatus("`" + tab1.dump() + "`\n" +
        "`" + tab2.dump() + "`\n" +
        "`" + tab3.dump() + "`");
}
Hasil operasi:)
Nota:
Apabila bot strategi berjalan di halaman bot, jika anda menggulir melalui rekod sejarah, bar status akan memasuki keadaan tidak aktif dan berhenti mengemas kini. Data bar status hanya akan menyegarkan apabila log berada di halaman pertama.
Bar status menyokong output imej dikodkan dalambase64, dan juga menyokong output imej dikodkan dalambase64Kerana panjang rentetan imej yang dikodkan biasanya sangat panjang, tiada kod sampel diberikan.
EnableLog ((()
EnableLog(IsEnable)menghidupkan atau mematikan rakaman log untuk maklumat pesanan. Nilai parameter:isEnableadalah jenis bool. JikaIsEnableditetapkan kepadafalse, log pesanan tidak akan dicetak dan ia tidak akan ditulis ke pangkalan data bot.
Jadual ((...)
Chart(...), fungsi untuk menyesuaikan gambar carta.
Chart({…}); parameter ialahHighCharts.StockChartparameterHighStocksyang boleh diserialisasikan dalamJSON, dengan menambah_isStockattribute kepada parameter asli. Jika anda menentukan_isStock:false, ia akan dipaparkan sebagai carta biasa.
Nota:
Jika anda menetapkan sifat_isStockkepadafalse, carta yang digunakan ialah:Carta tinggi, seperti yang ditunjukkan dalam carta:
)
Jika kita menetapkan atribut_isStockkepadatrue, carta yang digunakan ialah:Stok tinggi(default)_isStocksebagai benar), seperti yang ditunjukkan dalam carta:
)
Untuk kembali ke objek, anda boleh memanggiladd(n, data) (n(seperti 0) adalah indeksseries, dandataadalah data yang ditulis dalam carta) untuk menambah data kepada indeks yang ditentukanseries; panggilanreset()untuk membersihkan data carta, danresetboleh mengambil parameter berangka dan menentukan bilangan item yang disediakan.
Kamu boleh hubungiadd(n, data, i) (iadalah indeks data ini dalamseries) untuk mengubah data dalamseries.
Ia boleh menjadi negatif,
chart.add(0, [1574993606000, 13.5], -1), menukar data titik terakhirseries[0].data.
Untuk ia menyokong untuk memaparkan pelbagai carta, anda hanya perlu lulus dalam parameter array semasa konfigurasi, seperti:var chart = Chart([{…}, {…}, {…}])Sebagai contoh, carta 1 mempunyai duaseries, carta 2 mempunyai satuseries, dan carta 3 mempunyai satuseries. Kemudian, tentukan siri ID 0 dan 1 apabila menambah mewakili untuk mengemas kini data dua barisan urutan carta 1; tentukan siri ID 2 apabila menambah merujuk kepada yang pertamaseriesData; menentukan siri ID3 merujuk kepada data yang pertamaseriesdaripada carta 3.
HighStocks: http://api.highcharts.com/highstock
Tetapan atribut yang berkaitan dengan paparan pelbagai carta:contoh
Sebagai contoh, objek konfigurasi carta:
var cfgA = {
    extension: {
        // It does not participate in grouping, displayed separately, and its default is 'group'
        layout: 'single',
        // This is the specified height, which can be set to string "300px" (set "300", and "300px" will be displayed instead automatically)
        height: 300,
        // It is the unit value of the specified width, with a total value of 12
        col: 8
    },
    title: {
        text: 'Market Chart'
    },
    xAxis: {
        type: 'datetime'
    },
    series: [{
        name: 'Buy 1',
        data: []
    }, {
        name: 'Sell 1',
        data: []
    }]
}

var cfgB = {
    title: {
        text: 'Spread chart'
    },
    xAxis: {
        type: 'datetime'
    },
    series: [{
        name: 'Spread',
        type: 'column',
        data: []
    }]
}

var cfgC = {
    _isStock: false,
    title: {
        text: 'Pie Chart'
    },
    series: [{
        type: 'pie',
        name: 'one',
        // After specifying the initial data, you don't need to update it with the "add" function; Changing the chart configuration directly will update the series
        data: [
            ["A", 25],
            ["B", 25],
            ["C", 25],
            ["D", 25]
        ]
    }]
}

var cfgD = {
    extension: {
        layout: 'single',
        // The unit value of the specified width, with a total value of 12
        col: 8,
        height: '300px'
    },
    title: {
        text: 'Market Chart'
    },
    xAxis: {
        type: 'datetime'
    },
    series: [{
        name: 'Buy 1',
        data: []
    }, {
        name: 'Sell 1',
        data: []
    }]
}

var cfgE = {
    __isStock: false,
    extension: {
        layout: 'single',
        col: 4,
        height: '300px'
    },
    title: {
        text: 'Pie Chart2'
    },
    series: [{
        type: 'pie',
        name: 'one',
        data: [
            ["A", 25],
            ["B", 25],
            ["C", 25],
            ["D", 25]
        ]
    }]
}
cfgA = {
    "extension" : {
        "layout" : "single",
        "height" : 300,
        "col" : 8
    },
    "title" : {
        "text" : "Market Chart"
    },
    "xAxis" : {
        "type" : "datetime"
    },
    "series" : [{
        "name" : "Buy 1",
        "data" : []
    }, {
        "name" : "Sell 1",
        "data" : []
    }]
}

cfgB = {
    "title" : {
        "text" : "Spread chart"
    },
    "xAxis" : {
        "type" : "datetime"
    },
    "series" : [{
        "name" : "Spread",
        "type" : "column",
        "data" : []
    }]
}

cfgC = {
    "__isStock" : False,
    "title" : {
        "text" : "Pie Chart"
    },
    "series" : [{
        "type" : "pie",
        "name" : "one",
        "data" : [
            ["A", 25],
            ["B", 25],
            ["C", 25],
            ["D", 25]
        ]
    }]
}

cfgD = {
    "extension" : {
        "layout" : "single",
        "col" : 8,
        "height" : "300px"
    },
    "title" : {
        "text" : "Market Chart"
    },
    "series" : [{
        "name" : "Buy 1",
        "data" : []
    }, {
        "name" : "Sell 1",
        "data" : []
    }]
}

cfgE = {
    "__isStock" : False,
    "extension" : {
        "layout" : "single",
        "col" : 4,
        "height" : "300px"
    },
    "title" : {
        "text" : "Pie Chart2"
    },
    "series" : [{
        "type" : "pie",
        "name" : "one",
        "data" : [
            ["A", 25],
            ["B", 25],
            ["C", 25],
            ["D", 25]
        ]
    }]
}
json cfgA = R"({
    "extension" : {
        "layout" : "single",
        "height" : 300,
        "col" : 8
    },
    "title" : {
        "text" : "Market Chart"
    },
    "xAxis" : {
        "type" : "datetime"
    },
    "series" : [{
        "name" : "Buy 1",
        "data" : []
    }, {
        "name" : "Sell 1",
        "data" : []
    }]
})"_json;

json cfgB = R"({
    "title" : {
        "text" : "Spread chart"
    },
    "xAxis" : {
        "type" : "datetime"
    },
    "series" : [{
        "name" : "Spread",
        "type" : "column",
        "data" : []
    }]
})"_json;

json cfgC = R"({
    "__isStock" : false,
    "title" : {
        "text" : "Pie Chart"
    },
    "series" : [{
        "type" : "pie",
        "name" : "one",
        "data" : [
            ["A", 25],
            ["B", 25],
            ["C", 25],
            ["D", 25]
        ]
    }]
})"_json;

json cfgD = R"({
    "extension" : {
        "layout" : "single",
        "col" : 8,
        "height" : "300px"
    },
    "title" : {
        "text" : "Market Chart"
    },
    "series" : [{
        "name" : "Buy 1",
        "data" : []
    }, {
        "name" : "Sell 1",
        "data" : []
    }]
})"_json;

json cfgE = R"({
    "__isStock" : false,
    "extension" : {
        "layout" : "single",
        "col" : 4,
        "height" : "300px"
    },
    "title" : {
        "text" : "Pie Chart2"
    },
    "series" : [{
        "type" : "pie",
        "name" : "one",
        "data" : [
            ["A", 25],
            ["B", 25],
            ["C", 25],
            ["D", 25]
        ]
    }]
})"_json;
-
cfgA.extension.layoutatributJika atribut ini ditetapkan dan nilainya adalah
single , carta tidak akan bertindih (ia tidak akan dipaparkan sebagai label tab) dan akan dipaparkan secara berasingan (penampilan berpayung). -
cfgA.extension.heightatributAtribut ini digunakan untuk menetapkan ketinggian carta.
-
cfgA.extension.colatributAtribut ini digunakan untuk menetapkan lebar carta. Lebar halaman dibahagikan kepada 12 unit secara keseluruhan, dan menetapkan
8 bermakna carta menduduki 8 unit lebar. Jalankan strategi contoh lengkap:
Penampilan kesan objek konfigurasi carta dalam contoh di atas:
)
)
-
Untuk data pada objek konfigurasi carta, mengubah suai konfigurasi carta secara langsung, dan kemudian mengemas kini carta untuk merealisasikan kemas kini data:
Sebagai contoh, dalam
JavaScriptBahagian kod contoh (Contoh Lengkap):cfgC.series[0].data[0][1] = Math.random() * 100 cfgE.series[0].data[0][1] = Math.random() * 100 // "Update" is actually equivalent to resetting the configuration of the chart chart.update([cfgA, cfgB, cfgC, cfgD, cfgE])Mengemas kini data oleh
addkaedah, seperti menambah item kepada carta pai, dan di sini berikutJavaScriptBahagian kod contoh (Contoh Lengkap):// Add a data point to the pie chart; "add" can only update the data points added by the "add" method, the built-in data points cannot be updated later chart.add(3, { name: "ZZ", y: Math.random() * 100 }) -
Contoh penggunaan yang disertakan
ChartfungsiContoh lukisan mudah:
// This chart is an object in JavaScript language. Before using the "Chart" function, we need to declare an object variable of a chart configuration
var chart = {
    // It is marked as a general chart; if you are interested, you can change it to false and run it
    __isStock: true,
    // Zoom tool
    tooltip: {xDateFormat: '%Y-%m-%d %H:%M:%S, %A'},
    // Title
    title : { text : 'Spread analysis chart'},
    // Choose a range
    rangeSelector: {
        buttons:  [{type: 'hour',count: 1, text: '1h'}, {type: 'hour',count: 3, text: '3h'}, {type: 'hour', count: 8, text: '8h'}, {type: 'all',text: 'All'}],
        selected: 0,
        inputEnabled: false
    },
    // The horizontal axis of the coordinate axis is: x axis, and the currently set "Types of" is: time
    xAxis: { type: 'datetime'},
    // The vertical axis of the coordinate axis is: y axis, and the default value is adjusted with the data size
    yAxis : {
        // Title
        title: {text: 'Spread'},
        // Whether to enable the right vertical axis
        opposite: false
    },
    // Data system column; this attribute holds each data system column (line, K-line diagram, label, etc.)
    series : [
        // The index is 0, and the data in the data column is stored in the data array.
        {name : "line1", id : "line 1,buy1Price", data : []},
        // The index is 1, and set dashStyle: 'shortdash', namely: set the dashed line
        {name : "line2", id : "line 2,lastPrice", dashStyle : 'shortdash', data : []}
    ]
}
function main(){
    // Call the "Chart" function to initialize the chart
    var ObjChart = Chart(chart)
    // Empty
    ObjChart.reset()
    while(true){
        // Get the timestamp of this polling, that is, a millisecond timestamp, used to determine the position of the X axis written to the chart
        var nowTime = new Date().getTime()
        // Get market data
        var ticker = _C(exchange.GetTicker)
        // Get "Buy 1" price from the return value of market data
        var buy1Price = ticker.Buy
        // To obtain the last executed price, in order to avoid the overlap of the 2 lines, we add 1
        var lastPrice = ticker.Last + 1
        // Use timestamp as X value and "Buy 1" price as Y value, and pass them into the data sequence of index 0
        ObjChart.add(0, [nowTime, buy1Price])
        // Same as above
        ObjChart.add(1, [nowTime, lastPrice])
        Sleep(2000)
    }
}
import time chart = { "__isStock" : True, "tooltip" : {"xDateFormat" : "%Y-%m-%d %H:%M:%S, %A"}, "title" : {"text" : "Spread analysis chart"}, "rangeSelector" : { "buttons" : [{"type": "count", "count": 1, "text": "1h"}, {"type": "hour", "count": 3, "text": "3h"}, {"type": "hour", "count": 8, "text": "8h"}, {"type": "all", "text": "All"}], "selected": 0, "inputEnabled": False }, "xAxis": {"type": "datetime"}, "yAxis": { "title": {"text": "Spread"}, "opposite": False }, "series": [{ "name": "line1", "id": "line 1,buy1Price", "data": [] }, { "name": "line2", "id": "line 2,lastPrice", "dashStyle": "shortdash", "data": [] }] } def main(): ObjChart = Chart(chart) ObjChart.reset() while True: nowTime = time.time() * 1000 ticker = exchange.GetTicker() buy1Price = ticker["Buy"] lastPrice = ticker["Last"] + 1 ObjChart.add(0, [nowTime, buy1Price]) ObjChart.add(1, [nowTime, lastPrice]) Sleep(2000)void main() { // When write strategies in C++, try not to declare global variables that are not basic types, so the declaration of the chart configuration objects is in the "main" function json chart = R"({ "__isStock" : true, "tooltip" : {"xDateFormat" : "%Y-%m-%d %H:%M:%S, %A"}, "title" : {"text" : "Spread analysis chart"}, "rangeSelector" : { "buttons" : [{"type": "count", "count": 1, "text": "1h"}, {"type": "hour", "count": 3, "text": "3h"}, {"type": "hour", "count": 8, "text": "8h"}, {"type": "all", "text": "All"}], "selected": 0, "inputEnabled": false }, "xAxis": {"type": "datetime"}, "yAxis": { "title": {"text": "Spread"}, "opposite": false }, "series": [{ "name": "line1", "id": "line 1,buy1Price", "data": [] }, { "name": "line2", "id": "line 2,lastPrice", "dashStyle": "shortdash", "data": [] }] })"_json; auto ObjChart = Chart(chart); ObjChart.reset(); while(true) { auto nowTime = Unix() * 1000; auto ticker = exchange.GetTicker(); auto buy1Price = ticker.Buy; auto lastPrice = ticker.Last + 1.0; ObjChart.add(0, {nowTime, buy1Price}); ObjChart.add(1, {nowTime, lastPrice}); Sleep(2000); } }Contoh melukis lengkung trigonometri:
// The object used to initialize the chart
var chart = {
    // Chart title
    title: {text: "line value triggers plotLines value"},
    // The related settings of Y axis
    yAxis: {
        // The horizontal line perpendicular to y axis, used as a trigger line, is an array of structures where multiple trigger lines can be set
        plotLines: [{
            // Trigger line value; set a number, and this line will be displayed in the corresponding numerical position
            value: 0,
            // Set the color of the trigger line
            color: 'red',
            // Width
            width: 2,
            // Labels displayed
            label: {
                // Label text
                text: 'Trigger value',
                // Center label position
                align: 'center'
            }
        }]
    },
    // The related settings of X axis, and here the setting type is the time axis
    xAxis: {type: "datetime"},
    series: [
        {name: "sin", type: "spline", data: []},
        // This is a more important data system column; you can set multiple data system column, according to the array index control
        {name: "cos", type: "spline", data: []}
    ]
}
function main(){
    // Pi
    var pi = 3.1415926535897
    // Variable for recording timestamp
    var time = 0
    // Angle
    var angle = 0
    // Coordinate y value, used to receive sine and cosine values
    var y = 0
    // Call the API to initialize charts with "chart" objects
    var objChart = Chart(chart)
    // When initializing, clear the chart
    objChart.reset()
    // Set the value of the trigger line to 1
    chart.yAxis.plotLines[0].value = 1
    // Loop
    while(true){
        // Get the timestamp of the current moment
        time = new Date().getTime()
        // The angle is increased by 5 degrees every 500ms, and the sine value is calculated
        y = Math.sin(angle * 2 * pi / 360)
        // Write the calculated y value to the data of the corresponding index of the chart; the first parameter of the "add" function is the specified index
        objChart.add(0, [time, y])
        // Calculate the cosine value
        y = Math.cos(angle * 2 * pi / 360)
        objChart.add(1, [time, y])
        // Increase by 5 degrees
        angle += 5
        // Pause for 5 seconds, to avoid drawing too frequently and the data growing too fast
        Sleep(5000)
    }
}
import math import time chart = { "title": {"text": "line value triggers plotLines value"}, "yAxis": { "plotLines": [{ "value": 0, "color": "red", "width": 2, "label": { "text": "Trigger value", "align": "center" } }] }, "xAxis": {"type": "datetime"}, "series": [{"name": "sin", "type": "spline", "data": []}, {"name": "cos", "type": "spline", "data": []}] } def main(): pi = 3.1415926535897 ts = 0 angle = 0 y = 0 objChart = Chart(chart) objChart.reset() chart["yAxis"]["plotLines"][0]["value"] = 1 while True: ts = time.time() * 1000 y = math.sin(angle * 2 * pi / 360) objChart.add(0, [ts, y]) y = math.cos(angle * 2 * pi / 360) objChart.add(1, [ts, y]) angle += 5 Sleep(5000)void main() { json chart = R"({ "title": {"text": "line value triggers plotLines value"}, "yAxis": { "plotLines": [{ "value": 0, "color": "red", "width": 2, "label": { "text": "Trigger value", "align": "center" } }] }, "xAxis": {"type": "datetime"}, "series": [{"name": "sin", "type": "spline", "data": []}, {"name": "cos", "type": "spline", "data": []}] })"_json; auto pi = 3.1415926535897; auto ts = 0; auto angle = 0.0; auto y = 0.0; auto objChart = Chart(chart); objChart.reset(); chart["yAxis"]["plotLines"][0]["value"] = 1; while(true) { ts = Unix() * 1000; y = sin(angle * 2 * pi / 360); objChart.add(0, {ts, y}); y = cos(angle * 2 * pi / 360); objChart.add(1, {ts, y}); angle += 5; Sleep(5000); } }Dalam
cppstrategi,Chartfungsi juga boleh menggunakan rentetan dikodkan untuk mengkonfigurasi carta:void main () { Chart c = Chart(R"EOF({"chart":{"type":"line"},"title":{"text":"Simple chart"},"xAxis":{"title":{"text":"Date"}},"yAxis":{"title":{"text":"Number"}},"series":[{"name":"number","data":[]}]})EOF"); c.reset(); for (size_t i = 0; i < 10; i++) { // For example, int64 of "sprintf" function has different parameters in 32-bit and 64-bit, so it is best to use "toString" to transfer the platform-related types into strings and then pass c.add(0, format("[%s, %d]", toString(Unix() + i).c_str(), rand() % 100)); } })
-
Contoh kompleks carta campuranAlamat Strategi JavaScript
/*backtest
start: 2020-03-11 00:00:00
end: 2020-04-09 23:59:00
period: 1d
exchanges: [{"eid":"Bitfinex","currency":"BTC_USD"}]
*/

var chartCfg = {
    subtitle: {
        text: "subtitle",
    },
    yAxis: [{
        height: "40%",
        lineWidth: 2,
        title: {
            text: 'PnL',
        },
        tickPixelInterval: 20,
        minorGridLineWidth: 1,
        minorTickWidth: 0,
        opposite: true,
        labels: {
            align: "right",
            x: -3,
        }
    }, {
        title: {
            text: 'Profit',
        },
        top: "42%",
        height: "18%",
        offset: 0,
        lineWidth: 2
    }, {
        title: {
            text: 'Vol',
        },
        top: '62%',
        height: '18%',
        offset: 0,
        lineWidth: 2
    }, {
        title: {
            text: 'Asset',
        },
        top: '82%',
        height: '18%',
        offset: 0,
        lineWidth: 2
    }],
    series: [{
        name: 'PnL',
        data: [],
        id: 'primary',
        tooltip: {
            xDateFormat: '%Y-%m-%d %H:%M:%S'
        },
        yAxis: 0
    }, {
        type: 'column',
        lineWidth: 2,
        name: 'Profit',
        data: [],
        yAxis: 1,
    }, {
        type: 'column',
        name: 'Trade',
        data: [],
        yAxis: 2
    }, {
        type: 'area',
        step: true,
        lineWidth: 0,
        name: 'Long',
        data: [],
        yAxis: 2
    }, {
        type: 'area',
        step: true,
        lineWidth: 0,
        name: 'Short',
        data: [],
        yAxis: 2
    }, {
        type: 'line',
        step: true,
        color: '#5b4b00',
        name: 'Asset',
        data: [],
        yAxis: 3
    }, {
        type: 'pie',
        innerSize: '70%',
        name: 'Random',
        data: [],
        center: ['3%', '6%'],
        size: '15%',
        dataLabels: {
            enabled: false
        },
        startAngle: -90,
        endAngle: 90,
    }],
};

function main() {
    let c = Chart(chartCfg);
    let preTicker = null;
    while (true) {
        let t = exchange.GetTicker();

        c.add(0, [t.Time, t.Last]); // PnL
        c.add(1, [t.Time, preTicker ? t.Last - preTicker.Last : 0]); // profit
        let r = Math.random();
        var pos = parseInt(t.Time/86400);
        c.add(2, [t.Time, pos/2]); // Vol
        c.add(3, [t.Time, r > 0.8 ? pos : null]); // Long
        c.add(4, [t.Time, r < 0.8 ? -pos : null]); // Short
        c.add(5, [t.Time, Math.random() * 100]); // Asset
        // update pie
        chartCfg.series[chartCfg.series.length-1].data = [
            ["A", Math.random()*100],
            ["B", Math.random()*100],
         ];
        c.update(chartCfg)
        preTicker = t;
    }
}
'''backtest
start: 2020-03-11 00:00:00
end: 2020-04-09 23:59:00
period: 1d
exchanges: [{"eid":"Bitfinex","currency":"BTC_USD"}]
'''

import random

chartCfg = {
    "subtitle": {
        "text": "subtitle"
    },
    "yAxis": [{
        "height": "40%",
        "lineWidth": 2,
        "title": {
            "text": 'PnL'
        },
        "tickPixelInterval": 20,
        "minorGridLineWidth": 1,
        "minorTickWidth": 0,
        "opposite": True,
        "labels": {
            "align": "right",
            "x": -3
        }
    }, {
        "title": {
            "text": 'Profit'
        },
        "top": "42%",
        "height": "18%",
        "offset": 0,
        "lineWidth": 2
    }, {
        "title": {
            "text": 'Vol'
        },
        "top": '62%',
        "height": '18%',
        "offset": 0,
        "lineWidth": 2
    }, {
        "title": {
            "text": 'Asset'
        },
        "top": '82%',
        "height": '18%',
        "offset": 0,
        "lineWidth": 2
    }],
    "series": [{
        "name": 'PnL',
        "data": [],
        "id": 'primary',
        "tooltip": {
            "xDateFormat": '%Y-%m-%d %H:%M:%S'
        },
        "yAxis": 0
    }, {
        "type": 'column',
        "lineWidth": 2,
        "name": 'Profit',
        "data": [],
        "yAxis": 1
    }, {
        "type": 'column',
        "name": 'Trade',
        "data": [],
        "yAxis": 2
    }, {
        "type": 'area',
        "step": True,
        "lineWidth": 0,
        "name": 'Long',
        "data": [],
        "yAxis": 2
    }, {
        "type": 'area',
        "step": True,
        "lineWidth": 0,
        "name": 'Short',
        "data": [],
        "yAxis": 2
    }, {
        "type": 'line',
        "step": True,
        "color": '#5b4b00',
        "name": 'Asset',
        "data": [],
        "yAxis": 3
    }, {
        "type": 'pie',
        "innerSize": '70%',
        "name": 'Random',
        "data": [],
        "center": ['3%', '6%'],
        "size": '15%',
        "dataLabels": {
            "enabled": False
        },
        "startAngle": -90,
        "endAngle": 90
    }]
}

def main():
    c = Chart(chartCfg)
    preTicker = None
    while True:
        t = exchange.GetTicker()
        c.add(0, [t["Time"], t["Last"]])
        profit = t["Last"] - preTicker["Last"] if preTicker else 0
        c.add(1, [t["Time"], profit])
        r = random.random()
        pos = t["Time"] / 86400
        c.add(2, [t["Time"], pos / 2])
        long = pos if r > 0.8 else None
        c.add(3, [t["Time"], long])
        short = -pos if r < 0.8 else None
        c.add(4, [t["Time"], short])
        c.add(5, [t["Time"], random.random() * 100])

        # update pie
        chartCfg["series"][len(chartCfg["series"]) - 1]["data"] = [
            ["A", random.random() * 100],
            ["B", random.random() * 100]
        ]
        c.update(chartCfg)
        preTicker = t
/*backtest
start: 2020-03-11 00:00:00
end: 2020-04-09 23:59:00
period: 1d
exchanges: [{"eid":"Bitfinex","currency":"BTC_USD"}]
*/

void main() {
    json chartCfg = R"({
        "subtitle": {
            "text": "subtitle"
        },
        "yAxis": [{
            "height": "40%",
            "lineWidth": 2,
            "title": {
                "text": "PnL"
            },
            "tickPixelInterval": 20,
            "minorGridLineWidth": 1,
            "minorTickWidth": 0,
            "opposite": true,
            "labels": {
                "align": "right",
                "x": -3
            }
        }, {
            "title": {
                "text": "Profit"
            },
            "top": "42%",
            "height": "18%",
            "offset": 0,
            "lineWidth": 2
        }, {
            "title": {
                "text": "Vol"
            },
            "top": "62%",
            "height": "18%",
            "offset": 0,
            "lineWidth": 2
        }, {
            "title": {
                "text": "Asset"
            },
            "top": "82%",
            "height": "18%",
            "offset": 0,
            "lineWidth": 2
        }],
        "series": [{
            "name": "PnL",
            "data": [],
            "id": "primary",
            "tooltip": {
                "xDateFormat": "%Y-%m-%d %H:%M:%S"
            },
            "yAxis": 0
        }, {
            "type": "column",
            "lineWidth": 2,
            "name": "Profit",
            "data": [],
            "yAxis": 1
        }, {
            "type": "column",
            "name": "Trade",
            "data": [],
            "yAxis": 2
        }, {
            "type": "area",
            "step": true,
            "lineWidth": 0,
            "name": "Long",
            "data": [],
            "yAxis": 2
        }, {
            "type": "area",
            "step": true,
            "lineWidth": 0,
            "name": "Short",
            "data": [],
            "yAxis": 2
        }, {
            "type": "line",
            "step": true,
            "color": "#5b4b00",
            "name": "Asset",
            "data": [],
            "yAxis": 3
        }, {
            "type": "pie",
            "innerSize": "70%",
            "name": "Random",
            "data": [],
            "center": ["3%", "6%"],
            "size": "15%",
            "dataLabels": {
                "enabled": false
            },
            "startAngle": -90,
            "endAngle": 90
        }]
    })"_json;

    Chart c = Chart(chartCfg);
    Ticker preTicker;
    while(true) {
        auto t = exchange.GetTicker();
        c.add(0, {t.Time, t.Last});
        auto profit = preTicker.Valid ? t.Last - preTicker.Last : 0;
        c.add(1, {t.Time, profit});
        auto r = rand() % 100;
        auto pos = t.Time / 86400.0;
        c.add(2, {t.Time, pos / 2.0});
        auto longPos = r > 0.8 ? pos : NULL;
        c.add(3, {t.Time, longPos});
        auto shortPos = r < 0.8 ? -pos : NULL;
        c.add(4, {t.Time, shortPos});
        c.add(5, {t.Time, rand() % 100});

        // update pie
        json pie = R"([["A", 0], ["B", 0]])"_json;
        pie[0][1] = rand() % 100;
        pie[1][1] = rand() % 100;
        chartCfg["series"][chartCfg["series"].size() - 1]["data"] = pie;

        c.update(chartCfg);
        preTicker = t;
    }
}
Antara carta,piecarta adalah carta tanpa paksi masa, dan konfigurasi carta perlu dikemas kini secara langsung apabila mengemas kini data.c.update(chartCfg)untuk mengemas kini carta seperti berikut:
    // update pie
    chartCfg.series[chartCfg.series.length-1].data = [
        ["A", Math.random()*100],
        ["B", Math.random()*100],
    ];
    c.update(chartCfg)
    # update pie
    chartCfg["series"][len(chartCfg["series"]) - 1]["data"] = [
        ["A", random.random() * 100],
        ["B", random.random() * 100]
    ]
    c.update(chartCfg)
    // update pie
    json pie = R"([["A", 0], ["B", 0]])"_json;
    pie[0][1] = rand() % 100;
    pie[1][1] = rand() % 100;
    chartCfg["series"][chartCfg["series"].size() - 1]["data"] = pie;
    c.update(chartCfg);
Hasil Operasi: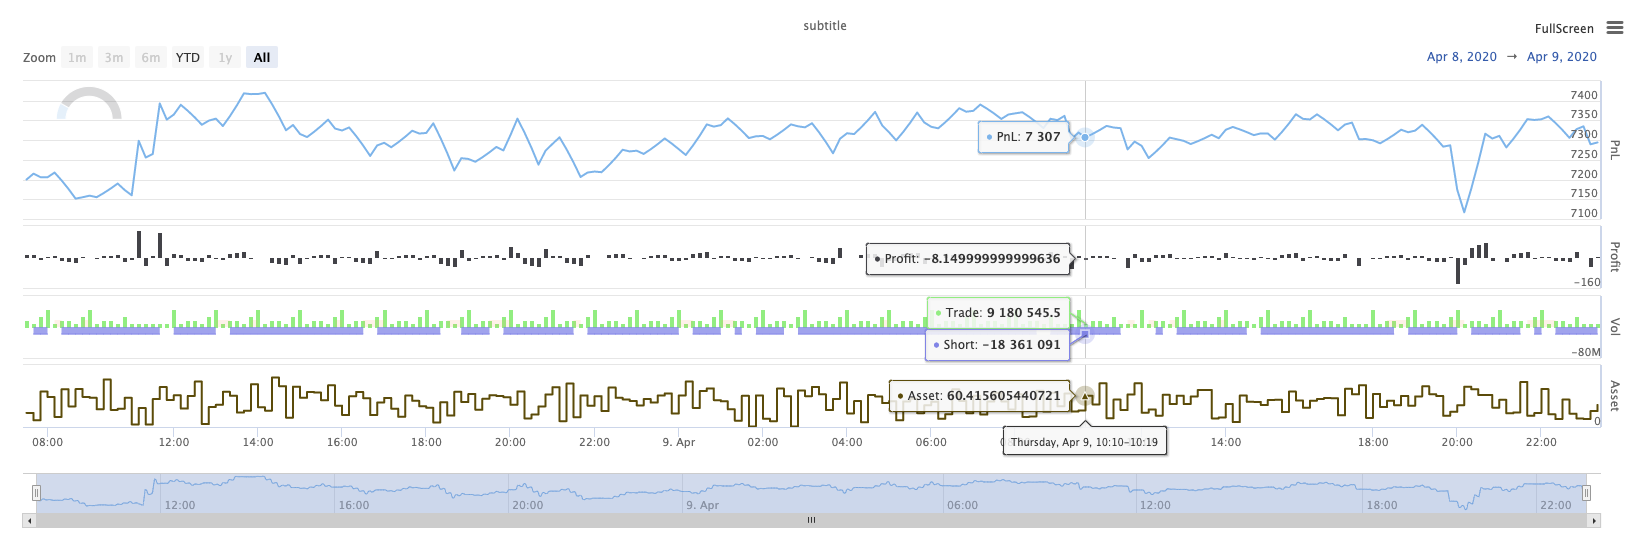
KLineChart ((...)
KLineChart(chartCfg), fungsi ini digunakan untuk menggunakan kaedah lukisan yang serupa dengan bahasa Pine untuk lukisan tersuai apabila strategi sedang berjalan.KLineChart()kaedah atau salah satu daripadaChart() methods.
Kod rujukan:
function main() {
    // Call the KLineChart function to create a chart control object c
    let c = KLineChart({
        overlay: true
    })

    // Use the spot exchange object test to obtain K-line data. If you use the futures exchange object test, you need to set up the contract first.
    let bars = exchange.GetRecords()
    if (!bars) {
        return
    }

    bars.forEach(function(bar, index) {
        c.begin(bar)
        c.barcolor(bar.Close > bar.Open ? 'rgba(255, 0, 0, 0.2)' : 'rgba(0, 0, 0, 0.2)')
        if (bar.Close > bar.Open) {
            c.bgcolor('rgba(0, 255, 0, 0.5)')
        }
        let h = c.plot(bar.High, 'high')
        let l = c.plot(bar.Low, 'low')

        c.fill(h, l, {
            color: bar.Close > bar.Open ? 'rgba(255, 0, 0, 0.2)' : 'rgba(255, 0, 0, 0.2)'
        })
        c.hline(bar.High)
        c.plotarrow(bar.Close - bar.Open)
        c.plotshape(bar.Low, {
            style: 'diamond'
        })
        c.plotchar(bar.Close, {
            char: 'X'
        })
        c.plotcandle(bar.Open*0.9, bar.High*0.9, bar.Low*0.9, bar.Close*0.9)
        if (bar.Close > bar.Open) {
            // long/short/closelong/closeshort
            c.signal("long", bar.High, 1.5)
        } else if (bar.Close < bar.Open) {
            c.signal("closelong", bar.Low, 1.5)
        }
        c.close()
    })
}
def main():
    # Call the KLineChart function to create a chart control object c
    c = KLineChart({
        "overlay": True
    })

    # Use the spot exchange object test to obtain K-line data. If you use the futures exchange object test, you need to set up the contract first.
    bars = exchange.GetRecords()
    if not bars:
        return

    for bar in bars:
        c.begin(bar)
        c.barcolor('rgba(255, 0, 0, 0.2)' if bar.Close > bar.Open else 'rgba(0, 0, 0, 0.2)')
        if bar.Close > bar.Open:
            c.bgcolor('rgba(0, 255, 0, 0.5)')

        h = c.plot(bar.High, 'high')
        l = c.plot(bar.Low, 'low')

        c.fill(h, l, 'rgba(255, 0, 0, 0.2)' if bar.Close > bar.Open else 'rgba(255, 0, 0, 0.2)')
        c.hline(bar.High)
        c.plotarrow(bar.Close - bar.Open)
        c.plotshape(bar.Low, style = 'diamond')
        c.plotchar(bar.Close, char = 'X')
        c.plotcandle(bar.Open*0.9, bar.High*0.9, bar.Low*0.9, bar.Close*0.9)
        if bar.Close > bar.Open:
            # long/short/closelong/closeshort
            c.signal("long", bar.High, 1.5)
        elif bar.Close < bar.Open:
            c.signal("closelong", bar.Low, 1.5)

        c.close()
// Not supported currently
Jika mesti ada objek kawalan carta untuk menarik di kawasan lukisan tersuai strategi, gunakan fungsiKLineChartuntuk mencipta objek ini. parameterKLineChartfungsi adalah struktur konfigurasi carta, struktur carta yang digunakan dalam kod rujukan adalah sangat mudah{overlay: true}). Struktur konfigurasi carta ini hanya menetapkan kandungan lukisan untuk output pada carta utama.overlayditetapkan kepadafalseJika anda perlu menentukan fungsi lukisan untuk menarik pada carta utama, anda juga boleh menentukan parameteroverlaysebagaitruedalam panggilan fungsi tertentu.
Operasi lukisan dijalankan dengan melintasi data K-garis. Operasi lukisan mesti bermula denganc.begin(bar)panggilan fungsi dan berakhir denganc.close()panggilan fungsi. fungsi antara muka lukisan bahasa Pine yang disokong dalam operasi lukisan adalah:
-
Barcolor: Set K-line warna
barcolor ((warna, offset, boleh diedit, show_last, tajuk, paparan)
c.barcolor(bar.Close > bar.Open ? 'rgba(255, 0, 0, 0.2)' : 'rgba(0, 0, 0, 0.2)') // Use the example illustrated in the reference code in this example, without giving unnecessary detailsc.barcolor('rgba(255, 0, 0, 0.2)' if bar.Close > bar.Open else 'rgba(0, 0, 0, 0.2)')displayparameter pilihan:tidak ada , semua
-
bgcolor: Isi latar belakang K-garis dengan warna yang ditentukan
bgcolor ((warna, offset, boleh diedit, show_last, tajuk, paparan, overlay)
c.bgcolor('rgba(0, 255, 0, 0.5)')c.bgcolor('rgba(0, 255, 0, 0.5)')displayParameter pilihan:tidak ada , semua
-
plot: Gambarkan satu siri data pada carta
plot ((seri, tajuk, warna, lebar baris, gaya, trackprice, histbase, offset, join, boleh diedit, show_last, display)
c.plot(bar.High, 'high')h = c.plot(bar.High, 'high')styleparameter pilihan:stepline_diamond , stepline , cross , areaabr , area , circles , columns , histogram , linebr , line displayparameter pilihan:tidak ada , semua
-
isi: Isi latar belakang antara dua lukisan atau garis dengan warna yang disediakan
isi ((haline1, hline2, warna, tajuk, boleh diedit, mengisi kekosongan, paparan)
let h = c.plot(bar.High, 'high')
let l = c.plot(bar.Low, 'low')

c.fill(h, l, {color: bar.Close > bar.Open ? 'rgba(255, 0, 0, 0.2)' : 'rgba(255, 0, 0, 0.2)'})
h = c.plot(bar.High, 'high') l = c.plot(bar.Low, 'low') c.fill(h, l, {"color": 'rgba(255, 0, 0, 0.2)' if bar.Close > bar.Open else 'rgba(255, 0, 0, 0.2)'})displayparameter pilihan:tidak ada , semua
Sejak
JavaScriptbahasa tidak boleh menentukan parameter masuk mengikut nama parameter formal fungsi, untuk menyelesaikan masalah ini, a{key: value}struktur boleh digunakan untuk menentukan parameter yang dilewatkan dalam nama parameter rasmi tertentu, contohnya dalam kod rujukan, penggunaan{color: bar.Close > bar.Open ? 'rgba(255, 0, 0, 0.2)' : 'rgba(255, 0, 0, 0.2)'}untuk menentukancolorparameterfillJika anda perlu menentukan parameter dengan beberapa nama parameter berturut-turut, anda boleh menggunakan{key1: value1, key2: value2, key3: value3}. Sebagai contoh, dalam contoh ini, menambah parameter yang menentukantitle:{color: bar.Close > bar.Open ? 'rgba(255, 0, 0, 0.2)' : 'rgba(255, 0, 0, 0.2)', title: 'fill'}.Untuk nilai warna, anda boleh menggunakan
'rgba(255, 0, 0, 0.2)'kaedah untuk menetapkan, atau menggunakan'#FF0000'kaedah untuk ditetapkan. -
hline: Membuat garis mendatar pada tahap harga tetap yang diberikan
hline ((harga, tajuk, warna, gaya baris, lebar baris, boleh diedit, paparan)
c.hline(bar.High)c.hline(bar.High)linestyleParameter pilihan:dashed , dotted , solid displayparameter pilihan:tidak ada , semua
-
Plotarrow: Gambar anak panah ke atas dan ke bawah pada carta
Plotarrow ((seri, tajuk, colorup, colorordown, offset, minheight, maxheight, boleh diedit, show_last, display)
c.plotarrow(bar.Close - bar.Open)c.plotarrow(bar.Close - bar.Open)displayparameter pilihan:tidak ada , semua
-
Plotshape: Lukis bentuk visual pada carta
plotshape ((seri, tajuk, gaya, lokasi, warna, offset, teks, textcolor, boleh diedit, saiz, show_last, paparan)
c.plotshape(bar.Low, {style: 'diamond'})c.plotshape(bar.Low, style = 'diamond')-
styleparameter pilihan:diamond , square , label_down , label_up , arrow_down , arrow_up , circle , flag , triangle_down , triangle_up , cross , xcross -
locationparameter pilihan:bar atas , bar bawah , top , bottom , absolute -
sizeparameter pilihan:10px , 14px , 20px , 40px , 80px , berbanding dengan size.tiny,size.small,size.normal,size.large,size.hugedalam bahasa Pinesize.autoadalahsize.small. -
displayparameter pilihan:tidak ada , semua
-
-
plotchar: Lukis bentuk yang kelihatan pada carta dengan menggunakan sebarang watak Unicode yang diberikan
plotchar ((seri, tajuk, char, lokasi, warna, offset, teks, warna teks, boleh diedit, saiz, show_last, paparan)
c.plotchar(bar.Close, {char: 'X'})c.plotchar(bar.Close, char = 'X')-
locationparameter pilihan:bar atas , bar bawah , top , bottom , absolute -
sizeparameter pilihan:10px , 14px , 20px , 40px , 80px , berbanding dengan size.tiny,size.small,size.normal,size.large,size.hugedalam bahasa Pinesize.autoadalahsize.small. -
displayparameter pilihan:tidak ada , semua
-
-
plotcandle: Lukis carta K-garis pada carta
plotcandle ((buka, tinggi, rendah, dekat, tajuk, warna, wickcolor, boleh diedit, show_last, bordercolor, paparan)
c.plotcandle(bar.Open*0.9, bar.High*0.9, bar.Low*0.9, bar.Close*0.9)c.plotcandle(bar.Open*0.9, bar.High*0.9, bar.Low*0.9, bar.Close*0.9)displayParameter pilihan:tidak ada , semua
-
isyarat: Fungsi yang tidak tersedia dalam bahasa Pine digunakan di sini untuk menarik isyarat membeli dan menjual
isyarat ((arah, harga, qty, id)
c.signal("long", bar.High, 1.5)c.signal("long", bar.High, 1.5)Parameter input
"long"menunjukkan arah urus niaga, pilihan"long","closelong","short","closeshort". Parameter masukbar.Highadalah kedudukan paksi Y isyarat penanda. parameter input1.5mewakili bilangan perdagangan isyarat. Parameter keempat boleh diteruskan untuk menggantikan kandungan teks yang ditarik secara lalai. Teks lalai penanda isyarat yang ditarik adalah arah perdagangan, contohnya:"closelong".
Untuk beberapa warna, gaya dan tetapan lain yang digunakan dalam panggilan fungsi di atas, sila rujukArtikel khas mengenai lukisan dengan fungsi KLineChart
LogReset()
LogReset()log yang digunakan untuk membersihkan log. anda boleh lulus dalam parameter bilangan bulat untuk menentukan bilangan log baru-baru ini untuk mengekalkan, dan membersihkan baki log. log permulaan dikira setiap kali ia dimulakan, jadi jika tiada parameter yang diteruskan, dan tidak ada log output pada permulaan strategi, log tidak akan dipaparkan sama sekali, menunggu log docker untuk kembali (bukan keadaan yang tidak normal). fungsi ini tidak mempunyai nilai balik.
function main() {
    // Mainta