Pemula, periksa Membawa anda ke Perdagangan Kuantitatif Cryptocurrency (5)
Penulis:Ninabadass, Dicipta: 2022-04-18 17:20:53, Dikemas kini: 2022-04-18 17:30:27Pemula, periksa Membawa anda ke Perdagangan Kuantitatif Cryptocurrency (5)
Dalam artikel sebelumnya, kami menerangkan analisis logik perdagangan strategi grid mudah.
-
Analisis Logik Dagangan Seperti yang kita sebutkan dalam artikel sebelumnya, selagi anda melintasi setiap garis grid grid dan menilai bahawa harga semasa melintasi garis grid ke atas atau ke bawah, tindakan dagangan boleh dicetuskan.
Rincian pertama yang perlu kita pertimbangkan ialah reka bentuk grid tak terhingga.
createNetuntuk menjana struktur data grid awal bersama-sama? fungsi ini menjana struktur data grid dengan bilangan garis grid yang terhingga. jadi bagaimana jika, apabila strategi berjalan, harga melampaui sempadan struktur data grid ini (di luar garis grid atas di mana harga adalah yang tertinggi, dan garis grid bawah di mana harga adalah yang terendah)? Jadi pertama kita perlu menambah mekanisme lanjutan kepada struktur data grid.Mula menulis fungsi utama strategi, dan fungsi utama adalah kod di mana strategi mula dilaksanakan.
var diff = 50                                 // global variable, the grid interval, can be designed as parameter; for an easy explanation, we write it in an infinite loop
function main() {
    // After the bot starts running, execute the strategy code from here
    var ticker = _C(exchange.GetTicker)       // obtain the latest ticker data in the market; for the ticker data structure, you can refer to FMZ API documentation: https://www.fmz.com/api#ticker
    var net = createNet(ticker.Last, diff)    // the function to initially construct the grid data structure we designed in the previous article; here we construct a grid data structure net

    while (true) {                            // then, the program logic enters the while infinite loop, and the strategy will repeatedly execute the code within the {} symbol from here
        ticker = _C(exchange.GetTicker)       // the first line of the infinite loop code gets the latest market quote data, and updates it to the variable ticker
        // check the grid range
        while (ticker.Last >= net[net.length - 1].price) {
            net.push({
                buy : false,
                sell : false,
                price : net[net.length - 1].price + diff,
            })
        }
        while (ticker.Last <= net[0].price) {
            var price = net[0].price - diff
            if (price <= 0) {
                break
            }
            net.unshift({
                buy : false,
                sell : false,
                price : price,
            })
        }

        // the code is not completed...
    }
}
Ia adalah kod yang menjadikan struktur data grid boleh diperluaskan (dipetik dari kod di atas):
      // check the grid range
      while (ticker.Last >= net[net.length - 1].price) {   // if the price exceeds the grid line with the highest price in the grid,
          net.push({                                       // add a new grid line after the grid line with the highest price in the grid
              buy : false,                                 // initialize the sell mark
              sell : false,                                // initialize the buy mark
              price : net[net.length - 1].price + diff,    // add a grid interval on the basis of the previous highest price
          })
      }
      while (ticker.Last <= net[0].price) {                // if the price is lower than the grid line with the lowest price in the grid,
          var price = net[0].price - diff                  // distinguished from adding upwards, you should notice the price of the newly added grid line downwards cannot be less than or equal to 0, so you need to judge here
          if (price <= 0) {                                // do not add when the price is less than or equal to 0, and break the loop
              break
          }
          net.unshift({                                    // add a new grid line before the grid line with the lowest price in the grid
              buy : false,
              sell : false,
              price : price,
          })
      }
Seterusnya, kita perlu mempertimbangkan bagaimana untuk melaksanakan pencetus perdagangan.
var diff = 50
var amount = 0.002       // add a global variable, which can also be designed as a parameter; for easy explanation, we can write it in an infinite loop
                         // the parameter controls the trading amount on the grid line each time the trading is triggered
function main() {
    var ticker = _C(exchange.GetTicker)
    var net = createNet(ticker.Last, diff)
    var preTicker = ticker       // before the start of the main (infinite) loop, set a variable, to record the market quotes of last time
    while (true) {
        ticker = _C(exchange.GetTicker)
        // check the grid range
        while (ticker.Last >= net[net.length - 1].price) {
            net.push({
                buy : false,
                sell : false,
                price : net[net.length - 1].price + diff,
            })
        }
        while (ticker.Last <= net[0].price) {
            var price = net[0].price - diff
            if (price <= 0) {
                break
            }
            net.unshift({
                buy : false,
                sell : false,
                price : price,
            })
        }

        // index the grid
        for (var i = 0 ; i < net.length ; i++) {     // traverse all grid lines in the grid data structure
            var p = net[i]
            if (preTicker.Last < p.price && ticker.Last > p.price) {         // upcross, and sell; when the current node has been traded, no matter SELL or BUY, no more trade
                if (i != 0) {
                    var downP = net[i - 1]
                    if (downP.buy) {
                        exchange.Sell(-1, amount, ticker)
                        downP.buy = false
                        p.sell = false
                        continue
                    }
                }
                if (!p.sell && !p.buy) {
                    exchange.Sell(-1, amount, ticker)
                    p.sell = true
                }
            } else if (preTicker.Last > p.price && ticker.Last < p.price) {  // downcross, and buy
                if (i != net.length - 1) {
                    var upP = net[i + 1]
                    if (upP.sell) {
                        exchange.Buy(-1, amount * ticker.Last, ticker)
                        upP.sell = false
                        p.buy = false
                        continue
                    }
                }
                if (!p.buy && !p.sell) {
                    exchange.Buy(-1, amount * ticker.Last, ticker)
                    p.buy = true
                }
            }
        }
        preTicker = ticker    // record the current market quotes in preTicker, which will be used as the "last" market quote data to compare with the new one in next loop, to judge upcross and downcross
        Sleep(500)
    }
}
Anda boleh lihat:
- keadaan melintasi garisan grid:
preTicker.Last < p.price && ticker.Last > p.price - keadaan melintasi garis grid:
preTicker.Last > p.price && ticker.Last < p.price
Inilah yang dibincangkan dalam artikel yang lalu:
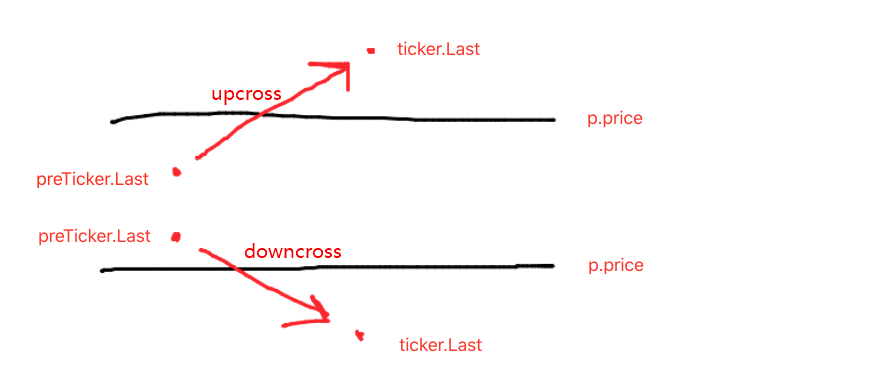
Menghakimi upcross atau downcross hanyalah langkah pertama untuk menentukan sama ada untuk pesanan dan perdagangan, dan tanda dalam data garis grid juga perlu dinilai.
Jika ia adalah upcross, maka menilai sama ada harga lebih rendah daripada garis grid semasa, serta tanda beli pada garis grid terkini; jika nilai tanda beli adalah benar, itu bermakna garis grid terakhir yang dilaksanakan membeli, dan menetapkan semula tanda beli garis grid terakhir sebagai salah, dan menetapkan semula tanda jual garis grid semasa sebagai salah.
Selepas menilai syarat-syarat yang disebutkan sekarang, jika mereka tidak dicetuskan, terus menilai. jika tanda beli dan tanda jual garis grid semasa adalah salah, itu bermakna garis grid semasa boleh berdagang; kerana ia adalah upcross, di sini kita melaksanakan operasi jual, dan tanda tanda jual garis grid sebagai benar selepas pelaksanaan.
Logik memproses downcross adalah sama. (pemula boleh fikirkan ini sendiri.)
- keadaan melintasi garisan grid:
Ujian Kembali Strategi Lengkap
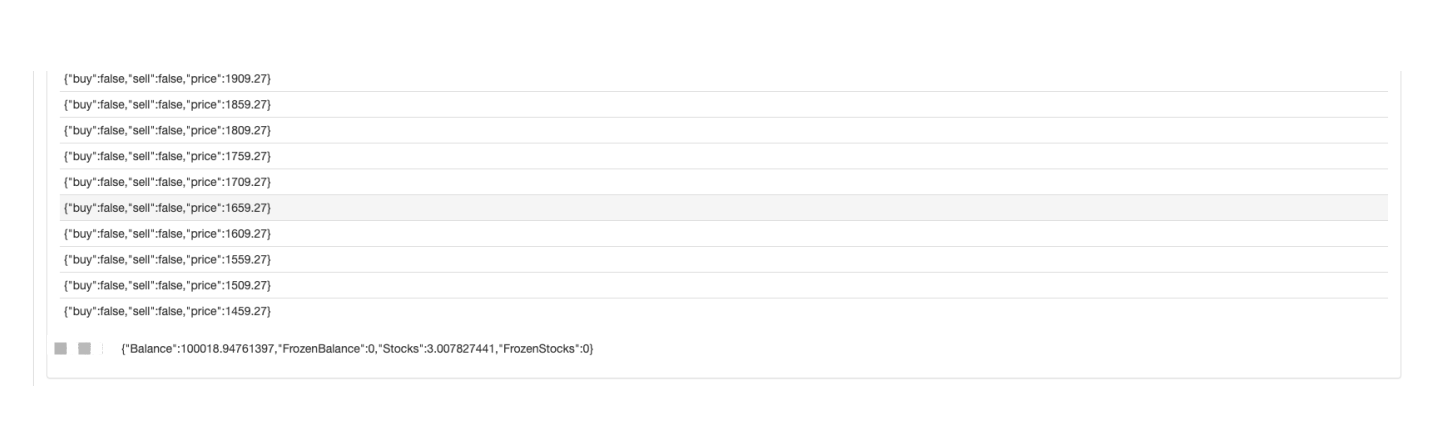
Untuk melihat beberapa data semasa backtest, fungsishowTblditulis untuk memaparkan data.
function showTbl(arr) {
    var tbl = {
        type : "table",
        title : "grid",
        cols : ["grid information"],
        rows : []
    }
    var arrReverse = arr.slice(0).reverse()
    _.each(arrReverse, function(ele) {
        var color = ""
        if (ele.buy) {
            color = "#FF0000"
        } else if (ele.sell) {
            color = "#00FF00"
        }
        tbl.rows.push([JSON.stringify(ele) + color])
    })
    LogStatus(_D(), "\n`" + JSON.stringify(tbl) + "`", "\n account information:", exchange.GetAccount())
}
Kod strategi lengkap:
/*backtest
start: 2021-04-01 22:00:00
end: 2021-05-22 00:00:00
period: 1d
basePeriod: 1m
exchanges: [{"eid":"OKEX","currency":"ETH_USDT","balance":100000}]
*/

var diff = 50
var amount = 0.002
function createNet(begin, diff) {
    var oneSideNums = 10
    var up = []
    var down = []
    for (var i = 0 ; i < oneSideNums ; i++) {
        var upObj = {
            buy : false,
            sell : false,
            price : begin + diff / 2 + i * diff,
        }
        up.push(upObj)

        var j = (oneSideNums - 1) - i
        var downObj = {
            buy : false,
            sell : false,
            price : begin - diff / 2 - j * diff,
        }
        if (downObj.price <= 0) {  // the price cannot be less than or equal to 0
            continue
        }
        down.push(downObj)
    }

    return down.concat(up)
}

function showTbl(arr) {
    var tbl = {
        type : "table",
        title : "grid",
        cols : ["grid information"],
        rows : []
    }
    var arrReverse = arr.slice(0).reverse()
    _.each(arrReverse, function(ele) {
        var color = ""
        if (ele.buy) {
            color = "#FF0000"
        } else if (ele.sell) {
            color = "#00FF00"
        }
        tbl.rows.push([JSON.stringify(ele) + color])
    })
    LogStatus(_D(), "\n`" + JSON.stringify(tbl) + "`", "\n account information:", exchange.GetAccount())
}

function main() {
    var ticker = _C(exchange.GetTicker)
    var net = createNet(ticker.Last, diff)
    var preTicker = ticker
    while (true) {
        ticker = _C(exchange.GetTicker)
        // check the grid range
        while (ticker.Last >= net[net.length - 1].price) {
            net.push({
                buy : false,
                sell : false,
                price : net[net.length - 1].price + diff,
            })
        }
        while (ticker.Last <= net[0].price) {
            var price = net[0].price - diff
            if (price <= 0) {
                break
            }
            net.unshift({
                buy : false,
                sell : false,
                price : price,
            })
        }

        // index grid
        for (var i = 0 ; i < net.length ; i++) {
            var p = net[i]
            if (preTicker.Last < p.price && ticker.Last > p.price) {         // upcross, and sell; when the current node has been traded, no matter SELL or BUY, no more trade
                if (i != 0) {
                    var downP = net[i - 1]
                    if (downP.buy) {
                        exchange.Sell(-1, amount, ticker)
                        downP.buy = false
                        p.sell = false
                        continue
                    }
                }
                if (!p.sell && !p.buy) {
                    exchange.Sell(-1, amount, ticker)
                    p.sell = true
                }
            } else if (preTicker.Last > p.price && ticker.Last < p.price) {  // downcross, and buy
                if (i != net.length - 1) {
                    var upP = net[i + 1]
                    if (upP.sell) {
                        exchange.Buy(-1, amount * ticker.Last, ticker)
                        upP.sell = false
                        p.buy = false
                        continue
                    }
                }
                if (!p.buy && !p.sell) {
                    exchange.Buy(-1, amount * ticker.Last, ticker)
                    p.buy = true
                }
            }
        }

        showTbl(net)
        preTicker = ticker
        Sleep(500)
    }
}
Strategi Backtest:
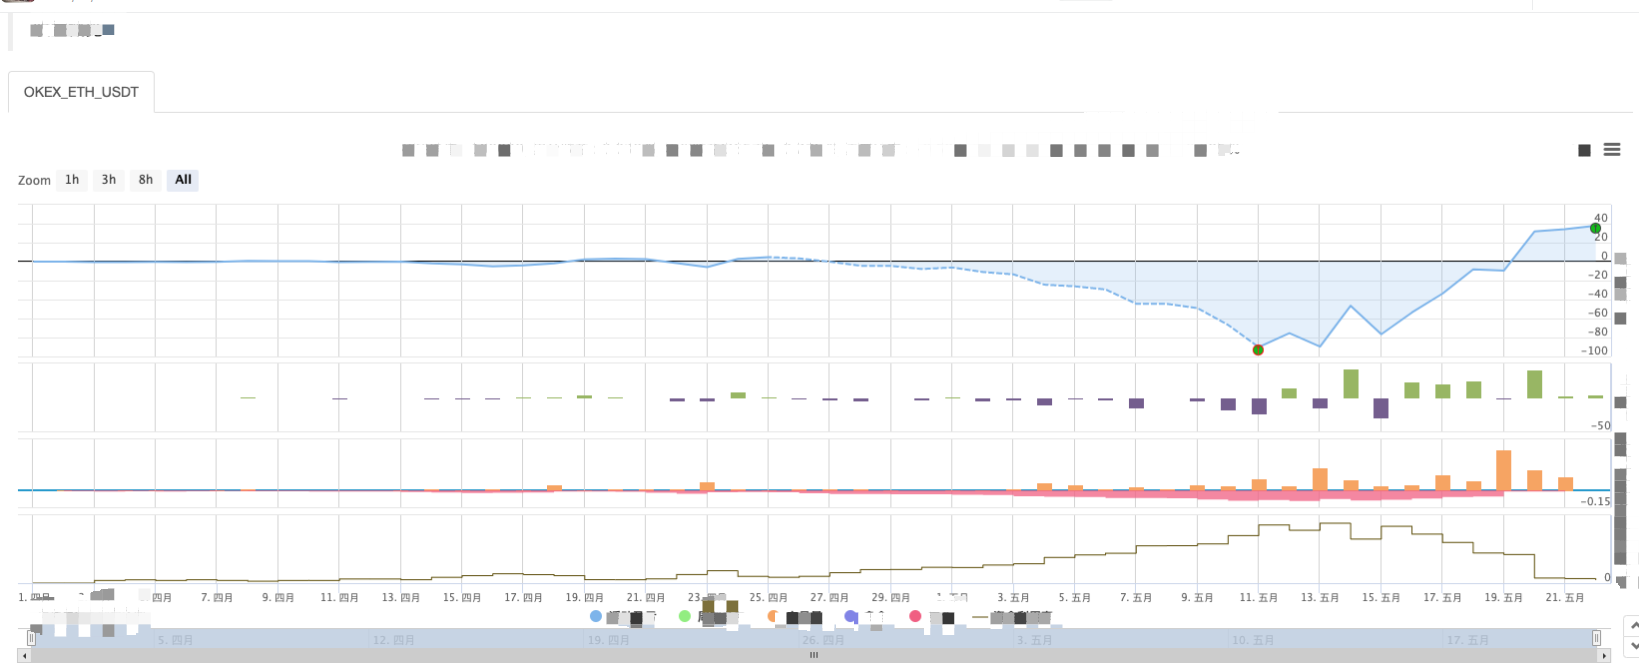
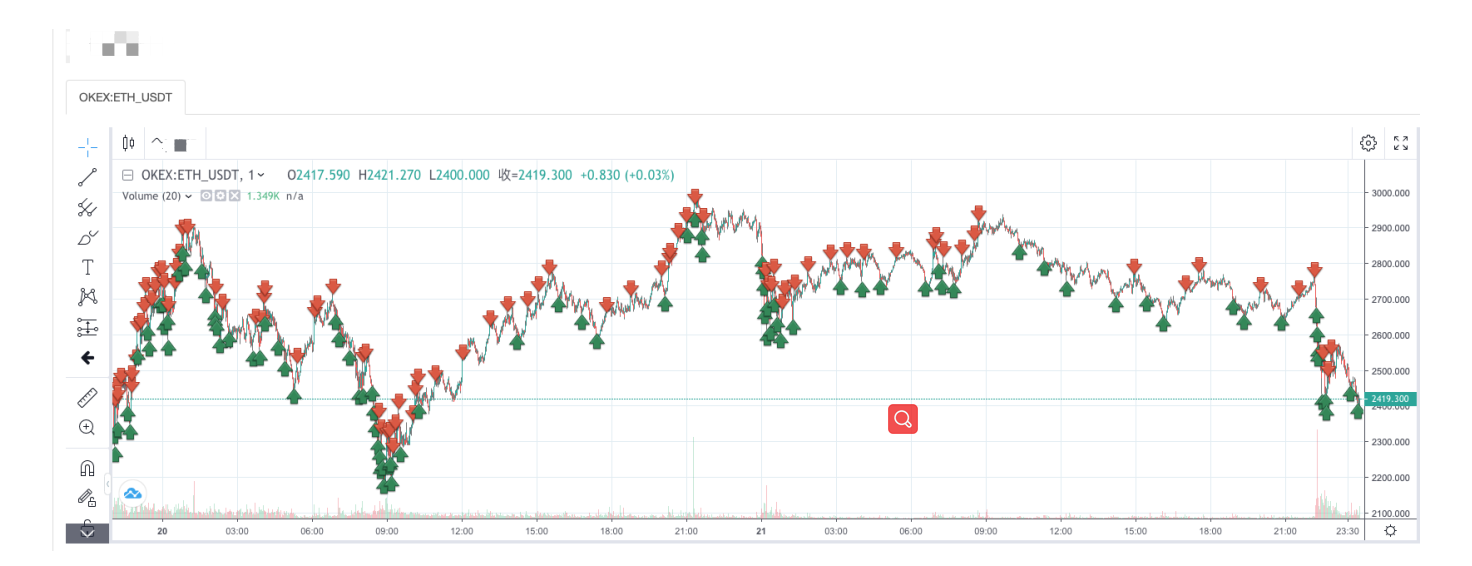
Anda boleh melihat ciri-ciri strategi grid. apabila ada pasaran yang sedang trend, akan ada kerugian terapung yang besar, dan pulangan akan bangkit dalam pasaran yang tidak menentu. Oleh itu, strategi grid tidak bebas daripada risiko. Strategi spot masih boleh bertahan untuk membuatnya, sementara strategi grid kontrak niaga hadapan lebih berisiko dan perlu menetapkan parameter grid secara konservatif.
- Bahasa my menulis di sini untuk mendapatkan isyarat hanya untuk mencetak dan mengeluarkan sekali.
- Perlindungan Delta Dinamik Pilihan Deribit
- Gunakan SQLite untuk membina pangkalan data kuant FMZ
- Pemula, periksa
Membawa anda ke Perdagangan Kuantitatif Cryptocurrency (8) - Pemula, periksa
Membawa anda ke Perdagangan Kuantitatif Cryptocurrency (7) - Pemula, periksa
Membawa anda ke Perdagangan Kuantitatif Cryptocurrency (6) - Pemula, periksa
Membawa anda ke Perdagangan Kuantitatif Cryptocurrency (3) - Pemula, periksa
Membawa anda ke Perdagangan Kuantitatif Cryptocurrency (2) - Masa pencipta saya tidak tepat.
- Berikan idea untuk strategi penulisan yang hebat!
- Pemula, periksa
Membawa anda ke Perdagangan Kuantitatif Cryptocurrency (4) - Masa penciptaan pesanan dan masa penyelesaian pesanan
- Rangkaian strategi membeli-belah Martin
- Bagi anda yang faham bahasa saya, tolong saya baca apa maksud kod ini: _TR:=MAX ((MAX (((HIGH-LOW),ABS ((REF ((CLOSE,1)-HIGH)),ABS ((REF ((CLOSE,1)-LOW));
- Soalan kesalahan rakaman sebenar
- Pemula, periksa
Membawa anda ke Perdagangan Kuantitatif Cryptocurrency (1) - Bolehkah anda menambah sokongan untuk Typescript?
- Strategi Hedge Spot Cryptocurrency (2)
- Strategi Hedge Spot Cryptocurrency (1)
- Dalam API Bitget, masalah berlaku apabila transaksi yang disertakan pada ADA, AVAX, AXS, BCH, DOT, EOS, ETC, FIL, LINK, LTC, LUNA, MATIC, SOL, XRP diletakkan.