Strategi Penyu Bollinger Band Pelbagai Peringkat MACD

Gambaran keseluruhan
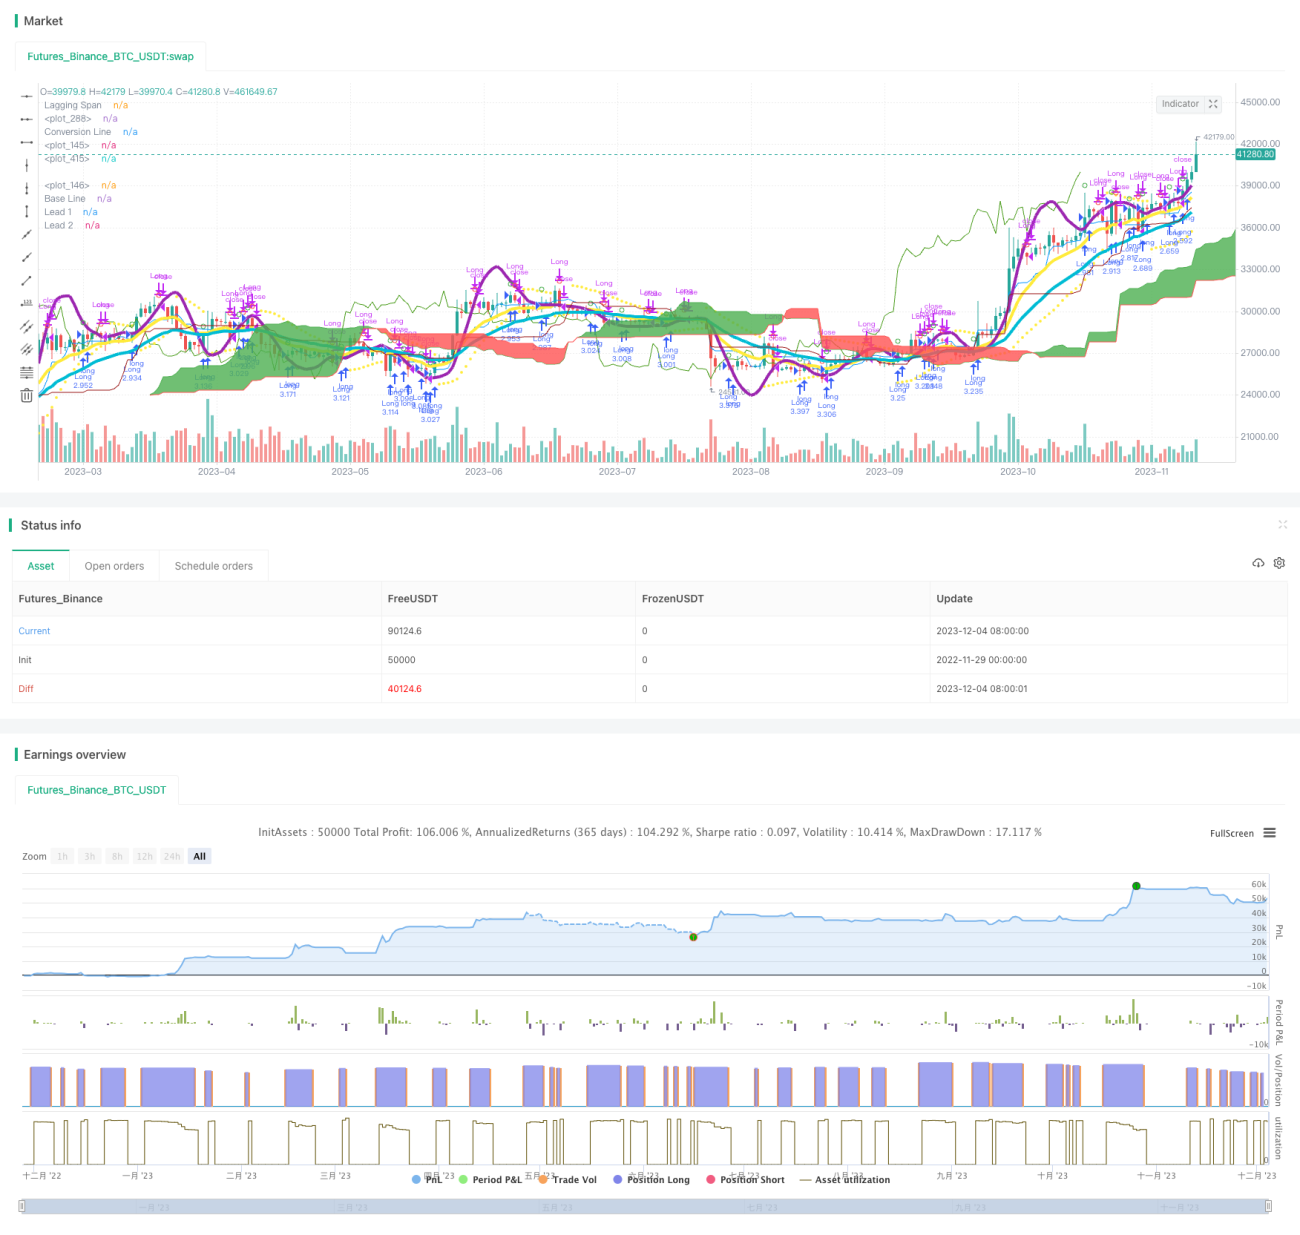
Strategi ini menggabungkan MACD dengan Brinks Channel, ditambah dengan Peraturan Dagangan Seagull untuk membentuk sistem penilaian bertingkat, yang bertujuan untuk meningkatkan keuntungan strategi dan mengawal risiko.
Prinsip Strategi
-
Menggunakan indikator MACD untuk menilai trend yang berpotensi, bersama-sama dengan laluan Burin untuk menentukan kenaikan dan penurunan, untuk memberi isyarat perdagangan.
-
N nilai terobosan dalam undang-undang perdagangan laut membentuk mekanisme pengesanan kerugian, mengunci keuntungan lebih lanjut, mengawal risiko.
-
Menggunakan ciri-ciri laluan Brin, menyesuaikan peratusan pembukaan kedudukan pertama, kemudiannya menggunakan prinsip penambahan kedudukan undang-undang perdagangan pantai, melaksanakan pembukaan dan hentian kedudukan yang berbeza, dan mengembangkan ruang keuntungan.
Analisis kelebihan
-
Indeks MACD mempunyai keupayaan penilaian trend yang lebih kuat, dan Indeks Saluran Boolean berkesan menilai keadaan overbought dan oversold, yang kedua-duanya menggabungkan sistem penilaian untuk meningkatkan ketepatan.
-
Mekanisme tracking stop loss dalam undang-undang dagangan laut boleh mengunci keuntungan dengan lebih baik dan mengelakkan penarikan balik yang terlalu dalam.
-
Peningkatan margin bertepatan dengan pengesanan terhenti, dengan syarat risiko dikendalikan, ruang untuk memperluaskan.
Analisis risiko
-
Parameter laluan Brin tidak ditetapkan dengan betul, mungkin kehilangan peluang atau menambah isyarat yang salah.
-
Tetapan nilai N dalam peraturan dagangan pantai perlu berhati-hati, terlalu besar atau terlalu kecil boleh menjejaskan prestasi strategi.
-
"Saya tidak tahu apa-apa mengenai apa yang berlaku di Malaysia, tetapi saya tidak tahu apa yang berlaku di Malaysia", katanya.
Arah pengoptimuman
-
Menyesuaikan parameter laluan Brin, mengoptimumkan lebar laluan, meningkatkan peluang keuntungan.
-
Uji pelbagai N-nilai untuk mencari kedudukan hentian yang optimum.
-
Mengoptimumkan kadar dan frekuensi kenaikan, mengurangkan risiko dengan jaminan keuntungan.
ringkaskan
Strategi ini menggunakan tiga alat kuantitatif utama, iaitu MACD, Brinch Channel dan Peraturan Perdagangan Pantai, untuk mencari kecocokan terbaik dengan menyesuaikan parameter, membentuk sistem penunjuk penilaian. Dengan itu, kelebihan setiap alat dapat dimanfaatkan sepenuhnya, saling melengkapi, dan bersama-sama meningkatkan prestasi sistem.
/*backtest
start: 2022-11-29 00:00:00
end: 2023-12-05 00:00:00
period: 1d
basePeriod: 1h
exchanges: [{"eid":"Futures_Binance","currency":"BTC_USDT"}]
*/

//@version=3
strategy("Tagmaniak MACD Algo", shorttitle="Tagmaniak MACD Algo", overlay=true, pyramiding = 0, default_qty_type = strategy.percent_of_equity, default_qty_value = 100, initial_capital=7000, calc_on_order_fills = true, commission_type=strategy.commission.percent, commission_value=0, currency = currency.USD)
//study("MFI Fresh", shorttitle="MFI Fresh", overlay=true)
- 1