Bollinger+RSI Dual Strategy (Panjang Sahaja) v1.2

1. Nama strategi
Strategi Bollinger + RSI berganda
Kedua, gambaran strategi
Strategi ini menggunakan gabungan indikator Brinline dan indikator RSI untuk membuat kedudukan lebih tinggi apabila kedua-duanya menunjukkan isyarat oversell dan posisi lebih rendah apabila kedua-duanya menunjukkan isyarat overbuy. Ia lebih dipercayai untuk mengesahkan isyarat perdagangan dan mengelakkan isyarat palsu berbanding dengan satu indikator.
Ketiga, asas strategi
- Menggunakan RSI untuk menilai overbought dan oversold
- RSI di bawah 50 dianggap sebagai oversold
- RSI lebih tinggi daripada 50 dianggap sebagai overbought
- Garis Brin digunakan untuk menentukan harga yang tidak normal
- Harga di bawah paras rendah dianggap sebagai lebihan.
- Harga lebih tinggi daripada kereta api di atas dianggap sebagai pembelian berlebihan.
- Tambah kedudukan apabila RSI dan Bolling menunjukkan isyarat oversell
- RSI di bawah 50
- Garis harga di bawah garis bawah Brin
- Apabila RSI dan Brinline menunjukkan isyarat overbought pada masa yang sama, posisi terpadam
- RSI lebih tinggi daripada 50
- Garis harga lebih tinggi daripada garis Brin
Keunggulan Strategi
- Gabungan kedua-dua penunjuk, isyarat lebih dipercayai, mengelakkan isyarat palsu
- Hanya membina kedudukan berbilang kepala, mempermudah logik, mengurangkan risiko perdagangan
Lima, Risiko Strategik dan Penyelesaian
- Parameter Brinline tidak betul, had atas dan bawah terlalu luas, meningkatkan risiko perdagangan yang salah
- Mengoptimumkan parameter bulir, menetapkan pusingan bulir yang munasabah dan perbezaan standard
- RSI parameter yang tidak betul, overbought dan oversold penilaian standard yang tidak betul, meningkatkan risiko perdagangan yang salah
- Mengoptimumkan parameter RSI, menyesuaikan kitaran RSI, menetapkan standard overbought dan oversold dengan munasabah
- Ravin kurang berkesan apabila tidak ada trend.
- Kaedah ini juga boleh digunakan untuk mengesan pergerakan mata wang dalam mata wang asing.
Keenam, Strategi Optimasi
- Optimumkan seting parameter binary dan RSI
- Meningkatkan mekanisme kawalan kerugian
- Menggabungkan penunjuk trend seperti MACD
- Menambah penghakiman yang menggabungkan garis pendek dan panjang
VII
Strategi ini menggabungkan kelebihan kedua-dua indikator Brinline dan RSI, berdagang ketika kedua-duanya menunjukkan isyarat overbought dan oversold pada masa yang sama, mengelakkan isyarat palsu yang dihasilkan oleh satu indikator, dan dengan itu meningkatkan ketepatan isyarat. Berbanding dengan versi sebelumnya, hanya membina kedudukan berbilang kepala, mengurangkan risiko perdagangan.
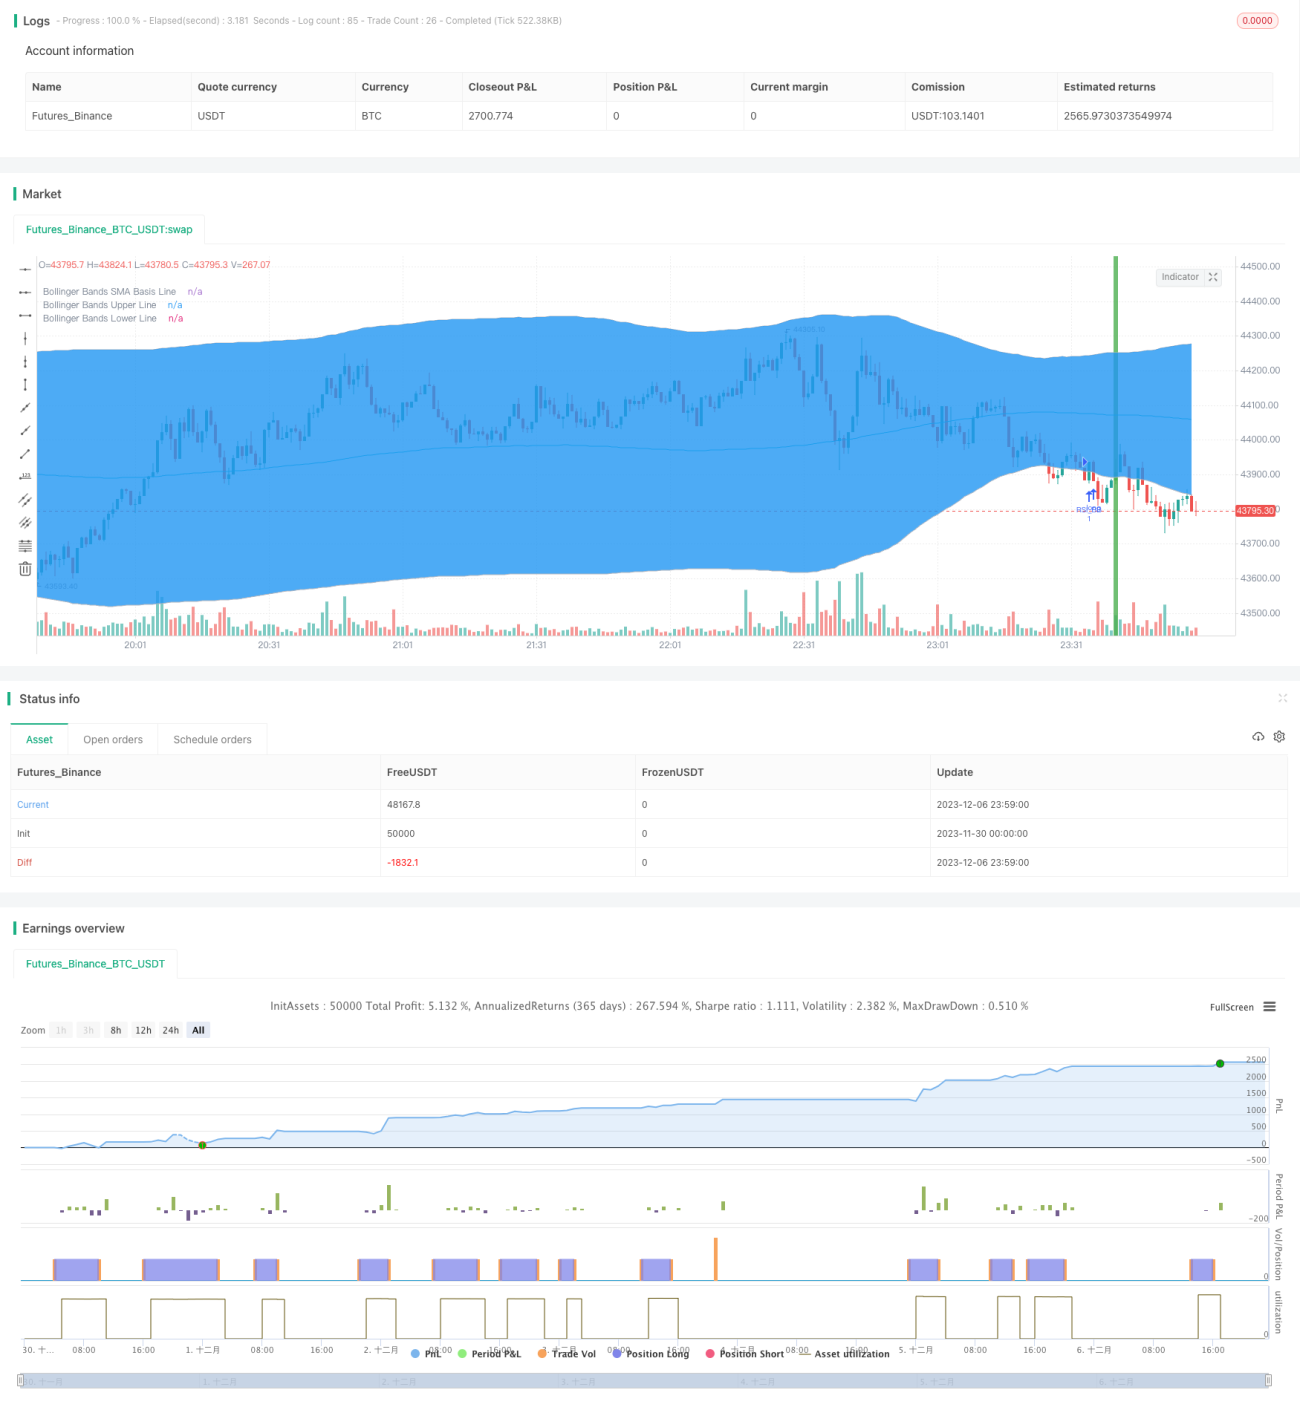
/*backtest
start: 2023-11-30 00:00:00
end: 2023-12-07 00:00:00
period: 1m
basePeriod: 1m
exchanges: [{"eid":"Futures_Binance","currency":"BTC_USDT"}]
*/

//@version=3
strategy("Bollinger + RSI, Double Strategy Long-Only (by ChartArt) v1.2", shorttitle="CA_-_RSI_Bol_Strat_1.2", overlay=true)

// ChartArt's RSI + Bollinger Bands, Double Strategy UPDATE: Long-Only- 1