 ["abc", "def", {"type": "button", "cmd": "coverAll", "name": "close position"}]
      ]
  })"_json;

  auto ticker = exchange.GetTicker();
  json jsonTicker = R"({"Buy": 0, "Sell": 0, "High": 0, "Low": 0, "Volume": 0, "Last": 0, "Time": 0})"_json;
  jsonTicker["Buy"] = ticker.Buy;
  jsonTicker["Sell"] = ticker.Sell;
  jsonTicker["Last"] = ticker.Last;
  jsonTicker["Volume"] = ticker.Volume;
  jsonTicker["Time"] = ticker.Time;
  jsonTicker["High"] = ticker.High;
  jsonTicker["Low"] = ticker.Low;

  json arr = R"([{"body": {}, "colspan": 2}, "abc"])"_json;
  arr[0]["body"] = jsonTicker;
  table["rows"].push_back(arr);
  LogStatus("`" + table.dump() + "`");
}
)
- Vertical merger
```js
function main() {
var table = {
type: 'table',
title: 'Table demo',
cols: ['ColumnA', 'ColumnB', 'ColumnC'],
rows: [
['A1', 'B1', {'type':'button', 'cmd': 'coverAll', 'name': 'C1'}]
]
}
var ticker = exchange.GetTicker()
var name = exchange.GetName()
table.rows.push([{body : "A2 + B2:" + JSON.stringify(ticker), colspan : 2}, "C2"])
table.rows.push([{body : "A3 + A4 + A5:" + name, rowspan : 3}, "B3", "C3"])
// A3 is merged by the first cell in the previous row
table.rows.push(["B4", "C4"])
// A2 is merged by the first cell in the previous row
table.rows.push(["B5", "C5"])
table.rows.push(["A6", "B6", "C6"])
LogStatus('`' + JSON.stringify(table) + '`')
}
import json
def main():
    table = {
        "type" : "table",
        "title" : "Table demo",
        "cols" : ["ColumnA", "ColumnB", "ColumnC"],
        "rows" : [
            ["A1", "B1", {"type": "button", "cmd": "coverAll", "name": "C1"}]
        ]
    }

    ticker = exchange.GetTicker()
    name = exchange.GetName()

    table["rows"].append([{"body": "A2 + B2:" + json.dumps(ticker), "colspan": 2}, "C2"])
    table["rows"].append([{"body": "A3 + A4 + A5:" + name, "rowspan": 3}, "B3", "C3"])
    table["rows"].append(["B4", "C4"])
    table["rows"].append(["B5", "C5"])
    table["rows"].append(["A6", "B6", "C6"])
    LogStatus("`" + json.dumps(table) + "`")
void main() {
    json table = R"({
        "type" : "table",
        "title" : "Table demo",
        "cols" : ["ColumnA", "ColumnB", "ColumnC"],
        "rows" : [
            ["A1", "B1", {"type": "button", "cmd": "coverAll", "name": "C1"}]
        ]
    })"_json;
    // In order to test, the code is short and easy to read, and the constructed data is used here
    json jsonTicker = R"({"High": 0, "Low": 0, "Buy": 0, "Sell": 0, "Last": 0, "Time": 0, "Volume": 0})"_json;
    auto name = exchange.GetName();
    json arr1 = R"([{"body": "", "colspan": 2}, "C2"])"_json;
    arr1[0]["body"] = "A2 + B2:" + jsonTicker.dump();
    json arr2 = R"([{"body": "", "rowspan": 3}, "B3", "C3"])"_json;
    arr2[0]["body"] = "A3 + A4 + A5:" + name;
    table["rows"].push_back(arr1);
    table["rows"].push_back(arr2);
    table["rows"].push_back(R"(["B4", "C4"])"_json);
    table["rows"].push_back(R"(["B5", "C5"])"_json);
    table["rows"].push_back(R"(["A6", "B6", "C6"])"_json);
    LogStatus("`" + table.dump() + "`");
}
)
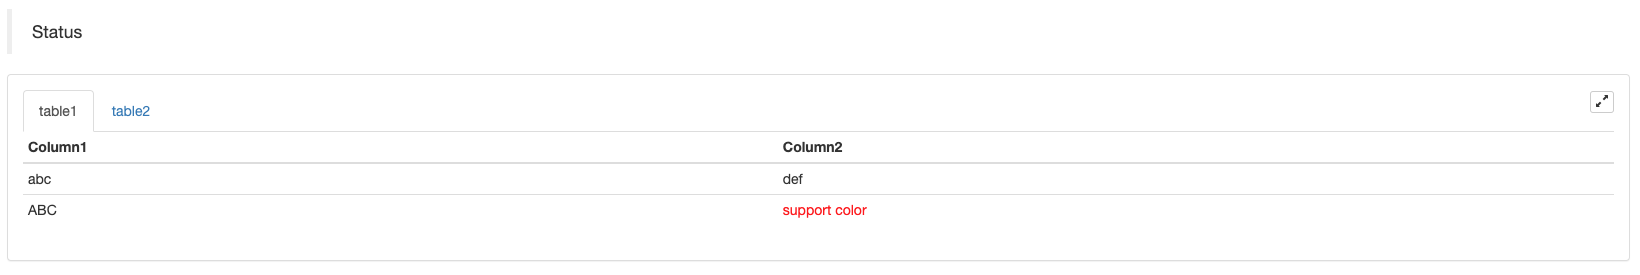
Exibição da barra de status da paginação da tabela:
function main() {
    var table1 = {type: 'table', title: 'table1', cols: ['Column1', 'Column2'], rows: [ ['abc', 'def'], ['ABC', 'support color #ff0000']]}
    var table2 = {type: 'table', title: 'table2', cols: ['Column1', 'Column2'], rows: [ ['abc', 'def'], ['ABC', 'support color #ff0000']]}
    LogStatus('`' + JSON.stringify([table1, table2]) + '`')
}
import json
def main():
    table1 = {"type": "table", "title": "table1", "cols": ["Column1", "Column2"], "rows": [ ["abc", "def"], ["ABC", "support color #ff0000"]]}
    table2 = {"type": "table", "title": "table2", "cols": ["Column1", "Column2"], "rows": [ ["abc", "def"], ["ABC", "support color #ff0000"]]}
    LogStatus("`" + json.dumps([table1, table2]) + "`")
void main() {
    json table1 = R"({"type": "table", "title": "table1", "cols": ["Column1", "Column2"], "rows": [ ["abc", "def"], ["ABC", "support color #ff0000"]]})"_json;
    json table2 = R"({"type": "table", "title": "table2", "cols": ["Column1", "Column2"], "rows": [ ["abc", "def"], ["ABC", "support color #ff0000"]]})"_json;
    json arr = R"([])"_json;
    arr.push_back(table1);
    arr.push_back(table2);
    LogStatus("`" + arr.dump() + "`");
}
Para além da paginação das tabelas, várias tabelas podem ser organizadas de cima para baixo.
function main(){
    var tab1 = {
        type : "table",
        title : "table1",
        cols : ["1", "2"],
        rows : []
    }
    var tab2 = {
        type : "table",
        title : "table2",
        cols : ["1", "2", "3"],
        rows : []
    }
    var tab3 = {
        type : "table",
        title : "table3",
        cols : ["A", "B", "C"],
        rows : []
    }

    tab1.rows.push(["jack", "lucy"])
    tab2.rows.push(["A", "B", "C"])
    tab3.rows.push(["A", "B", "C"])

    LogStatus('`' + JSON.stringify(tab1) + '`\n' +
        '`' + JSON.stringify(tab2) + '`\n' +
        '`' + JSON.stringify(tab3) + '`')

    Log("exit")
}
import json
def main():
    tab1 = {
        "type": "table",
        "title": "table1",
        "cols": ["1", "2"],
        "rows": []
    }
    tab2 = {
        "type": "table",
        "title": "table2",
        "cols": ["1", "2", "3"],
        "rows": []
    }
    tab3 = {
        "type": "table",
        "title": "table3",
        "cols": ["A", "B", "C"],
        "rows": []
    }

    tab1["rows"].append(["jack", "lucy"])
    tab2["rows"].append(["A", "B", "C"])
    tab3["rows"].append(["A", "B", "C"])
    LogStatus("`" + json.dumps(tab1) + "`\n" +
        "`" + json.dumps(tab2) + "`\n" +
        "`" + json.dumps(tab3) + "`")
void main() {
    json tab1 = R"({
        "type": "table",
        "title": "table1",
        "cols": ["1", "2"],
        "rows": []
    })"_json;
    json tab2 = R"({
        "type": "table",
        "title": "table2",
        "cols": ["1", "2", "3"],
        "rows": []
    })"_json;
    json tab3 = R"({
        "type": "table",
        "title": "table3",
        "cols": ["A", "B", "C"],
        "rows": []
    })"_json;
    tab1["rows"].push_back(R"(["jack", "lucy"])"_json);
    tab2["rows"].push_back(R"(["A", "B", "C"])"_json);
    tab3["rows"].push_back(R"(["A", "B", "C"])"_json);
    LogStatus("`" + tab1.dump() + "`\n" +
        "`" + tab2.dump() + "`\n" +
        "`" + tab3.dump() + "`");
}
Resultado da operação:)
Nota:
Quando o bot de estratégia está sendo executado na página do bot, se você rolar pelos registros de histórico, a barra de status entrará em um estado latente e parar de atualizar.
A barra de estado suporta a saída de imagens codificadas embase64, e também suporta a saída das imagens codificadas embase64Como o comprimento da cadeia da imagem codificada é normalmente muito longo, não é fornecido nenhum código de amostra.
AtivarLog()
EnableLog(IsEnable)liga ou desliga o registo de registo para informações sobre encomendas. Valor do parâmetro:isEnableé de tipo bool.IsEnableestá definido emfalse, o registro de pedidos não será impresso e não será escrito no banco de dados do bot.
Gráfico ((...)
Chart(...), função de personalização de gráficos.
Chart({…}); o parâmetro é oHighCharts.StockChartParâmetros deAumento dos estoquesque podem ser serializados emJSON, acrescentando um_isStockse você especificar um atributo para o parâmetro nativo_isStock:false, será exibido como um gráfico normal.
Nota:
Se você definir o atributo de_isStockparafalse, o gráfico utilizado é:Highcharts (Highcharts), conforme mostrado no gráfico:
)
Se definirmos o atributo de_isStockparatrue, o gráfico utilizado é:Resíduos pesados(default)_isStockcomo verdadeiro), conforme indicado no gráfico:
)
Para regressar ao objeto, pode chamaradd(n, data) (n(como 0) é o índice deseries, edataé os dados escritos no gráfico) para adicionar dados ao índice especificadoseries; chamadasreset()para limpar os dados do gráfico, eresetPode tomar um parâmetro numérico e especificar o número de itens reservados.
Podes ligar.add(n, data, i) (ié o índice destes dados noseries) para alterar os dados noseries.
Pode ser negativo,
chart.add(0, [1574993606000, 13.5], -1), alterar os dados do último ponto deseries[0].data.
Para suportar a exibição de vários gráficos, você só precisa passar em parâmetros de matriz durante a configuração, tais como:var chart = Chart([{…}, {…}, {…}])Por exemplo, o gráfico 1 tem doisseries, o gráfico 2 tem umseries, e o gráfico 3 tem umseries. Em seguida, especificar a série ID 0 e 1 quando adicionando representa para atualizar os dados de duas colunas de ordem do gráfico 1; especificar a série ID 2 quando adicionando refere-se ao primeiroseriesA série ID3 refere-se aos dados da primeira série.seriesdo gráfico 3.
HighStocks: http://api.highcharts.com/highstock
Configurações de atributos relacionadas com a exibição de gráficos múltiplos:Exemplo
Por exemplo, os objetos de configuração do gráfico:
var cfgA = {
    extension: {
        // It does not participate in grouping, displayed separately, and its default is 'group'
        layout: 'single',
        // This is the specified height, which can be set to string "300px" (set "300", and "300px" will be displayed instead automatically)
        height: 300,
        // It is the unit value of the specified width, with a total value of 12
        col: 8
    },
    title: {
        text: 'Market Chart'
    },
    xAxis: {
        type: 'datetime'
    },
    series: [{
        name: 'Buy 1',
        data: []
    }, {
        name: 'Sell 1',
        data: []
    }]
}

var cfgB = {
    title: {
        text: 'Spread chart'
    },
    xAxis: {
        type: 'datetime'
    },
    series: [{
        name: 'Spread',
        type: 'column',
        data: []
    }]
}

var cfgC = {
    _isStock: false,
    title: {
        text: 'Pie Chart'
    },
    series: [{
        type: 'pie',
        name: 'one',
        // After specifying the initial data, you don't need to update it with the "add" function; Changing the chart configuration directly will update the series
        data: [
            ["A", 25],
            ["B", 25],
            ["C", 25],
            ["D", 25]
        ]
    }]
}

var cfgD = {
    extension: {
        layout: 'single',
        // The unit value of the specified width, with a total value of 12
        col: 8,
        height: '300px'
    },
    title: {
        text: 'Market Chart'
    },
    xAxis: {
        type: 'datetime'
    },
    series: [{
        name: 'Buy 1',
        data: []
    }, {
        name: 'Sell 1',
        data: []
    }]
}

var cfgE = {
    __isStock: false,
    extension: {
        layout: 'single',
        col: 4,
        height: '300px'
    },
    title: {
        text: 'Pie Chart2'
    },
    series: [{
        type: 'pie',
        name: 'one',
        data: [
            ["A", 25],
            ["B", 25],
            ["C", 25],
            ["D", 25]
        ]
    }]
}
cfgA = {
    "extension" : {
        "layout" : "single",
        "height" : 300,
        "col" : 8
    },
    "title" : {
        "text" : "Market Chart"
    },
    "xAxis" : {
        "type" : "datetime"
    },
    "series" : [{
        "name" : "Buy 1",
        "data" : []
    }, {
        "name" : "Sell 1",
        "data" : []
    }]
}

cfgB = {
    "title" : {
        "text" : "Spread chart"
    },
    "xAxis" : {
        "type" : "datetime"
    },
    "series" : [{
        "name" : "Spread",
        "type" : "column",
        "data" : []
    }]
}

cfgC = {
    "__isStock" : False,
    "title" : {
        "text" : "Pie Chart"
    },
    "series" : [{
        "type" : "pie",
        "name" : "one",
        "data" : [
            ["A", 25],
            ["B", 25],
            ["C", 25],
            ["D", 25]
        ]
    }]
}

cfgD = {
    "extension" : {
        "layout" : "single",
        "col" : 8,
        "height" : "300px"
    },
    "title" : {
        "text" : "Market Chart"
    },
    "series" : [{
        "name" : "Buy 1",
        "data" : []
    }, {
        "name" : "Sell 1",
        "data" : []
    }]
}

cfgE = {
    "__isStock" : False,
    "extension" : {
        "layout" : "single",
        "col" : 4,
        "height" : "300px"
    },
    "title" : {
        "text" : "Pie Chart2"
    },
    "series" : [{
        "type" : "pie",
        "name" : "one",
        "data" : [
            ["A", 25],
            ["B", 25],
            ["C", 25],
            ["D", 25]
        ]
    }]
}
json cfgA = R"({
    "extension" : {
        "layout" : "single",
        "height" : 300,
        "col" : 8
    },
    "title" : {
        "text" : "Market Chart"
    },
    "xAxis" : {
        "type" : "datetime"
    },
    "series" : [{
        "name" : "Buy 1",
        "data" : []
    }, {
        "name" : "Sell 1",
        "data" : []
    }]
})"_json;

json cfgB = R"({
    "title" : {
        "text" : "Spread chart"
    },
    "xAxis" : {
        "type" : "datetime"
    },
    "series" : [{
        "name" : "Spread",
        "type" : "column",
        "data" : []
    }]
})"_json;

json cfgC = R"({
    "__isStock" : false,
    "title" : {
        "text" : "Pie Chart"
    },
    "series" : [{
        "type" : "pie",
        "name" : "one",
        "data" : [
            ["A", 25],
            ["B", 25],
            ["C", 25],
            ["D", 25]
        ]
    }]
})"_json;

json cfgD = R"({
    "extension" : {
        "layout" : "single",
        "col" : 8,
        "height" : "300px"
    },
    "title" : {
        "text" : "Market Chart"
    },
    "series" : [{
        "name" : "Buy 1",
        "data" : []
    }, {
        "name" : "Sell 1",
        "data" : []
    }]
})"_json;

json cfgE = R"({
    "__isStock" : false,
    "extension" : {
        "layout" : "single",
        "col" : 4,
        "height" : "300px"
    },
    "title" : {
        "text" : "Pie Chart2"
    },
    "series" : [{
        "type" : "pie",
        "name" : "one",
        "data" : [
            ["A", 25],
            ["B", 25],
            ["C", 25],
            ["D", 25]
        ]
    }]
})"_json;
-
cfgA.extension.layoutatributoSe este atributo estiver definido e o valor for
single , o gráfico não será sobreposto (não será exibido como um rótulo com guias) e será exibido separadamente (exibição de azulejos). -
cfgA.extension.heightatributoEste atributo é usado para definir a altura do gráfico.
-
cfgA.extension.colatributoEste atributo é usado para definir a largura do gráfico. A largura da página é dividida em 12 unidades no total, e a configuração
8 significa que o gráfico ocupa 8 unidades de largura. Execute a estratégia de exemplo completa:
O efeito de exibição dos objetos de configuração do gráfico nos exemplos acima:
)
)
-
Para os dados nos objetos de configuração do gráfico, modifique a configuração do gráfico diretamente e atualize o gráfico para realizar a atualização dos dados:
Por exemplo, no
JavaScriptParte do código do exemplo (Um exemplo completo):cfgC.series[0].data[0][1] = Math.random() * 100 cfgE.series[0].data[0][1] = Math.random() * 100 // "Update" is actually equivalent to resetting the configuration of the chart chart.update([cfgA, cfgB, cfgC, cfgD, cfgE])Atualizar os dados por
addA partir de agora, o número de pessoas que se encontram em situação de vulnerabilidade é aumentado.JavaScriptParte do código do exemplo (Um exemplo completo):// Add a data point to the pie chart; "add" can only update the data points added by the "add" method, the built-in data points cannot be updated later chart.add(3, { name: "ZZ", y: Math.random() * 100 }) -
Exemplos de utilização de
ChartfunçãoExemplo de desenho simples:
// This chart is an object in JavaScript language. Before using the "Chart" function, we need to declare an object variable of a chart configuration
var chart = {
    // It is marked as a general chart; if you are interested, you can change it to false and run it
    __isStock: true,
    // Zoom tool
    tooltip: {xDateFormat: '%Y-%m-%d %H:%M:%S, %A'},
    // Title
    title : { text : 'Spread analysis chart'},
    // Choose a range
    rangeSelector: {
        buttons:  [{type: 'hour',count: 1, text: '1h'}, {type: 'hour',count: 3, text: '3h'}, {type: 'hour', count: 8, text: '8h'}, {type: 'all',text: 'All'}],
        selected: 0,
        inputEnabled: false
    },
    // The horizontal axis of the coordinate axis is: x axis, and the currently set "Types of" is: time
    xAxis: { type: 'datetime'},
    // The vertical axis of the coordinate axis is: y axis, and the default value is adjusted with the data size
    yAxis : {
        // Title
        title: {text: 'Spread'},
        // Whether to enable the right vertical axis
        opposite: false
    },
    // Data system column; this attribute holds each data system column (line, K-line diagram, label, etc.)
    series : [
        // The index is 0, and the data in the data column is stored in the data array.
        {name : "line1", id : "line 1,buy1Price", data : []},
        // The index is 1, and set dashStyle: 'shortdash', namely: set the dashed line
        {name : "line2", id : "line 2,lastPrice", dashStyle : 'shortdash', data : []}
    ]
}
function main(){
    // Call the "Chart" function to initialize the chart
    var ObjChart = Chart(chart)
    // Empty
    ObjChart.reset()
    while(true){
        // Get the timestamp of this polling, that is, a millisecond timestamp, used to determine the position of the X axis written to the chart
        var nowTime = new Date().getTime()
        // Get market data
        var ticker = _C(exchange.GetTicker)
        // Get "Buy 1" price from the return value of market data
        var buy1Price = ticker.Buy
        // To obtain the last executed price, in order to avoid the overlap of the 2 lines, we add 1
        var lastPrice = ticker.Last + 1
        // Use timestamp as X value and "Buy 1" price as Y value, and pass them into the data sequence of index 0
        ObjChart.add(0, [nowTime, buy1Price])
        // Same as above
        ObjChart.add(1, [nowTime, lastPrice])
        Sleep(2000)
    }
}
import time chart = { "__isStock" : True, "tooltip" : {"xDateFormat" : "%Y-%m-%d %H:%M:%S, %A"}, "title" : {"text" : "Spread analysis chart"}, "rangeSelector" : { "buttons" : [{"type": "count", "count": 1, "text": "1h"}, {"type": "hour", "count": 3, "text": "3h"}, {"type": "hour", "count": 8, "text": "8h"}, {"type": "all", "text": "All"}], "selected": 0, "inputEnabled": False }, "xAxis": {"type": "datetime"}, "yAxis": { "title": {"text": "Spread"}, "opposite": False }, "series": [{ "name": "line1", "id": "line 1,buy1Price", "data": [] }, { "name": "line2", "id": "line 2,lastPrice", "dashStyle": "shortdash", "data": [] }] } def main(): ObjChart = Chart(chart) ObjChart.reset() while True: nowTime = time.time() * 1000 ticker = exchange.GetTicker() buy1Price = ticker["Buy"] lastPrice = ticker["Last"] + 1 ObjChart.add(0, [nowTime, buy1Price]) ObjChart.add(1, [nowTime, lastPrice]) Sleep(2000)void main() { // When write strategies in C++, try not to declare global variables that are not basic types, so the declaration of the chart configuration objects is in the "main" function json chart = R"({ "__isStock" : true, "tooltip" : {"xDateFormat" : "%Y-%m-%d %H:%M:%S, %A"}, "title" : {"text" : "Spread analysis chart"}, "rangeSelector" : { "buttons" : [{"type": "count", "count": 1, "text": "1h"}, {"type": "hour", "count": 3, "text": "3h"}, {"type": "hour", "count": 8, "text": "8h"}, {"type": "all", "text": "All"}], "selected": 0, "inputEnabled": false }, "xAxis": {"type": "datetime"}, "yAxis": { "title": {"text": "Spread"}, "opposite": false }, "series": [{ "name": "line1", "id": "line 1,buy1Price", "data": [] }, { "name": "line2", "id": "line 2,lastPrice", "dashStyle": "shortdash", "data": [] }] })"_json; auto ObjChart = Chart(chart); ObjChart.reset(); while(true) { auto nowTime = Unix() * 1000; auto ticker = exchange.GetTicker(); auto buy1Price = ticker.Buy; auto lastPrice = ticker.Last + 1.0; ObjChart.add(0, {nowTime, buy1Price}); ObjChart.add(1, {nowTime, lastPrice}); Sleep(2000); } }O exemplo de desenho de curva trigonométrica:
// The object used to initialize the chart
var chart = {
    // Chart title
    title: {text: "line value triggers plotLines value"},
    // The related settings of Y axis
    yAxis: {
        // The horizontal line perpendicular to y axis, used as a trigger line, is an array of structures where multiple trigger lines can be set
        plotLines: [{
            // Trigger line value; set a number, and this line will be displayed in the corresponding numerical position
            value: 0,
            // Set the color of the trigger line
            color: 'red',
            // Width
            width: 2,
            // Labels displayed
            label: {
                // Label text
                text: 'Trigger value',
                // Center label position
                align: 'center'
            }
        }]
    },
    // The related settings of X axis, and here the setting type is the time axis
    xAxis: {type: "datetime"},
    series: [
        {name: "sin", type: "spline", data: []},
        // This is a more important data system column; you can set multiple data system column, according to the array index control
        {name: "cos", type: "spline", data: []}
    ]
}
function main(){
    // Pi
    var pi = 3.1415926535897
    // Variable for recording timestamp
    var time = 0
    // Angle
    var angle = 0
    // Coordinate y value, used to receive sine and cosine values
    var y = 0
    // Call the API to initialize charts with "chart" objects
    var objChart = Chart(chart)
    // When initializing, clear the chart
    objChart.reset()
    // Set the value of the trigger line to 1
    chart.yAxis.plotLines[0].value = 1
    // Loop
    while(true){
        // Get the timestamp of the current moment
        time = new Date().getTime()
        // The angle is increased by 5 degrees every 500ms, and the sine value is calculated
        y = Math.sin(angle * 2 * pi / 360)
        // Write the calculated y value to the data of the corresponding index of the chart; the first parameter of the "add" function is the specified index
        objChart.add(0, [time, y])
        // Calculate the cosine value
        y = Math.cos(angle * 2 * pi / 360)
        objChart.add(1, [time, y])
        // Increase by 5 degrees
        angle += 5
        // Pause for 5 seconds, to avoid drawing too frequently and the data growing too fast
        Sleep(5000)
    }
}
import math import time chart = { "title": {"text": "line value triggers plotLines value"}, "yAxis": { "plotLines": [{ "value": 0, "color": "red", "width": 2, "label": { "text": "Trigger value", "align": "center" } }] }, "xAxis": {"type": "datetime"}, "series": [{"name": "sin", "type": "spline", "data": []}, {"name": "cos", "type": "spline", "data": []}] } def main(): pi = 3.1415926535897 ts = 0 angle = 0 y = 0 objChart = Chart(chart) objChart.reset() chart["yAxis"]["plotLines"][0]["value"] = 1 while True: ts = time.time() * 1000 y = math.sin(angle * 2 * pi / 360) objChart.add(0, [ts, y]) y = math.cos(angle * 2 * pi / 360) objChart.add(1, [ts, y]) angle += 5 Sleep(5000)void main() { json chart = R"({ "title": {"text": "line value triggers plotLines value"}, "yAxis": { "plotLines": [{ "value": 0, "color": "red", "width": 2, "label": { "text": "Trigger value", "align": "center" } }] }, "xAxis": {"type": "datetime"}, "series": [{"name": "sin", "type": "spline", "data": []}, {"name": "cos", "type": "spline", "data": []}] })"_json; auto pi = 3.1415926535897; auto ts = 0; auto angle = 0.0; auto y = 0.0; auto objChart = Chart(chart); objChart.reset(); chart["yAxis"]["plotLines"][0]["value"] = 1; while(true) { ts = Unix() * 1000; y = sin(angle * 2 * pi / 360); objChart.add(0, {ts, y}); y = cos(angle * 2 * pi / 360); objChart.add(1, {ts, y}); angle += 5; Sleep(5000); } }Em
cppestratégia, oChartfunção também pode usar uma cadeia codificada para configurar o gráfico:void main () { Chart c = Chart(R"EOF({"chart":{"type":"line"},"title":{"text":"Simple chart"},"xAxis":{"title":{"text":"Date"}},"yAxis":{"title":{"text":"Number"}},"series":[{"name":"number","data":[]}]})EOF"); c.reset(); for (size_t i = 0; i < 10; i++) { // For example, int64 of "sprintf" function has different parameters in 32-bit and 64-bit, so it is best to use "toString" to transfer the platform-related types into strings and then pass c.add(0, format("[%s, %d]", toString(Unix() + i).c_str(), rand() % 100)); } })
-
Um exemplo complexo de gráficos mistosEndereço da estratégia JavaScript
/*backtest
start: 2020-03-11 00:00:00
end: 2020-04-09 23:59:00
period: 1d
exchanges: [{"eid":"Bitfinex","currency":"BTC_USD"}]
*/

var chartCfg = {
    subtitle: {
        text: "subtitle",
    },
    yAxis: [{
        height: "40%",
        lineWidth: 2,
        title: {
            text: 'PnL',
        },
        tickPixelInterval: 20,
        minorGridLineWidth: 1,
        minorTickWidth: 0,
        opposite: true,
        labels: {
            align: "right",
            x: -3,
        }
    }, {
        title: {
            text: 'Profit',
        },
        top: "42%",
        height: "18%",
        offset: 0,
        lineWidth: 2
    }, {
        title: {
            text: 'Vol',
        },
        top: '62%',
        height: '18%',
        offset: 0,
        lineWidth: 2
    }, {
        title: {
            text: 'Asset',
        },
        top: '82%',
        height: '18%',
        offset: 0,
        lineWidth: 2
    }],
    series: [{
        name: 'PnL',
        data: [],
        id: 'primary',
        tooltip: {
            xDateFormat: '%Y-%m-%d %H:%M:%S'
        },
        yAxis: 0
    }, {
        type: 'column',
        lineWidth: 2,
        name: 'Profit',
        data: [],
        yAxis: 1,
    }, {
        type: 'column',
        name: 'Trade',
        data: [],
        yAxis: 2
    }, {
        type: 'area',
        step: true,
        lineWidth: 0,
        name: 'Long',
        data: [],
        yAxis: 2
    }, {
        type: 'area',
        step: true,
        lineWidth: 0,
        name: 'Short',
        data: [],
        yAxis: 2
    }, {
        type: 'line',
        step: true,
        color: '#5b4b00',
        name: 'Asset',
        data: [],
        yAxis: 3
    }, {
        type: 'pie',
        innerSize: '70%',
        name: 'Random',
        data: [],
        center: ['3%', '6%'],
        size: '15%',
        dataLabels: {
            enabled: false
        },
        startAngle: -90,
        endAngle: 90,
    }],
};

function main() {
    let c = Chart(chartCfg);
    let preTicker = null;
    while (true) {
        let t = exchange.GetTicker();

        c.add(0, [t.Time, t.Last]); // PnL
        c.add(1, [t.Time, preTicker ? t.Last - preTicker.Last : 0]); // profit
        let r = Math.random();
        var pos = parseInt(t.Time/86400);
        c.add(2, [t.Time, pos/2]); // Vol
        c.add(3, [t.Time, r > 0.8 ? pos : null]); // Long
        c.add(4, [t.Time, r < 0.8 ? -pos : null]); // Short
        c.add(5, [t.Time, Math.random() * 100]); // Asset
        // update pie
        chartCfg.series[chartCfg.series.length-1].data = [
            ["A", Math.random()*100],
            ["B", Math.random()*100],
         ];
        c.update(chartCfg)
        preTicker = t;
    }
}
'''backtest
start: 2020-03-11 00:00:00
end: 2020-04-09 23:59:00
period: 1d
exchanges: [{"eid":"Bitfinex","currency":"BTC_USD"}]
'''

import random

chartCfg = {
    "subtitle": {
        "text": "subtitle"
    },
    "yAxis": [{
        "height": "40%",
        "lineWidth": 2,
        "title": {
            "text": 'PnL'
        },
        "tickPixelInterval": 20,
        "minorGridLineWidth": 1,
        "minorTickWidth": 0,
        "opposite": True,
        "labels": {
            "align": "right",
            "x": -3
        }
    }, {
        "title": {
            "text": 'Profit'
        },
        "top": "42%",
        "height": "18%",
        "offset": 0,
        "lineWidth": 2
    }, {
        "title": {
            "text": 'Vol'
        },
        "top": '62%',
        "height": '18%',
        "offset": 0,
        "lineWidth": 2
    }, {
        "title": {
            "text": 'Asset'
        },
        "top": '82%',
        "height": '18%',
        "offset": 0,
        "lineWidth": 2
    }],
    "series": [{
        "name": 'PnL',
        "data": [],
        "id": 'primary',
        "tooltip": {
            "xDateFormat": '%Y-%m-%d %H:%M:%S'
        },
        "yAxis": 0
    }, {
        "type": 'column',
        "lineWidth": 2,
        "name": 'Profit',
        "data": [],
        "yAxis": 1
    }, {
        "type": 'column',
        "name": 'Trade',
        "data": [],
        "yAxis": 2
    }, {
        "type": 'area',
        "step": True,
        "lineWidth": 0,
        "name": 'Long',
        "data": [],
        "yAxis": 2
    }, {
        "type": 'area',
        "step": True,
        "lineWidth": 0,
        "name": 'Short',
        "data": [],
        "yAxis": 2
    }, {
        "type": 'line',
        "step": True,
        "color": '#5b4b00',
        "name": 'Asset',
        "data": [],
        "yAxis": 3
    }, {
        "type": 'pie',
        "innerSize": '70%',
        "name": 'Random',
        "data": [],
        "center": ['3%', '6%'],
        "size": '15%',
        "dataLabels": {
            "enabled": False
        },
        "startAngle": -90,
        "endAngle": 90
    }]
}

def main():
    c = Chart(chartCfg)
    preTicker = None
    while True:
        t = exchange.GetTicker()
        c.add(0, [t["Time"], t["Last"]])
        profit = t["Last"] - preTicker["Last"] if preTicker else 0
        c.add(1, [t["Time"], profit])
        r = random.random()
        pos = t["Time"] / 86400
        c.add(2, [t["Time"], pos / 2])
        long = pos if r > 0.8 else None
        c.add(3, [t["Time"], long])
        short = -pos if r < 0.8 else None
        c.add(4, [t["Time"], short])
        c.add(5, [t["Time"], random.random() * 100])

        # update pie
        chartCfg["series"][len(chartCfg["series"]) - 1]["data"] = [
            ["A", random.random() * 100],
            ["B", random.random() * 100]
        ]
        c.update(chartCfg)
        preTicker = t
/*backtest
start: 2020-03-11 00:00:00
end: 2020-04-09 23:59:00
period: 1d
exchanges: [{"eid":"Bitfinex","currency":"BTC_USD"}]
*/

void main() {
    json chartCfg = R"({
        "subtitle": {
            "text": "subtitle"
        },
        "yAxis": [{
            "height": "40%",
            "lineWidth": 2,
            "title": {
                "text": "PnL"
            },
            "tickPixelInterval": 20,
            "minorGridLineWidth": 1,
            "minorTickWidth": 0,
            "opposite": true,
            "labels": {
                "align": "right",
                "x": -3
            }
        }, {
            "title": {
                "text": "Profit"
            },
            "top": "42%",
            "height": "18%",
            "offset": 0,
            "lineWidth": 2
        }, {
            "title": {
                "text": "Vol"
            },
            "top": "62%",
            "height": "18%",
            "offset": 0,
            "lineWidth": 2
        }, {
            "title": {
                "text": "Asset"
            },
            "top": "82%",
            "height": "18%",
            "offset": 0,
            "lineWidth": 2
        }],
        "series": [{
            "name": "PnL",
            "data": [],
            "id": "primary",
            "tooltip": {
                "xDateFormat": "%Y-%m-%d %H:%M:%S"
            },
            "yAxis": 0
        }, {
            "type": "column",
            "lineWidth": 2,
            "name": "Profit",
            "data": [],
            "yAxis": 1
        }, {
            "type": "column",
            "name": "Trade",
            "data": [],
            "yAxis": 2
        }, {
            "type": "area",
            "step": true,
            "lineWidth": 0,
            "name": "Long",
            "data": [],
            "yAxis": 2
        }, {
            "type": "area",
            "step": true,
            "lineWidth": 0,
            "name": "Short",
            "data": [],
            "yAxis": 2
        }, {
            "type": "line",
            "step": true,
            "color": "#5b4b00",
            "name": "Asset",
            "data": [],
            "yAxis": 3
        }, {
            "type": "pie",
            "innerSize": "70%",
            "name": "Random",
            "data": [],
            "center": ["3%", "6%"],
            "size": "15%",
            "dataLabels": {
                "enabled": false
            },
            "startAngle": -90,
            "endAngle": 90
        }]
    })"_json;

    Chart c = Chart(chartCfg);
    Ticker preTicker;
    while(true) {
        auto t = exchange.GetTicker();
        c.add(0, {t.Time, t.Last});
        auto profit = preTicker.Valid ? t.Last - preTicker.Last : 0;
        c.add(1, {t.Time, profit});
        auto r = rand() % 100;
        auto pos = t.Time / 86400.0;
        c.add(2, {t.Time, pos / 2.0});
        auto longPos = r > 0.8 ? pos : NULL;
        c.add(3, {t.Time, longPos});
        auto shortPos = r < 0.8 ? -pos : NULL;
        c.add(4, {t.Time, shortPos});
        c.add(5, {t.Time, rand() % 100});

        // update pie
        json pie = R"([["A", 0], ["B", 0]])"_json;
        pie[0][1] = rand() % 100;
        pie[1][1] = rand() % 100;
        chartCfg["series"][chartCfg["series"].size() - 1]["data"] = pie;

        c.update(chartCfg);
        preTicker = t;
    }
}
Entre os gráficos, opieO gráfico é um gráfico sem eixo de tempo, e a configuração do gráfico precisa ser atualizada diretamente ao atualizar os dados.c.update(chartCfg)Atualizar o gráfico do seguinte modo:
    // update pie
    chartCfg.series[chartCfg.series.length-1].data = [
        ["A", Math.random()*100],
        ["B", Math.random()*100],
    ];
    c.update(chartCfg)
    # update pie
    chartCfg["series"][len(chartCfg["series"]) - 1]["data"] = [
        ["A", random.random() * 100],
        ["B", random.random() * 100]
    ]
    c.update(chartCfg)
    // update pie
    json pie = R"([["A", 0], ["B", 0]])"_json;
    pie[0][1] = rand() % 100;
    pie[1][1] = rand() % 100;
    chartCfg["series"][chartCfg["series"].size() - 1]["data"] = pie;
    c.update(chartCfg);
Resultado da operação: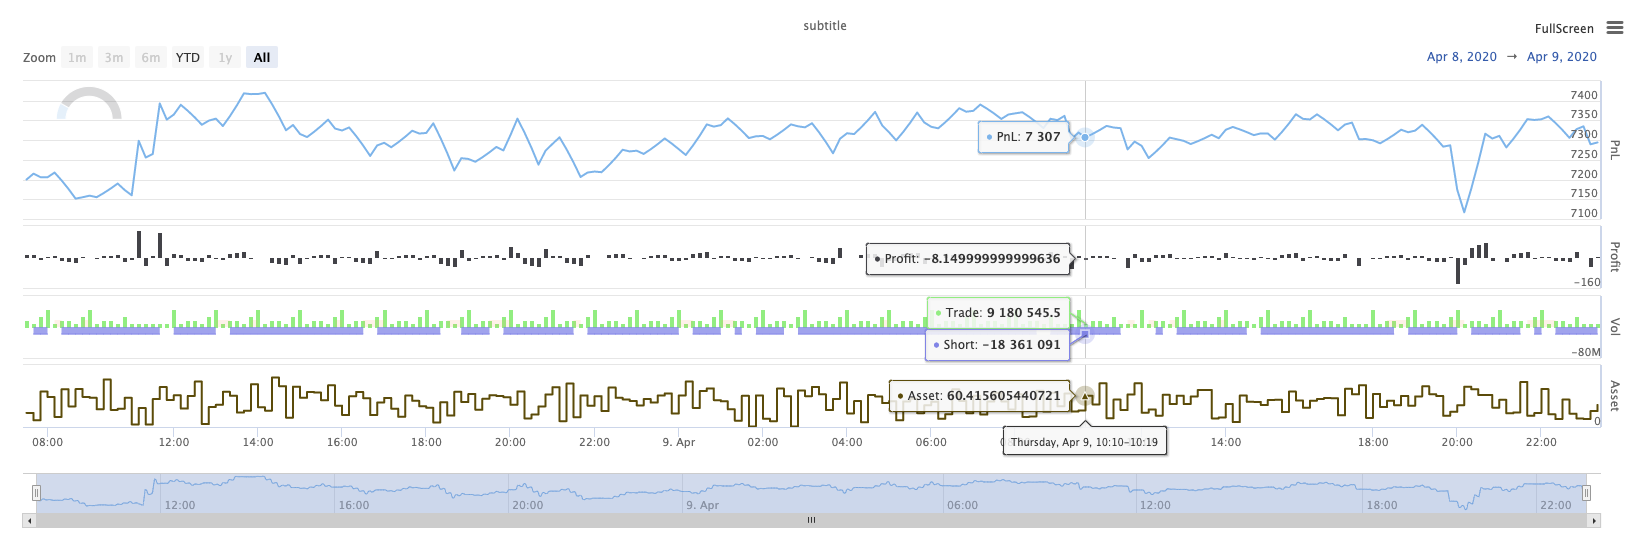
KLineChart ((...)
KLineChart(chartCfg), esta função é usada para usar um método de desenho semelhante à linguagem Pine para desenho personalizado quando a estratégia está sendo executada.KLineChart()método ou um dosChart() methods.
Código de referência:
function main() {
    // Call the KLineChart function to create a chart control object c
    let c = KLineChart({
        overlay: true
    })

    // Use the spot exchange object test to obtain K-line data. If you use the futures exchange object test, you need to set up the contract first.
    let bars = exchange.GetRecords()
    if (!bars) {
        return
    }

    bars.forEach(function(bar, index) {
        c.begin(bar)
        c.barcolor(bar.Close > bar.Open ? 'rgba(255, 0, 0, 0.2)' : 'rgba(0, 0, 0, 0.2)')
        if (bar.Close > bar.Open) {
            c.bgcolor('rgba(0, 255, 0, 0.5)')
        }
        let h = c.plot(bar.High, 'high')
        let l = c.plot(bar.Low, 'low')

        c.fill(h, l, {
            color: bar.Close > bar.Open ? 'rgba(255, 0, 0, 0.2)' : 'rgba(255, 0, 0, 0.2)'
        })
        c.hline(bar.High)
        c.plotarrow(bar.Close - bar.Open)
        c.plotshape(bar.Low, {
            style: 'diamond'
        })
        c.plotchar(bar.Close, {
            char: 'X'
        })
        c.plotcandle(bar.Open*0.9, bar.High*0.9, bar.Low*0.9, bar.Close*0.9)
        if (bar.Close > bar.Open) {
            // long/short/closelong/closeshort
            c.signal("long", bar.High, 1.5)
        } else if (bar.Close < bar.Open) {
            c.signal("closelong", bar.Low, 1.5)
        }
        c.close()
    })
}
def main():
    # Call the KLineChart function to create a chart control object c
    c = KLineChart({
        "overlay": True
    })

    # Use the spot exchange object test to obtain K-line data. If you use the futures exchange object test, you need to set up the contract first.
    bars = exchange.GetRecords()
    if not bars:
        return

    for bar in bars:
        c.begin(bar)
        c.barcolor('rgba(255, 0, 0, 0.2)' if bar.Close > bar.Open else 'rgba(0, 0, 0, 0.2)')
        if bar.Close > bar.Open:
            c.bgcolor('rgba(0, 255, 0, 0.5)')

        h = c.plot(bar.High, 'high')
        l = c.plot(bar.Low, 'low')

        c.fill(h, l, 'rgba(255, 0, 0, 0.2)' if bar.Close > bar.Open else 'rgba(255, 0, 0, 0.2)')
        c.hline(bar.High)
        c.plotarrow(bar.Close - bar.Open)
        c.plotshape(bar.Low, style = 'diamond')
        c.plotchar(bar.Close, char = 'X')
        c.plotcandle(bar.Open*0.9, bar.High*0.9, bar.Low*0.9, bar.Close*0.9)
        if bar.Close > bar.Open:
            # long/short/closelong/closeshort
            c.signal("long", bar.High, 1.5)
        elif bar.Close < bar.Open:
            c.signal("closelong", bar.Low, 1.5)

        c.close()
// Not supported currently
Se deve haver um objeto de controle de gráfico para desenho na área de desenho personalizado da estratégia, use a funçãoKLineChartO parâmetro doKLineChartfunção é uma estrutura de configuração gráfica, a estrutura gráfica utilizada no código de referência é muito simples{overlay: true})Esta estrutura de configuração de gráfico define apenas o conteúdo do desenho a ser emitido no gráfico principal.overlayestá definido emfalse, o conteúdo do gráfico é produzido no sub-gráfico. Se você precisa especificar uma função de desenho para desenhar no gráfico principal, você também pode especificar o parâmetrooverlaycomotruena chamada de função específica.
A operação de desenho é executada atravessando os dados da linha K. A operação de desenho deve começar com umc.begin(bar)Função chamada e termina com ac.close()As funções de interface de desenho da linguagem Pine suportadas na operação de desenho são:
-
Barcolor: Colocar a linha K
barcolor ((color, offset, editável, show_last, title, display)
c.barcolor(bar.Close > bar.Open ? 'rgba(255, 0, 0, 0.2)' : 'rgba(0, 0, 0, 0.2)') // Use the example illustrated in the reference code in this example, without giving unnecessary detailsc.barcolor('rgba(255, 0, 0, 0.2)' if bar.Close > bar.Open else 'rgba(0, 0, 0, 0.2)')displayParâmetros opcionais:não , todos
-
bgcolor: Preencha o fundo da linha K com a cor especificada
bgcolor ((color, offset, editável, show_last, título, exibição, sobreposição)
c.bgcolor('rgba(0, 255, 0, 0.5)')c.bgcolor('rgba(0, 255, 0, 0.5)')displayParâmetros opcionais:não , todos
-
gráfico: traçar uma série de dados no gráfico
plot ((série, título, cor, largura de linha, estilo, trackprice, histbase, offset, join, editável, show_last, display)
c.plot(bar.High, 'high')h = c.plot(bar.High, 'high')styleParâmetros opcionais:stepline_diamond , stepline , cross , areaabr , area , circles , columns , histogram , linebr , line displayParâmetros opcionais:não , todos
-
preencher: preencher o fundo entre dois desenhos ou linhas com a cor fornecida
preencher ((linha1, linha2, cor, título, editável, preenchimento de espaços, exibição)
let h = c.plot(bar.High, 'high')
let l = c.plot(bar.Low, 'low')

c.fill(h, l, {color: bar.Close > bar.Open ? 'rgba(255, 0, 0, 0.2)' : 'rgba(255, 0, 0, 0.2)'})
h = c.plot(bar.High, 'high') l = c.plot(bar.Low, 'low') c.fill(h, l, {"color": 'rgba(255, 0, 0, 0.2)' if bar.Close > bar.Open else 'rgba(255, 0, 0, 0.2)'})displayParâmetros opcionais:não , todos
Desde o
JavaScriptA linguagem não pode especificar os parâmetros de entrada de acordo com os nomes das funções parâmetros formais, a fim de resolver este problema, um{key: value}estrutura pode ser usado para especificar o parâmetro passado em um certo nome de parâmetro formal, por exemplo, no código de referência, uso{color: bar.Close > bar.Open ? 'rgba(255, 0, 0, 0.2)' : 'rgba(255, 0, 0, 0.2)'}para especificar ocolorParâmetro dofillSe você precisa especificar parâmetros com vários nomes de parâmetros consecutivamente, você pode usar{key1: value1, key2: value2, key3: value3}Por exemplo, neste exemplo, adicionar um parâmetro especificando umtitle:{color: bar.Close > bar.Open ? 'rgba(255, 0, 0, 0.2)' : 'rgba(255, 0, 0, 0.2)', title: 'fill'}.Para o valor da cor, você pode usar o
'rgba(255, 0, 0, 0.2)'método para definir, ou utilizar o'#FF0000'método a definir. -
linha: Renda uma linha horizontal a um determinado nível de preço fixo
linha ((preço, título, cor, estilo de linha, largura de linha, editável, exibição)
c.hline(bar.High)c.hline(bar.High)linestyleParâmetros opcionais:dashed , dotted , solid displayParâmetros opcionais:não , todos
-
Plotarrow: Desenhe setas para cima e para baixo no gráfico
Plotarrow ((série, título, colorup, colorordown, offset, minheight, maxheight, editável, show_last, display)
c.plotarrow(bar.Close - bar.Open)c.plotarrow(bar.Close - bar.Open)displayParâmetros opcionais:não , todos
-
Plotshape: Desenhe formas visuais no gráfico
plotshape (série, título, estilo, localização, cor, offset, texto, textcolor, editável, tamanho, show_last, display)
c.plotshape(bar.Low, {style: 'diamond'})c.plotshape(bar.Low, style = 'diamond')-
styleParâmetros opcionais:diamond , square , label_down , label_up , arrow_down , arrow_up , circle , flag , triangle_down , triangle_up , cross , xcross -
locationParâmetros opcionais:barra superior , barra inferior , barra superior , barra inferior , barra absoluta -
sizeParâmetros opcionais:10px , 14px , 20px , 40px , 80px , em comparação com o size.tiny,size.small,size.normal,size.large,size.hugeem língua do pinheirosize.autoésize.small. -
displayParâmetros opcionais:não , todos
-
-
plotchar: Desenhe formas visíveis no gráfico usando qualquer caracter Unicode dado
plotchar ((série, título, char, localização, cor, offset, texto, textcolor, editável, tamanho, show_last, display)
c.plotchar(bar.Close, {char: 'X'})c.plotchar(bar.Close, char = 'X')-
locationParâmetros opcionais:barra superior , barra inferior , barra superior , barra inferior , barra absoluta -
sizeParâmetros opcionais:10px , 14px , 20px , 40px , 80px , em comparação com o size.tiny,size.small,size.normal,size.large,size.hugeem língua do pinheirosize.autoésize.small. -
displayParâmetros opcionais:não , todos
-
-
plotcandle: Desenhe um gráfico de linha K no gráfico
plotcandle ((aberto, alto, baixo, fechado, título, cor, wickcolor, editável, show_last, bordercolor, display)
c.plotcandle(bar.Open*0.9, bar.High*0.9, bar.Low*0.9, bar.Close*0.9)c.plotcandle(bar.Open*0.9, bar.High*0.9, bar.Low*0.9, bar.Close*0.9)displayParâmetros opcionais:não , todos
-
sinal: Funções que não estão disponíveis na linguagem Pine são usadas aqui para desenhar sinais de compra e venda
sinal ((direção, preço, qty, id)
c.signal("long", bar.High, 1.5)c.signal("long", bar.High, 1.5)Parâmetro de entrada
"long"Indica a direcção da transacção, opcional"long","closelong","short","closeshort"O parâmetro de entradabar.Highé a posição do eixo Y do sinal do marcador.1.5representa o número de transações do sinal. O quarto parâmetro pode ser passado para substituir o conteúdo de texto desenhado por padrão. O texto padrão do marcador de sinal desenhado é a direção de negociação, por exemplo:"closelong".
Para algumas cores, estilos e outras configurações usadas nas chamadas de funções acima, consulteArtigo especial sobre desenho com a função KLineChart
LogReset ((()
LogReset()é usado para limpar logs. Você pode passar um parâmetro inteiro para especificar o número de logs recentes a serem retidos e limpar o restante dos logs. O log de inicialização é contado toda vez que é iniciado, portanto, se nenhum parâmetro for passado e não houver saída de log no início da estratégia, o log não será exibido, esperando o log docker retornar (não uma situação anormal).
function main() {
    // Mainta