Estratégia de linha de rastreamento

Visão geral
A estratégia de seguimento de linha é uma estratégia de acompanhamento de tendências baseada no indicador da faixa de Brin e no alcance real médio de oscilação (ATR). Ela ajusta dinamicamente a linha de julgamento de tendências, ajustando-se para cima quando a faixa de Brin é rompida e para baixo quando a faixa de Brin é rompida, para permitir o julgamento e o acompanhamento da tendência.
Princípio da estratégia
A estratégia primeiro calcula o trajeto ascendente e descendente da faixa de Bryn, bem como a faixa de flutuação real média. Em seguida, decide se o preço vai entrar ou sair da faixa de Bryn.
Quando o preço se abre, se o filtro ATR estiver ativado, a linha de determinação de tendência será definida como o preço mínimo menos o ATR; se o filtro ATR não estiver ativado, será definido diretamente como o preço mínimo.
Quando o preço se desvia, se o filtro ATR estiver ativado, a linha de determinação de tendência será configurada como o preço mais alto mais o ATR; Se o filtro ATR não estiver ativado, será configurado diretamente como o preço mais alto.
Dessa forma, a linha de julgamento de tendências pode ser ajustada dinamicamente de acordo com o preço quebrando o binário e descendo para baixo, permitindo assim o julgamento de tendências.
Quando a linha de julgamento da tendência atual é maior do que a linha de julgamento da tendência anterior, indica que a tendência atual está em alta; quando a linha de julgamento da tendência atual é menor do que a linha de julgamento da tendência anterior, indica que a tendência atual está em baixa.
Dependendo da tendência, a estratégia pode ser executada em várias operações de curto prazo.
Análise de vantagens
- A linha de avaliação de tendências de ajuste dinâmico permite a captura de tendências de preços de forma flexível
- A combinação com o indicador BRI permite a detecção de uma reversão de tendência em caso de ruptura de preços.
- Introdução do parâmetro ATR, que permite filtrar os sinais de false breakout
Análise de Riscos
- A escolha incorreta dos parâmetros da faixa de Bryn pode levar a falsas rupturas frequentes
- ATRs selecionados em excesso podem levar a oportunidades perdidas de reversão de tendência
- A necessidade de considerar a suspensão de prejuízos para evitar os danos causados por situações extremas
Pode-se evitar parte do risco por meio de ajustes de parâmetros, introdução de stop loss. Também pode ser filtrado em combinação com outros indicadores, aumentando a eficácia da ruptura.
Direção de otimização
- Optimizar os parâmetros de Brinks e ATR para encontrar a melhor configuração
- Adição de outros critérios para filtrar falsos avanços
- Ciclo de Brincadeira e Ciclo ATR para variedades específicas de transação
Resumir
A estratégia de acompanhamento de linha se dedica a capturar tendências de preços em situações de volatilidade. É uma estratégia eficaz de acompanhamento de tendências.
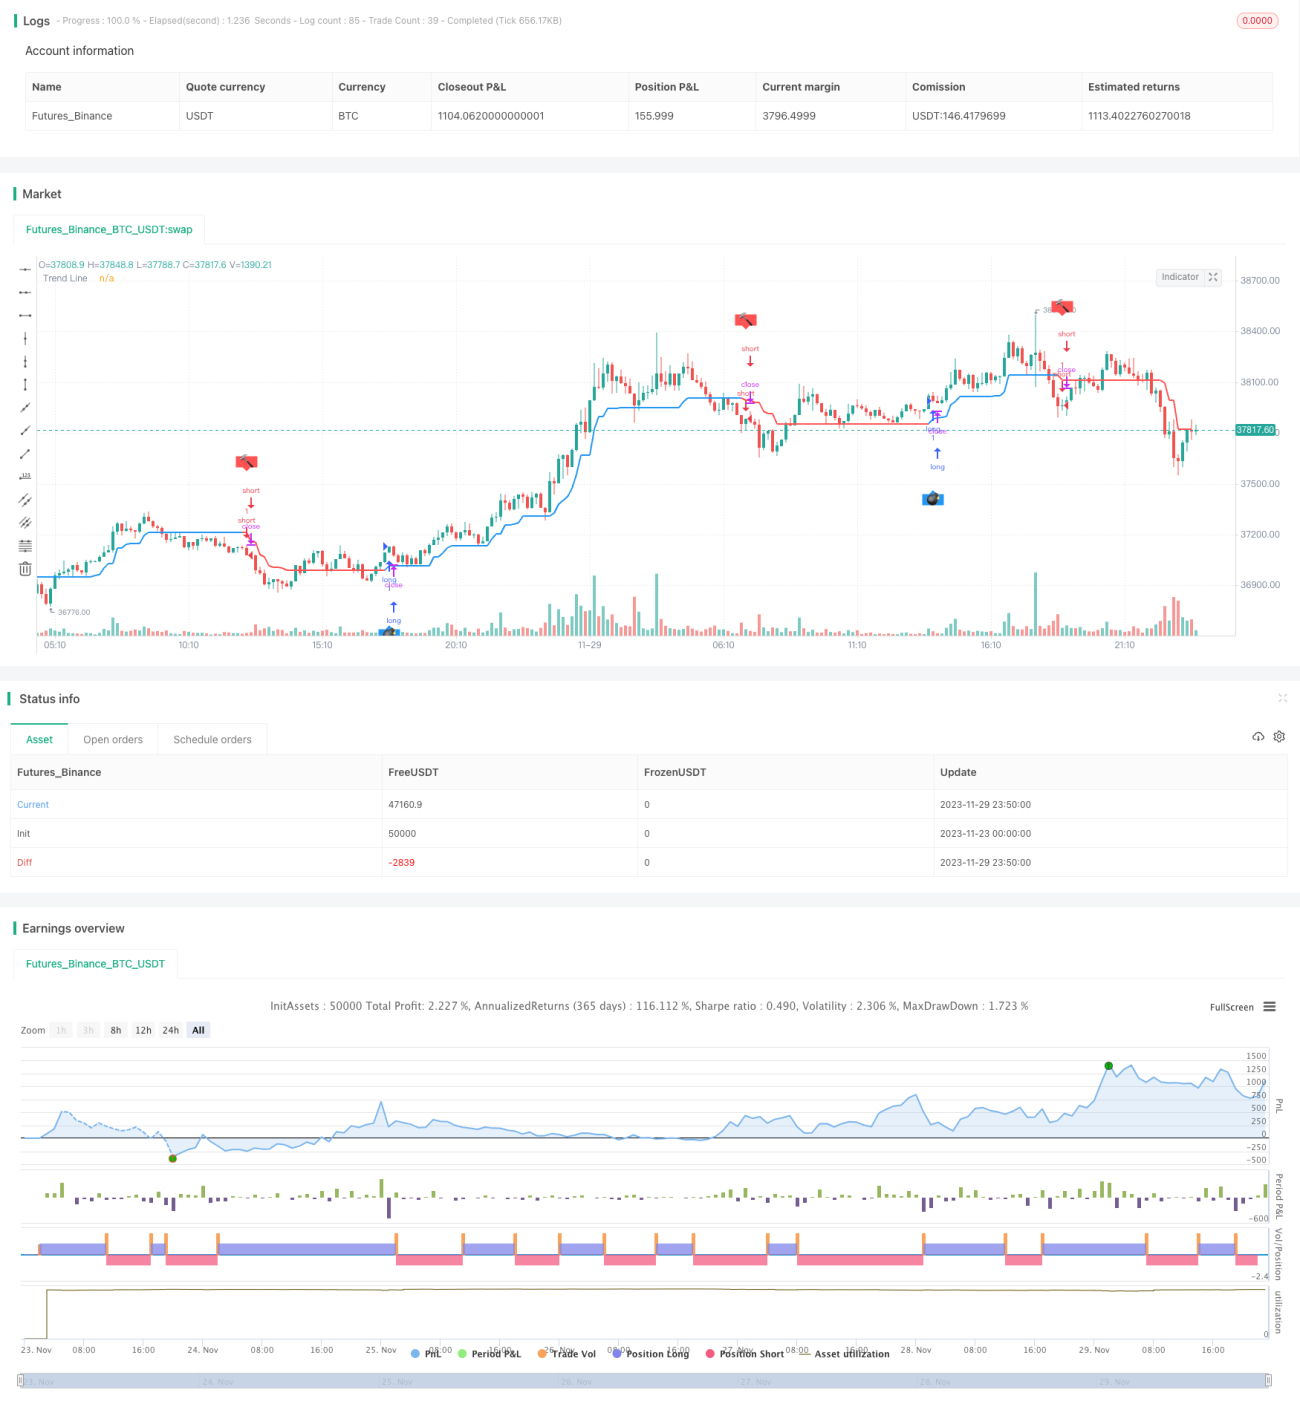
/*backtest
start: 2023-11-23 00:00:00
end: 2023-11-30 00:00:00
period: 10m
basePeriod: 1m
exchanges: [{"eid":"Futures_Binance","currency":"BTC_USDT"}]
*/

// © Dreadblitz
//@version=4
//
// ▒▒▒▒▒▒▒▒▒▒▒▒▒▒▒▒▒▒▒▒▒▒▒▒▒▒▒▒▒▒▒▒▒▒▒▒▒▒▒▒▒▒▒▒▒▒▒▒▒▒▒▒▒▒▒▒▒▒▒▒▒▒▒▒▒▒▒▒▒▒▒▒▒▒▒▒▒▒▒▒▒▒▒▒▒▒▒▒▒▒▒▒▒▒▒▒▒▒▒▒▒▒▒▒▒▒▒▒▒▒▒▒▒▒ //- 1