Новичок, проверьте это Возьмём вас на криптовалютный количественный трейдинг (5)
Автор:Нинабадасс., Создано: 2022-04-18 17:20:53, Обновлено: 2022-04-18 17:30:27Новичок, проверьте это Возьмём вас на криптовалютный количественный трейдинг (5)
В предыдущей статье мы объяснили анализ логики торговли простой сетевой стратегии.
-
Анализ логики торговли Как мы упоминали в предыдущей статье, если вы пересекаете каждую линию сетки сетки и судите, что текущая цена пересекает линию сетки вверх или вниз, торговое действие может быть инициировано.
Первая деталь, которую мы должны рассмотреть, это дизайн бесконечной сетки.
createNetЭта функция генерирует структуру данных сетки с конечным количеством линий сетки. Так что, если, когда стратегия работает, цена выходит за пределы этой структуры данных сетки (за пределы верхней линии сетки, где цена самая высокая, и нижней линии сетки, где цена самая низкая)? Итак, сначала нам нужно добавить механизм расширения структуры данных сетки.Начните писать основную функцию стратегии, и основная функция - это код, в котором стратегия начинает выполняться.
var diff = 50                                 // global variable, the grid interval, can be designed as parameter; for an easy explanation, we write it in an infinite loop
function main() {
    // After the bot starts running, execute the strategy code from here
    var ticker = _C(exchange.GetTicker)       // obtain the latest ticker data in the market; for the ticker data structure, you can refer to FMZ API documentation: https://www.fmz.com/api#ticker
    var net = createNet(ticker.Last, diff)    // the function to initially construct the grid data structure we designed in the previous article; here we construct a grid data structure net

    while (true) {                            // then, the program logic enters the while infinite loop, and the strategy will repeatedly execute the code within the {} symbol from here
        ticker = _C(exchange.GetTicker)       // the first line of the infinite loop code gets the latest market quote data, and updates it to the variable ticker
        // check the grid range
        while (ticker.Last >= net[net.length - 1].price) {
            net.push({
                buy : false,
                sell : false,
                price : net[net.length - 1].price + diff,
            })
        }
        while (ticker.Last <= net[0].price) {
            var price = net[0].price - diff
            if (price <= 0) {
                break
            }
            net.unshift({
                buy : false,
                sell : false,
                price : price,
            })
        }

        // the code is not completed...
    }
}
Это код, который делает структуру данных сетки расширяемой (выдержан из кода выше):
      // check the grid range
      while (ticker.Last >= net[net.length - 1].price) {   // if the price exceeds the grid line with the highest price in the grid,
          net.push({                                       // add a new grid line after the grid line with the highest price in the grid
              buy : false,                                 // initialize the sell mark
              sell : false,                                // initialize the buy mark
              price : net[net.length - 1].price + diff,    // add a grid interval on the basis of the previous highest price
          })
      }
      while (ticker.Last <= net[0].price) {                // if the price is lower than the grid line with the lowest price in the grid,
          var price = net[0].price - diff                  // distinguished from adding upwards, you should notice the price of the newly added grid line downwards cannot be less than or equal to 0, so you need to judge here
          if (price <= 0) {                                // do not add when the price is less than or equal to 0, and break the loop
              break
          }
          net.unshift({                                    // add a new grid line before the grid line with the lowest price in the grid
              buy : false,
              sell : false,
              price : price,
          })
      }
Далее, нам нужно рассмотреть, как реализовать триггер торговли.
var diff = 50
var amount = 0.002       // add a global variable, which can also be designed as a parameter; for easy explanation, we can write it in an infinite loop
                         // the parameter controls the trading amount on the grid line each time the trading is triggered
function main() {
    var ticker = _C(exchange.GetTicker)
    var net = createNet(ticker.Last, diff)
    var preTicker = ticker       // before the start of the main (infinite) loop, set a variable, to record the market quotes of last time
    while (true) {
        ticker = _C(exchange.GetTicker)
        // check the grid range
        while (ticker.Last >= net[net.length - 1].price) {
            net.push({
                buy : false,
                sell : false,
                price : net[net.length - 1].price + diff,
            })
        }
        while (ticker.Last <= net[0].price) {
            var price = net[0].price - diff
            if (price <= 0) {
                break
            }
            net.unshift({
                buy : false,
                sell : false,
                price : price,
            })
        }

        // index the grid
        for (var i = 0 ; i < net.length ; i++) {     // traverse all grid lines in the grid data structure
            var p = net[i]
            if (preTicker.Last < p.price && ticker.Last > p.price) {         // upcross, and sell; when the current node has been traded, no matter SELL or BUY, no more trade
                if (i != 0) {
                    var downP = net[i - 1]
                    if (downP.buy) {
                        exchange.Sell(-1, amount, ticker)
                        downP.buy = false
                        p.sell = false
                        continue
                    }
                }
                if (!p.sell && !p.buy) {
                    exchange.Sell(-1, amount, ticker)
                    p.sell = true
                }
            } else if (preTicker.Last > p.price && ticker.Last < p.price) {  // downcross, and buy
                if (i != net.length - 1) {
                    var upP = net[i + 1]
                    if (upP.sell) {
                        exchange.Buy(-1, amount * ticker.Last, ticker)
                        upP.sell = false
                        p.buy = false
                        continue
                    }
                }
                if (!p.buy && !p.sell) {
                    exchange.Buy(-1, amount * ticker.Last, ticker)
                    p.buy = true
                }
            }
        }
        preTicker = ticker    // record the current market quotes in preTicker, which will be used as the "last" market quote data to compare with the new one in next loop, to judge upcross and downcross
        Sleep(500)
    }
}
Вы можете видеть:
- состояние пересечения линии сети:
preTicker.Last < p.price && ticker.Last > p.price - состояние пересечения линии сети:
preTicker.Last > p.price && ticker.Last < p.price
Об этом мы говорили в предыдущей статье:
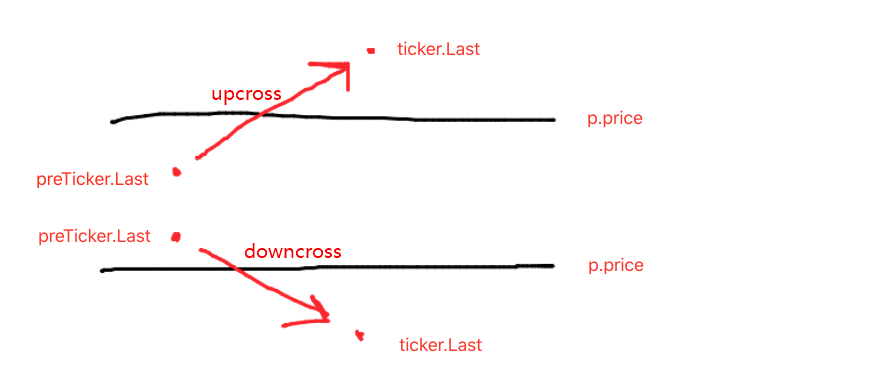
Суждение о пересечении вверх или вниз - это только первый шаг, чтобы определить, следует ли заказывать и торговать, и также необходимо судить о знаке в данных линии сетки.
Если он вверх, то судите, является ли цена ниже текущей сетевой линии, а также знака покупки на последней сетевой линии; если значение знака покупки верно, это означает, что последняя сетевая линия выполнена покупкой, и сбросить знак покупки последней сетевой линии на ложь, и сбросить знак продажи текущей сетевой линии на ложь.
Если знак покупки и знак продажи текущей сетевой линии являются ложными, это означает, что текущая сетевая линия может торговать; поскольку она пересечена, здесь мы выполняем операцию продажи и отмечаем знак продажи сетевой линии как истинный после выполнения.
Логика обработки нисходящего креста такая же. (новички могут подумать об этом сами.)
- состояние пересечения линии сети:
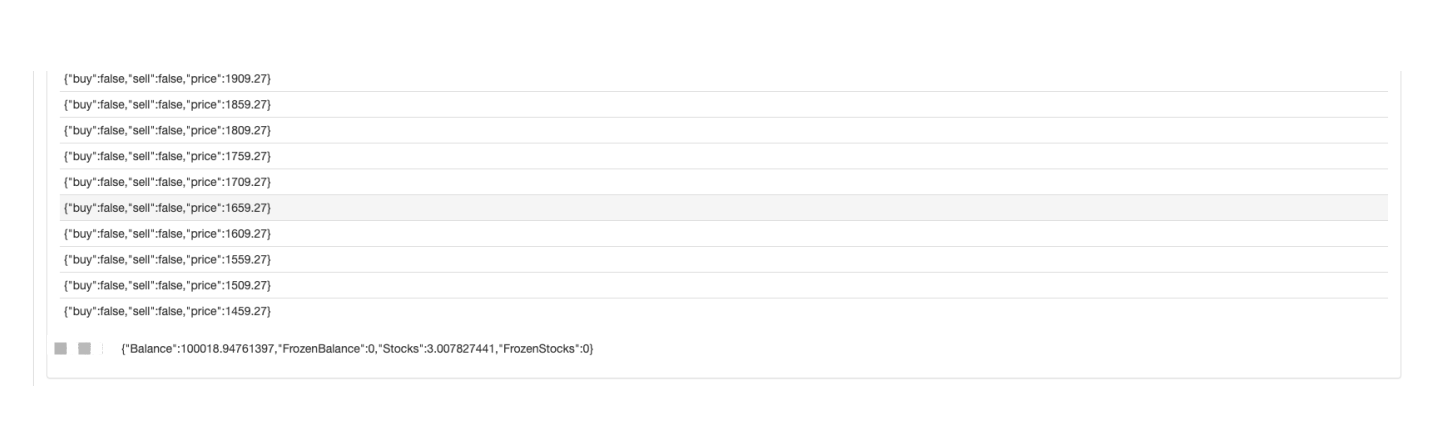
Полный тест стратегии
Для того, чтобы увидеть некоторые данные во время backtest, функцияshowTblнаписано для отображения данных.
function showTbl(arr) {
    var tbl = {
        type : "table",
        title : "grid",
        cols : ["grid information"],
        rows : []
    }
    var arrReverse = arr.slice(0).reverse()
    _.each(arrReverse, function(ele) {
        var color = ""
        if (ele.buy) {
            color = "#FF0000"
        } else if (ele.sell) {
            color = "#00FF00"
        }
        tbl.rows.push([JSON.stringify(ele) + color])
    })
    LogStatus(_D(), "\n`" + JSON.stringify(tbl) + "`", "\n account information:", exchange.GetAccount())
}
Полный код стратегии:
/*backtest
start: 2021-04-01 22:00:00
end: 2021-05-22 00:00:00
period: 1d
basePeriod: 1m
exchanges: [{"eid":"OKEX","currency":"ETH_USDT","balance":100000}]
*/

var diff = 50
var amount = 0.002
function createNet(begin, diff) {
    var oneSideNums = 10
    var up = []
    var down = []
    for (var i = 0 ; i < oneSideNums ; i++) {
        var upObj = {
            buy : false,
            sell : false,
            price : begin + diff / 2 + i * diff,
        }
        up.push(upObj)

        var j = (oneSideNums - 1) - i
        var downObj = {
            buy : false,
            sell : false,
            price : begin - diff / 2 - j * diff,
        }
        if (downObj.price <= 0) {  // the price cannot be less than or equal to 0
            continue
        }
        down.push(downObj)
    }

    return down.concat(up)
}

function showTbl(arr) {
    var tbl = {
        type : "table",
        title : "grid",
        cols : ["grid information"],
        rows : []
    }
    var arrReverse = arr.slice(0).reverse()
    _.each(arrReverse, function(ele) {
        var color = ""
        if (ele.buy) {
            color = "#FF0000"
        } else if (ele.sell) {
            color = "#00FF00"
        }
        tbl.rows.push([JSON.stringify(ele) + color])
    })
    LogStatus(_D(), "\n`" + JSON.stringify(tbl) + "`", "\n account information:", exchange.GetAccount())
}

function main() {
    var ticker = _C(exchange.GetTicker)
    var net = createNet(ticker.Last, diff)
    var preTicker = ticker
    while (true) {
        ticker = _C(exchange.GetTicker)
        // check the grid range
        while (ticker.Last >= net[net.length - 1].price) {
            net.push({
                buy : false,
                sell : false,
                price : net[net.length - 1].price + diff,
            })
        }
        while (ticker.Last <= net[0].price) {
            var price = net[0].price - diff
            if (price <= 0) {
                break
            }
            net.unshift({
                buy : false,
                sell : false,
                price : price,
            })
        }

        // index grid
        for (var i = 0 ; i < net.length ; i++) {
            var p = net[i]
            if (preTicker.Last < p.price && ticker.Last > p.price) {         // upcross, and sell; when the current node has been traded, no matter SELL or BUY, no more trade
                if (i != 0) {
                    var downP = net[i - 1]
                    if (downP.buy) {
                        exchange.Sell(-1, amount, ticker)
                        downP.buy = false
                        p.sell = false
                        continue
                    }
                }
                if (!p.sell && !p.buy) {
                    exchange.Sell(-1, amount, ticker)
                    p.sell = true
                }
            } else if (preTicker.Last > p.price && ticker.Last < p.price) {  // downcross, and buy
                if (i != net.length - 1) {
                    var upP = net[i + 1]
                    if (upP.sell) {
                        exchange.Buy(-1, amount * ticker.Last, ticker)
                        upP.sell = false
                        p.buy = false
                        continue
                    }
                }
                if (!p.buy && !p.sell) {
                    exchange.Buy(-1, amount * ticker.Last, ticker)
                    p.buy = true
                }
            }
        }

        showTbl(net)
        preTicker = ticker
        Sleep(500)
    }
}
Стратегический тест:
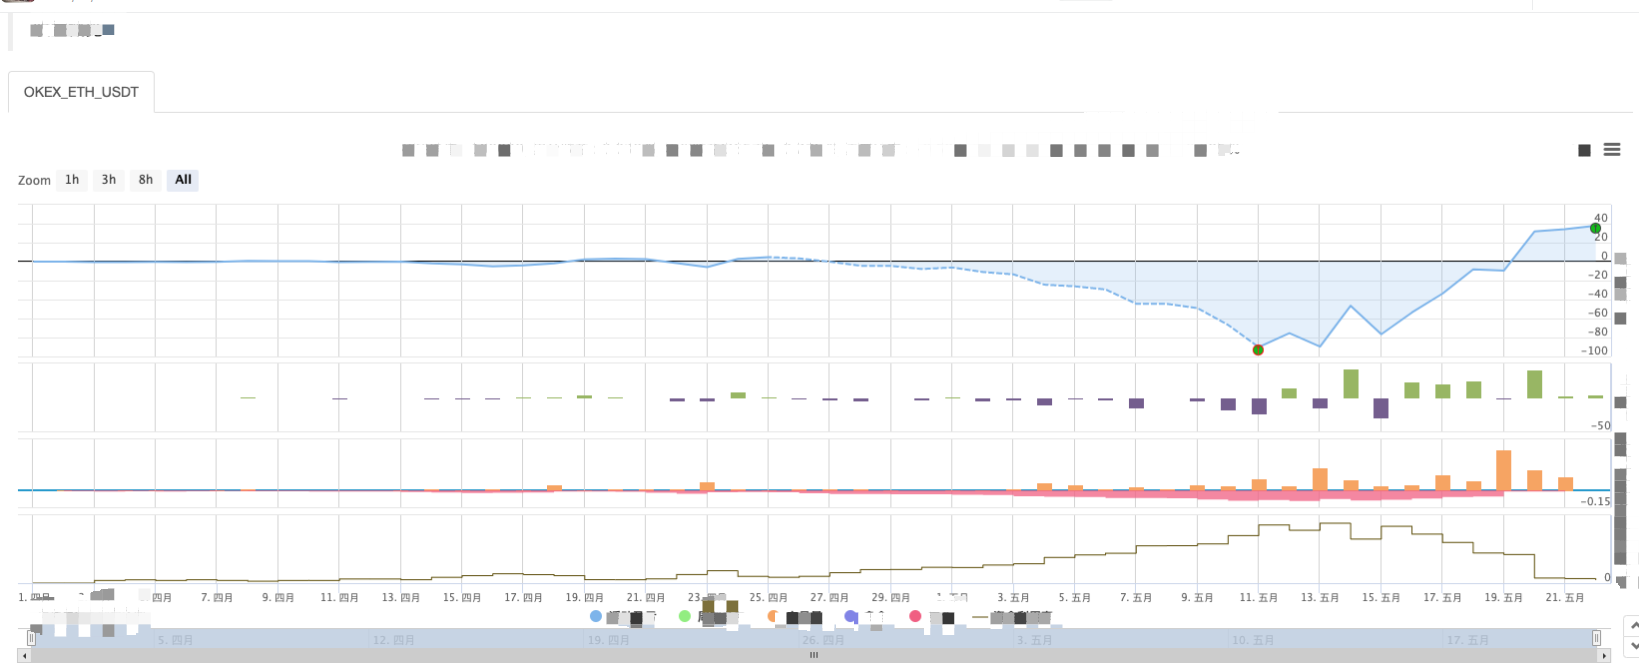
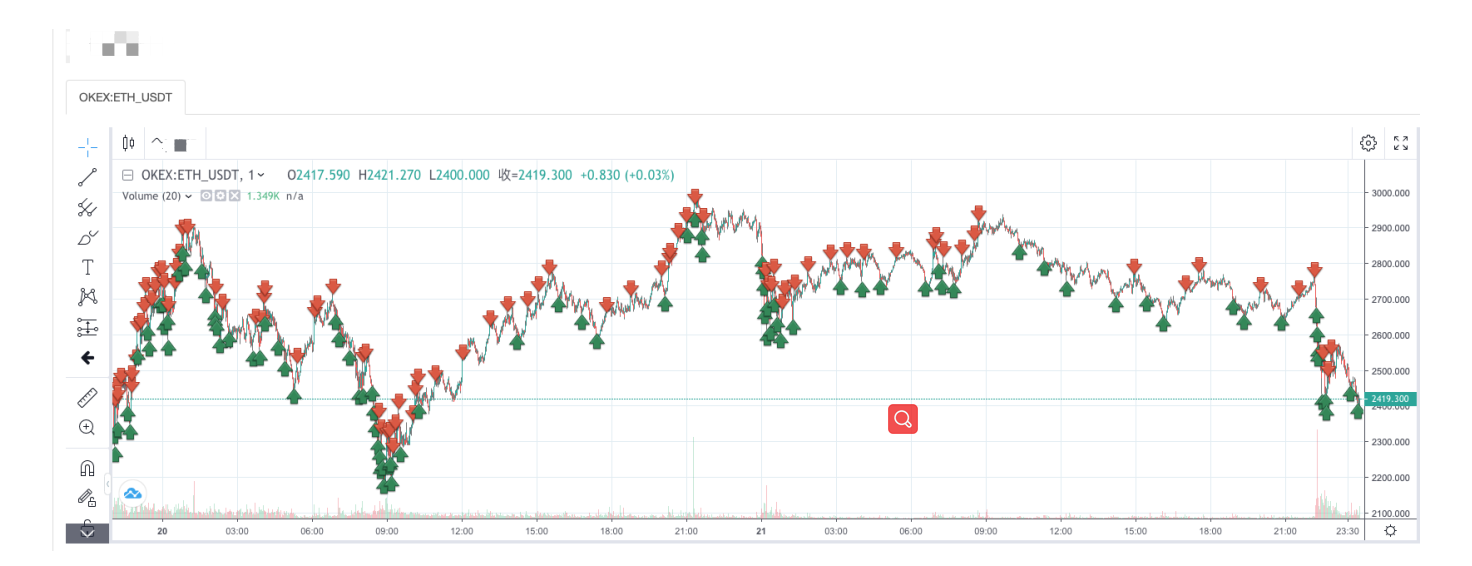
Вы можете увидеть характеристики стратегии сети. когда есть трендовый рынок, будет большой плавающий убыток, и доходность восстановится на волатильном рынке. Таким образом, сетевая стратегия не является безрисковой. Спотная стратегия все еще может сохраниться, чтобы сделать ее равной, в то время как сетевая стратегия фьючерсных контрактов более рискованна и должна консервативно устанавливать параметры сети.
- my язык, как здесь написать, чтобы получить сигнал, напечатать и вывести один раз
- Динамическое дельта-хеджирование опционов на дерибит
- Использование SQLite для создания квантовой базы данных FMZ
- Новички, проверьте
Возьмём вас на криптовалютный количественный трейдинг (8) - Новичок, проверьте это
Возьмём вас на криптовалютный количественный трейдинг (7) - Новичок, проверьте это
Возьмём вас на криптовалютный количественный трейдинг (6) - Новичок, проверьте это
Возьмём вас на криптовалютный количественный трейдинг (3) - Новичок, проверьте это
Возьмём вас на криптовалютный количественный трейдинг (2) - Время моего изобретателя неправильное.
- Попробуйте придумать стратегию, чтобы найти бога!
- Новичок, проверьте это
Возьмем вас на криптовалютный количественный трейдинг (4) - Время создания и завершения заказов
- Мартин: Стратегия покупки
- Братья, которые понимают мой язык, помогите мне понять, что означает этот фрагмент кода.
- Вопросы по ошибкам в реальном времени
- Новичок, проверьте это
Возьмём вас на криптовалютный количественный трейдинг (1) - Можно ли добавить поддержку для Typescript?
- Стратегия спотового хеджирования криптовалют (2)
- Стратегия спецохеджирования криптовалют (1)
- В API Bitget возникают проблемы при размещении транзакций с ADA, AVAX, AXS, BCH, DOT, EOS, ETC, FIL, LINK, LTC, LUNA, MATIC, SOL, XRP.