
Эта стратегия основана на сверхмощных индексах с плавными подвижными средними и относительно сильными индексами, разработанными механизмом двойного трендового отслеживания, который позволяет точно определять тенденцию и установить разумную остановку для остановки убытков. Стратегия имеет такие характеристики, как остановка убытков и отслеживание тенденции, остановка в соответствии с тенденцией, двойная тенденция, которая позволяет эффективно контролировать риск отдельных сделок и получать сверхмощную прибыль в трендовых ситуациях.
Вычислить сверхмощный индексный скользящий средний ((Super Trend), определить направление основного тренда. Сверхмощный индексный скользящий средний позволяет точно определить направление тренда и дать идеальную точку входа.
Вычислить относительно сильный и слабый индекс (RSI), в качестве вспомогательного индикатора тренда. Высокий уровень RSI - это зона сверхпокупок, показывающая тенденцию бычьего рынка; низкий уровень RSI - зона сверхпродаж, показывающая тенденцию медвежьего рынка.
Сделайте больше, когда цена закрытия пересекает сверхмощную скользящую среднюю; сделайте пустоту, когда цена закрытия падает ниже сверхмощной скользящей средней.
Разумно устанавливать остановку убытков. Когда делается перерасчет, сверхмощная скользящая средняя скользящая средняя скользящая средняя скользящая средняя скользящая средняя скользящая средняя скользящая средняя скользящая средняя скользящая средняя скользящая средняя скользящая средняя скользящая средняя скользящая средняя скользящая средняя скользящая средняя скользящая средняя скользящая средняя скользящая средняя скользящая средняя скользящая средняя скользящая средняя скользящая средняя скользящая средняя скользящая средняя скользящая средняя скользящая средняя скользящая средняя скользящая средняя скользящая средняя скользящая средняя скользящая средняя скользящая средняя скользящая средняя скользящая средняя скользящая средняя скользящая средняя скользящая средняя скользящая средняя ско
Стоп-стоп-линия будет плавать в зависимости от колебаний рынка. Если рынок будет развиваться в благоприятном направлении, то стоп-стоп-линия будет двигаться в благоприятном направлении, обеспечивая прибыль.
Когда RSI совпадает с направлением сверхмощных скользящих средних индексов, это означает, что в настоящее время тенденция сильна, и тогда стратегия вступает в игру. Когда RSI не совпадает с направлением сверхмощных скользящих средних индексов, это означает, что тенденция может измениться, и тогда стратегия временно выходит из игры
Двойные механизмы определения тенденций, которые позволяют уменьшить ошибочные сигналы и повысить стабильность стратегии.
Точка остановки движется в соответствии с трендом, что позволяет максимально закрепить прибыль и избежать преждевременного остановки.
Использование RSI позволяет отфильтровать некоторые слабые торговые сигналы.
Разумная установка стоп-позиции, чтобы максимизировать прибыль
Параметры стратегии регулируются и могут быть оптимизированы в зависимости от разных видов и особенностей ситуации.
Управляемый стратегический отказ, более эффективный риск-менеджмент.
В случае внезапных событий, таких как важные политические новости, рынок может сильно колебаться, что приводит к преодолению остановки, что приводит к большим убыткам. Можно соответствующим образом ослабить остановку или вовремя покинуть поле до наступления крупного рискованного события.
Неправильная настройка параметров может привести к необоснованному установлению стоп-стоп-стоп, увеличению убытков или сокращению прибыли. Можно найти оптимальную комбинацию параметров путем повторного отбора.
Во время фазы многополосного смешения RSI и сверхмощные индексы могут отклоняться от скользких скользящих средних, что приводит к неправильным торговым сигналам. В этом случае можно временно не торговать, ожидая очевидных тенденций.
Оптимизация параметров цикла ATR, чтобы лучше соответствовать характеристикам разных сортов.
Оптимизация параметров RSI, чтобы найти более стабильные и надежные вспомогательные условия для определения тренда.
В сочетании с другими показателями, такими как Брин-лента, KDJ и т. д., устанавливается более точная основа для вступления и выхода из игры.
Тестирование различных стратегий блокировки, таких как блокировки слежения, блокировки лестницы, блокировки теней и т. д., для оптимизации уровня прибыли.
Применение стратегии управления позициями в зависимости от результатов обратной проверки, снижение риска для отдельных сделок.
В целом, эта стратегия обладает высокой стабильностью и устойчивой рентабельностью. Двойные механизмы определения тенденций могут эффективно фильтровать шум, а стратегия остановки убытков может блокировать прибыль и контролировать риск.
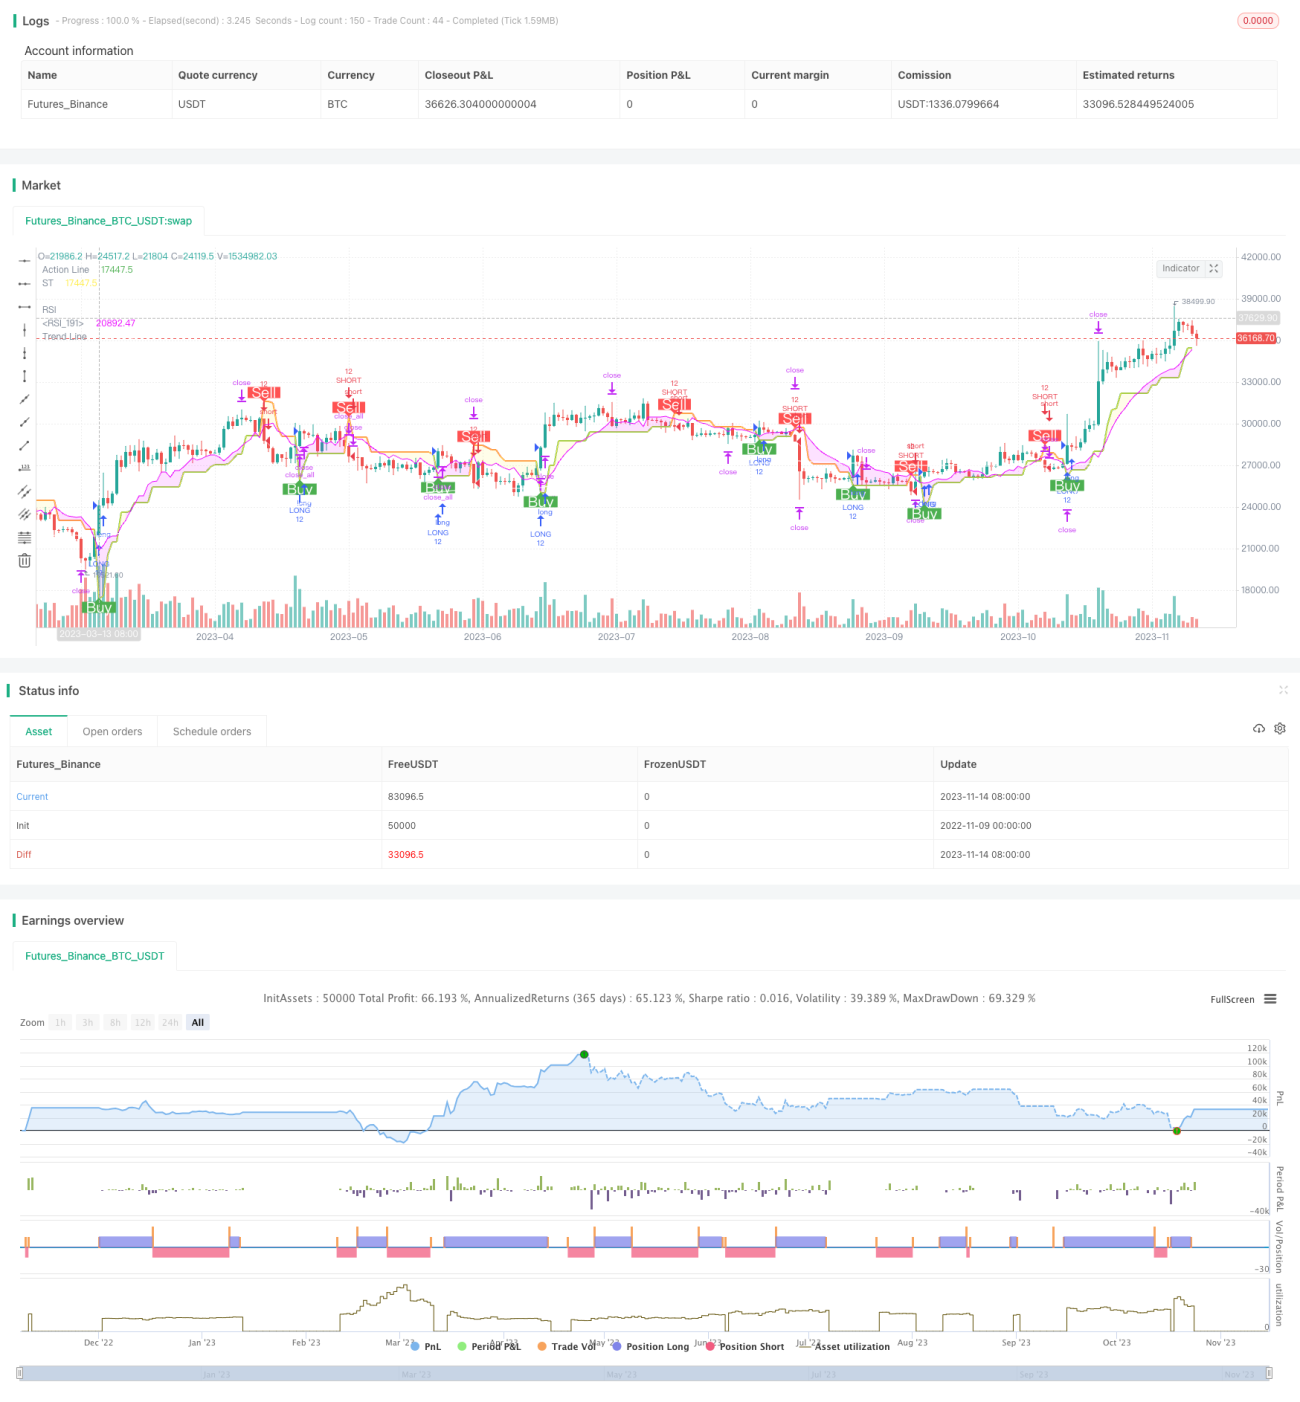
/*backtest
start: 2022-11-09 00:00:00
end: 2023-11-15 00:00:00
period: 1d
basePeriod: 1h
exchanges: [{"eid":"Futures_Binance","currency":"BTC_USDT"}]
*/
//@version=5
//
// ▒▒▒▒▒▒▒▒▒▒▒▒▒▒▒▒▒▒▒▒▒▒▒▒▒▒▒▒▒▒▒▒▒▒▒▒▒▒▒▒▒▒▒▒▒▒▒▒▒▒▒▒▒▒▒▒▒▒▒▒▒▒▒▒▒▒▒▒▒▒▒▒▒▒▒▒▒▒▒▒▒▒▒▒▒▒▒▒▒▒▒▒▒▒▒▒▒▒▒▒▒▒▒▒▒▒▒▒▒▒▒▒▒▒
// -----------------------------------------------------------------------------
// Copyright 2019 Mauricio Pimenta | exit490
// SuperTrend with Trailing Stop Loss script may be freely distributed under the MIT license.
//
// Permission is hereby granted, free of charge,
// to any person obtaining a copy of this software and associated documentation files (the "Software"),
// to deal in the Software without restriction, including without limitation the rights to use, copy, modify, merge,
// publish, distribute, sublicense, and/or sell copies of the Software, and to permit persons to whom the Software is furnished to do so,
// subject to the following conditions:
//
// The above copyright notice and this permission notice shall be included in all copies or substantial portions of the Software.
//
// THE SOFTWARE IS PROVIDED "AS IS", WITHOUT WARRANTY OF ANY KIND,
// EXPRESS OR IMPLIED, INCLUDING BUT NOT LIMITED TO THE WARRANTIES OF MERCHANTABILITY,
// FITNESS FOR A PARTICULAR PURPOSE AND NONINFRINGEMENT. IN NO EVENT SHALL THE AUTHORS OR COPYRIGHT HOLDERS BE LIABLE FOR ANY CLAIM,
// DAMAGES OR OTHER LIABILITY, WHETHER IN AN ACTION OF CONTRACT, TORT OR OTHERWISE, ARISING FROM,
// OUT OF OR IN CONNECTION WITH THE SOFTWARE OR THE USE OR OTHER DEALINGS IN THE SOFTWARE.
//
// -----------------------------------------------------------------------------
//
// Authors: @exit490
// Revision: v1.0.0
// Date: 5-Aug-2019
//
// Description
// ===========
// SuperTrend is a moving stop and reversal line based on the volatility (ATR).
// The strategy will ride up your stop loss when price moviment 1%.
// The strategy will close your operation when the market price crossed the stop loss.
// The strategy will close operation when the line based on the volatility will crossed
//
// The strategy has the following parameters:
//
// INITIAL STOP LOSS - Where can isert the value to first stop.
// POSITION TYPE - Where can to select trade position.
// ATR PERIOD - To select number of bars back to execute calculation
// ATR MULTPLIER - To add a multplier factor on volatility
// BACKTEST PERIOD - To select range.
//
// -----------------------------------------------------------------------------
// Disclaimer:
// 1. I am not licensed financial advisors or broker dealers. I do not tell you
// when or what to buy or sell. I developed this software which enables you
// execute manual or automated trades multplierFactoriplierFactoriple trades using TradingView. The
// software allows you to set the criteria you want for entering and exiting
// trades.
// 2. Do not trade with money you cannot afford to lose.
// 3. I do not guarantee consistent profits or that anyone can make money with no
// effort. And I am not selling the holy grail.
// 4. Every system can have winning and losing streaks.
// 5. Money management plays a large role in the results of your trading. For
// example: lot size, account size, broker leverage, and broker margin call
// rules all have an effect on results. Also, your Take Profit and Stop Loss
// settings for individual pair trades and for overall account equity have a
// major impact on results. If you are new to trading and do not understand
// these items, then I recommend you seek education materials to further your
// knowledge.
//
// YOU NEED TO FIND AND USE THE TRADING SYSTEM THAT WORKS BEST FOR YOU AND YOUR
// TRADING TOLERANCE.
//
// I HAVE PROVIDED NOTHING MORE THAN A TOOL WITH OPTIONS FOR YOU TO TRADE WITH THIS PROGRAM ON TRADINGVIEW.
//
// I accept suggestions to improve the script.
// If you encounter any problems I will be happy to share with me.
// -----------------------------------------------------------------------------
//
// ▒▒▒▒▒▒▒▒▒▒▒▒▒▒▒▒▒▒▒▒▒▒▒▒▒▒▒▒▒▒▒▒▒▒▒▒▒▒▒▒▒▒▒▒▒▒▒▒▒▒▒▒▒▒▒▒▒▒▒▒▒▒▒▒▒▒▒▒▒▒▒▒▒▒▒▒▒▒▒▒▒▒▒▒▒▒▒▒▒▒▒▒▒▒▒▒▒▒▒▒▒▒▒▒▒▒▒▒▒▒▒▒▒▒ //
strategy(title='DEO SESSSION', shorttitle='DEO S', overlay=true, precision=8, calc_on_order_fills=true, calc_on_every_tick=true, backtest_fill_limits_assumption=0, default_qty_type=strategy.percent_of_equity, default_qty_value=100, initial_capital=1000, currency=currency.USD, linktoseries=true)
//
// ▒▒▒▒▒▒▒▒▒▒▒▒▒▒▒▒▒▒▒▒▒▒▒▒▒▒▒▒▒▒▒▒▒▒▒▒▒▒▒▒▒▒▒▒▒▒▒▒▒▒▒▒▒▒▒▒▒▒▒▒▒▒▒▒▒▒▒▒▒▒▒▒▒▒▒▒▒▒▒▒▒▒▒▒▒▒▒▒▒▒▒▒▒▒▒▒▒▒▒▒▒▒▒▒▒▒▒▒▒▒▒▒▒▒ //
// === BACKTEST RANGE ===
backTestSectionFrom = input(title='════════════ FROM ════════════', defval=true)
// selected dates
i_startTime = input(title="START FILTER", defval=timestamp("02 Jan 2023 00:00 +0000"), group="RISK MANAGEMENT", tooltip="Start date & time to begin searching for setups")
i_endTime = input(title="END FILTER", defval=timestamp("12 Dec 2100 00:00 +0000"), group="RISK MANAGEMENT", tooltip="End date & time to stop searching for setups")
afterStartDate = true
//
// ▒▒▒▒▒▒▒▒▒▒▒▒▒▒▒▒▒▒▒▒▒▒▒▒▒▒▒▒▒▒▒▒▒▒▒▒▒▒▒▒▒▒▒▒▒▒▒▒▒▒▒▒▒▒▒▒▒▒▒▒▒▒▒▒▒▒▒▒▒▒▒▒▒▒▒▒▒▒▒▒▒▒▒▒▒▒▒▒▒▒▒▒▒▒▒▒▒▒▒▒▒▒▒▒▒▒▒▒▒▒▒▒▒▒ //
parameterSection = input(title='══════════ STRATEGY ══════════', defval=true)
// === INPUT TO SELECT POSITION ===
positionType = input.string(defval='LONG', title='Position Type', options=['LONG', 'SHORT'])
// === INPUT TO SELECT INITIAL STOP LOSS
initialStopLossPercent = input.float(defval=3.0, minval=0.0, title='Initial Stop Loss')
// === INPUT TO SELECT BARS BACK
barsBack = input(title='ATR Period', defval=1)
// === INPUT TO SELECT MULTPLIER FACTOR
multplierFactor = input.float(title='ATR multplierFactoriplier', step=0.1, defval=3.0)
RSI = input.int(title='RSI', defval=7, minval=1, maxval=100)
calcSection = input(title='══════════ LOT CALC ══════════', defval=true)
accountBalance = input.float(title="ACCOUNT BALANCE", defval=250000, minval=1, group="INPUTS")
entryPrice = input.float(title="ENTRY PRICE", defval=100, minval=1, group="INPUTS")
slPrice = input.float(title="STOP LOSS PRICE", defval=100, minval=1, group="INPUTS")
riskPer = input.float(title="RISK USD", defval=1, minval=0.1, group="INPUTS")
lotSize = input.float(title="LOT SIZE", defval=10, minval=0.1, group="INPUTS")
RiskSize = riskPer
qtyLongTargetPrice = math.abs((RiskSize / ((entryPrice - slPrice) * syminfo.pointvalue)) / lotSize)
trendcSection = input(title='══════════ TREND LINE ══════════', defval=true)
// ema trend
tLen = input.int(200, minval=1, title="Trend Line")
tSrc = input(close, title="Source")
thisEma = ta.ema(tSrc, tLen)
plot(thisEma, title = "Trend Line",color=#ffffff)
MTSection = input(title='══════════ MT LOGIN ══════════', defval=true)
exchange = input.string(defval='MT5', title='EXCHANGE', options=['MT4', 'MT5'])
mtLogin= input.string(defval="", title='MT LOGIN', group = "mt")
mtPassword =input.string(defval='', title='MT PASSWORD', group = "mt")
mtServer =input.string(defval='', title='MT SERVER', group = "mt")
mtIsOn = input.string(defval='ON', title='STRATEGY ON', options=['ON', 'OFF'])
mtEntryMode = input.string(defval='CLOSE OPEN', title='ENTRY MODE', options=['CLOSE OPEN', 'OPEN'])
displaySection = input(title='══════════ DISPLAY LOGIN ══════════', defval=true)
displayTable = input(title="DISPLAY TABLE", defval=false, group = 'PRODUCTION', tooltip = "MAKES YOUR STRATEGY TRIGGER SLOWER")
//
// ▒▒▒▒▒▒▒▒▒▒▒▒▒▒▒▒▒▒▒▒▒▒▒▒▒▒▒▒▒▒▒▒▒▒▒▒▒▒▒▒▒▒▒▒▒▒▒▒▒▒▒▒▒▒▒▒▒▒▒▒▒▒▒▒▒▒▒▒▒▒▒▒▒▒▒▒▒▒▒▒▒▒▒▒▒▒▒▒▒▒▒▒▒▒▒▒▒▒▒▒▒▒▒▒▒▒▒▒▒▒▒▒▒▒ //
// LOGIC TO FIND DIRECTION WHEN THERE IS TREND CHANGE ACCORDING VOLATILITY
atr = multplierFactor * ta.atr(barsBack)
longStop = hl2 - atr
longStopPrev = nz(longStop[1], longStop)
longStop := close[1] > longStopPrev ? math.max(longStop, longStopPrev) : longStop
shortStop = hl2 + atr
shortStopPrev = nz(shortStop[1], shortStop)
shortStop := close[1] < shortStopPrev ? math.min(shortStop, shortStopPrev) : shortStop
direction = 1
direction := nz(direction[1], direction)
direction := direction == -1 and close > shortStopPrev ? 1 : direction == 1 and close < longStopPrev ? -1 : direction
longColor = color.blue
shortColor = color.blue
var valueToPlot = 0.0
var colorToPlot = color.white
if direction == 1
valueToPlot := longStop
colorToPlot := color.green
colorToPlot
else
valueToPlot := shortStop
colorToPlot := color.red
colorToPlot
//RSI
src = close
ep = 2 * RSI - 1
auc = ta.ema(math.max(src - src[1], 0), ep)
adc = ta.ema(math.max(src[1] - src, 0), ep)
x1 = (RSI - 1) * (adc * 70 / (100 - 70) - auc)
ub = x1 >= 0 ? src + x1 : src + x1 * (100 - 70) / 70
x2 = (RSI - 1) * (adc * 30 / (100 - 30) - auc)
lb = x2 >= 0 ? src + x2 : src + x2 * (100 - 30) / 30
//Affichage
plot(math.avg(ub, lb), color=color.white ,linewidth=1, title='RSI')
plot(valueToPlot == 0.0 ? na : valueToPlot, title='Action Line', linewidth=2, color=color.new(colorToPlot, 0))
plotshape(direction == 1 and direction[1] == -1 ? longStop : na, title='Buy', style=shape.labelup, location=location.absolute, size=size.normal, text='Buy', textcolor=color.new(color.white, 0), color=color.new(color.green, 0))
plotshape(direction == -1 and direction[1] == 1 ? shortStop : na, title='Sell', style=shape.labeldown, location=location.absolute, size=size.normal, text='Sell', textcolor=color.new(color.white, 0), color=color.new(color.red, 0))
p_ma1 = plot(valueToPlot, title = "ST", color = color.rgb(255, 236, 66))
p_ma2 = plot(math.avg(ub, lb), title = "RSI", color = color.rgb(234, 0, 255))
// Definitions: Trends
TrendUp1() =>
valueToPlot > math.avg(ub, lb)
TrendDown1() =>
valueToPlot < math.avg(ub, lb)
trendColor1 = TrendUp1() ? color.rgb(255, 236, 66, 85): TrendDown1() ? color.rgb(234, 0, 255, 85) : color.rgb(255, 255, 255, 85)
fill(p_ma1, p_ma2, color=trendColor1)
longCondition () =>
ta.crossover(close, valueToPlot)
shortCondition () =>
ta.crossunder(close, valueToPlot)
IsLongShort() =>
strategy.position_size != 0
getNewLotSize() =>
math.abs(riskPer / (close - valueToPlot))
// plot(getNewLotSize(), "new lot size")
newLotS = getNewLotSize()
alertManagement = str.tostring(exchange) + "," + str.tostring(mtLogin) + "," +str.tostring(mtPassword) + ","
alertManagement += str.tostring(mtServer) + "," + str.tostring(newLotS)
// alertManagement += str.tostring(stopLoss) + "," + str.tostring(applyingSL) + "," + str.tostring(applyTrailingStop) + ","
// alertManagement += str.tostring(exchange) + "," + str.tostring(exchangeAccount) + "," + str.tostring(slAmount) + "," + str.tostring(closeTpAmount) + ","
// alertManagement += str.tostring(exchangeLeverage) + "," + str.tostring(exchangeLeverageType) + ","
// alertManagement += str.tostring(mtLogin) + "," + str.tostring(mtPassword) + "," + str.tostring(mtServer) + "," + str.tostring(mtLot) + ","
// alertManagement += str.tostring(mtTp) + "," + str.tostring(mtTs) + "," + str.tostring(orderStrategy)
// alertManagement = "alertManagement"
myStop = 0.0
myTarget = 0.0
if (longCondition())
qtyLongTargetPrice := math.abs((RiskSize / ((close - valueToPlot) * syminfo.pointvalue)) / lotSize)
if IsLongShort()
strategy.close_all(comment = "close all entries")
strategy.entry("LONG", strategy.long, qty=12, comment="LONG", alert_message=alertManagement)
strategy.exit("TPL", "LONG", stop=valueToPlot, limit= close + (close - valueToPlot), comment="Target", alert_message=alertManagement)
if (shortCondition())
qtyLongTargetPrice := math.abs((RiskSize / ((close - valueToPlot) * syminfo.pointvalue)) / lotSize)
if IsLongShort()
strategy.close_all(comment = "close all entries")
strategy.entry("SHORT", strategy.short, qty=12, comment="SHORT", alert_message=alertManagement)
strategy.exit("TPS", "SHORT", stop=valueToPlot, limit= close + (close - valueToPlot), comment="Target", alert_message=alertManagement)
// Calculate the average profit per open trade
// avgProfit = profitSum / strategy.opentrades
getTotalProfit()=>
// Sum the profit of all open trades
profitSum = 0.0
for tradeNumber = 0 to strategy.closedtrades - 1
if strategy.closedtrades.profit(tradeNumber) > 0
profitSum += strategy.closedtrades.profit(tradeNumber)
result = profitSum
getTotalLoss()=>
// Sum the profit of all open trades
lossSum = 0.0
for tradeNumber = 0 to strategy.closedtrades - 1
if strategy.closedtrades.profit(tradeNumber) < 0
lossSum += strategy.closedtrades.profit(tradeNumber)
result = lossSum
maxLossRun()=>
lossRun = 0.0
currentMaxLoss = 0.0
for tradeNo = 0 to strategy.closedtrades - 1
if strategy.closedtrades.profit(tradeNo) < 0.0
lossRun += strategy.closedtrades.profit(tradeNo)
else
currentMaxLoss := math.min(currentMaxLoss, lossRun)
lossRun := 0.0
result = currentMaxLoss
TotalTrades() =>
strategy.closedtrades + strategy.opentrades
maxDrawDown() =>
maxDrawdown = 0.0
for tradeNo = 0 to strategy.closedtrades - 1
maxDrawdown := math.max(maxDrawdown, strategy.closedtrades.max_drawdown(tradeNo))
result = maxDrawdown
maxRunUp() =>
maxRunup = 0.0
for tradeNo = 0 to strategy.closedtrades - 1
maxRunup := math.max(maxRunup, strategy.closedtrades.max_runup(tradeNo))
result = maxRunup
tradeMaxLossReached() =>
maxLoss = 0.0
for tradeNo = 0 to strategy.closedtrades - 1
maxLoss := math.min(maxLoss, strategy.closedtrades.profit(tradeNo))
result = maxLoss
tradingStartTime() =>
strategy.closedtrades.entry_time(0)
daysBetween(t1, t2) => (t1 - t2) / 86400000
// Table
var InfoPanel = table.new(position = position.bottom_right, columns = 2, rows = 40, border_width = 1)
ftable(_table_id, _column, _row, _text, _bgcolor) =>
table.cell(_table_id, _column, _row, _text, 0, 0, color.black, text.align_right, text.align_center, size.small, _bgcolor)
tfString(int timeInMs) =>
// @function Produces a string corresponding to the input time in days, hours, and minutes.
// @param (series int) A time value in milliseconds to be converted to a string variable.
// @returns (string) A string variable reflecting the amount of time from the input time.
float s = timeInMs / 100000
float m = s / 60
float h = m / 60
float d = h / 24
float mo = d / 30.416
int tm = math.floor(m % 60)
int tr = math.floor(h % 24)
int td = math.floor(d % 30.416)
int tmo = math.floor(mo % 12)
int ys = math.floor(d / 365)
string result =
switch
d == 30 and tr == 10 and tm == 30 => "1M"
d == 7 and tr == 0 and tm == 0 => "1W"
=>
string yStr = ys ? str.tostring(ys) + "Y " : ""
string moStr = tmo ? str.tostring(tmo) + "M " : ""
string dStr = td ? str.tostring(td) + "D " : ""
string hStr = tr ? str.tostring(tr) + "H " : ""
string mStr = tm ? str.tostring(tm) + "min" : ""
yStr + moStr + dStr + hStr + mStr
if displayTable
maxLossRunInMarket= maxLossRun()
maxLossReached = tradeMaxLossReached()
tradeMaxLossReached = tradeMaxLossReached()
tradingInDays=daysBetween(time, tradingStartTime())
totalTrades=TotalTrades()