حکمت عملی کے بعد رفتار کا رجحان

1
Follow
1779
Followers
جائزہ
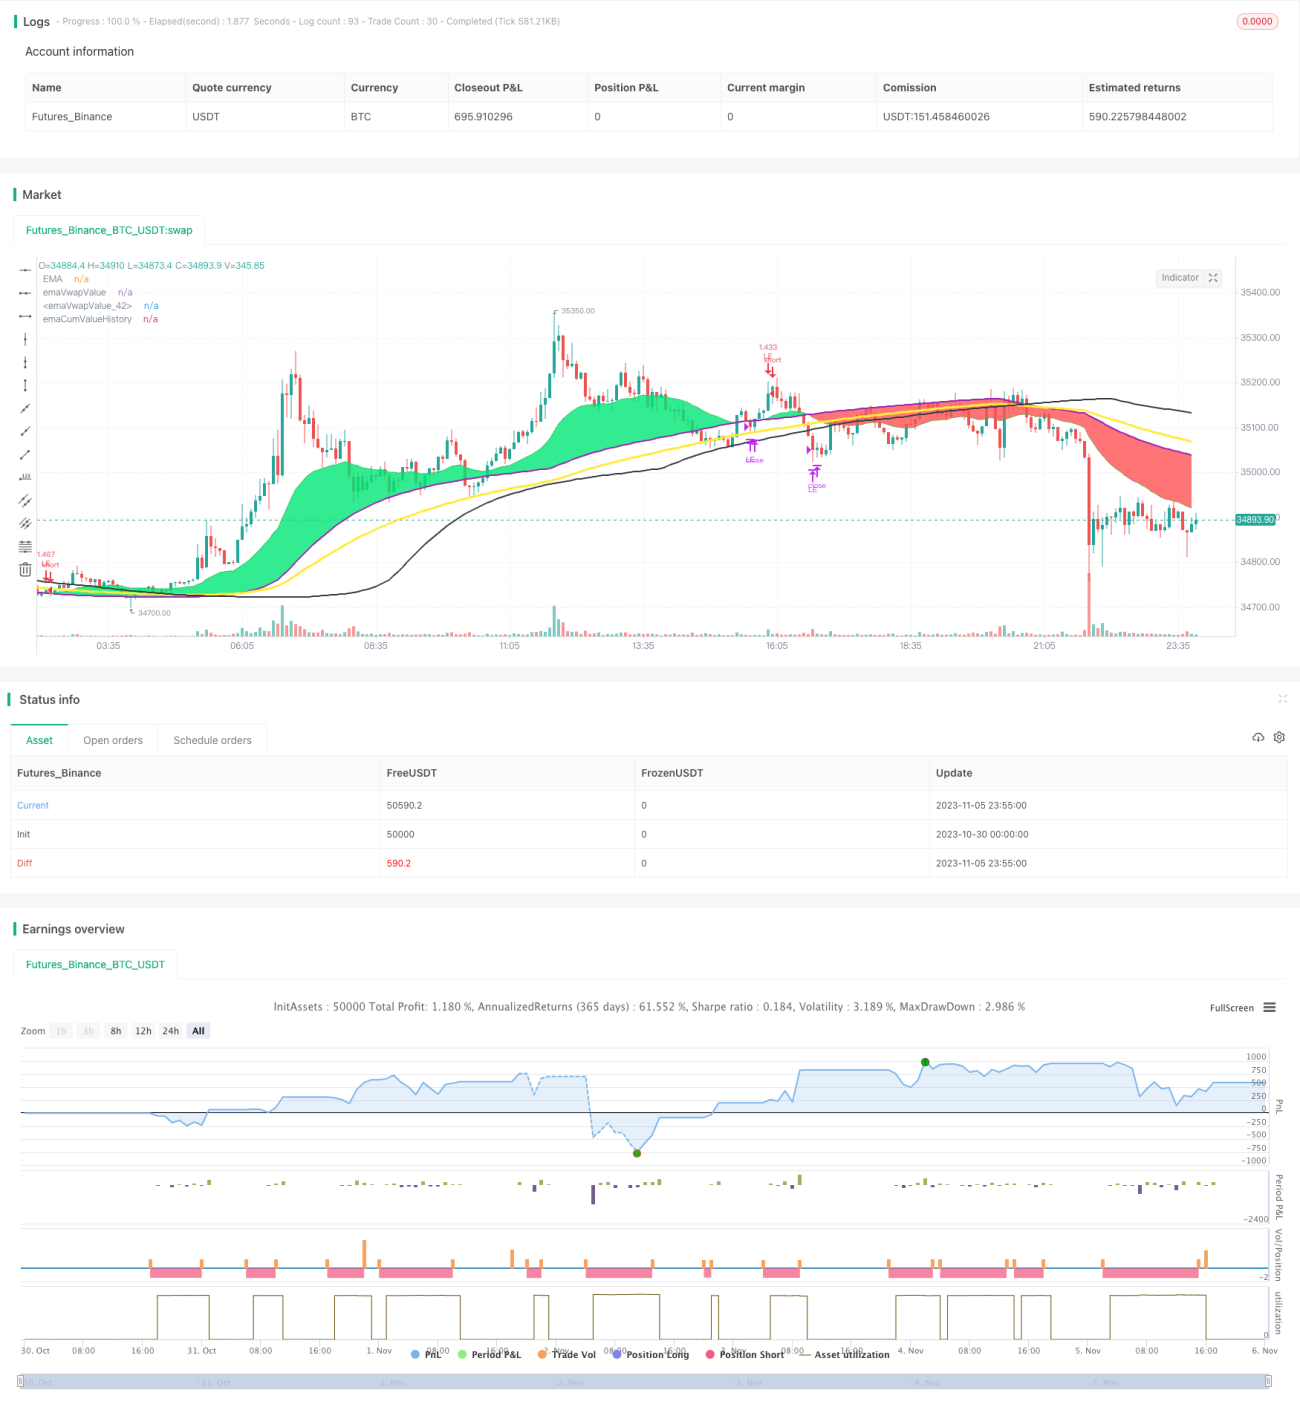
اس حکمت عملی میں ٹریڈنگ کے رجحانات کا تجزیہ کیا گیا ہے اور ٹریڈنگ کے رجحانات کی نشاندہی کی گئی ہے.
حکمت عملی کا اصول
- ای ایم اے کی اوسط اوسط قیمت اور تجارت کی اوسط اوسط اوسط قیمت کا حساب لگائیں
- جب EMA کو قریب سے پہنا جائے تو اس کو اوپر کی طرف جانے کا رجحان سمجھا جاتا ہے ، کثیر سر آپریشن کیا جاتا ہے
- جب یہ بڑھتا رہتا ہے تو ، قریب ہونے پر جمع EMA کی دوگنی اوسط لائن کو عبور کرتے وقت اضافی پوزیشن شامل کریں
- RSI اشارے کو ترتیب دیں اور جب RSI 90 سے زیادہ ہو تو 1 / 3 پوزیشنوں کو ختم کردیں
- جب ای ایم اے کے نیچے بند ہوجائیں تو اسے نیچے کی طرف جانے کا رجحان سمجھا جاتا ہے ، اور تمام اوور ہیڈ پوزیشنوں کو ختم کردیا جاتا ہے
- جب EMA سے نیچے قریب ہو تو ، نیچے کی طرف جانے کا فیصلہ کریں ، اور آپریشن کریں
- ایک سٹاپ نقصان کی لائن مقرر کریں، سٹاپ نقصان کی قیمت میں داخل ہونے کی ایک مقررہ فی صد کے طور پر
- خالی سر منافع کے لئے ایک ہی طریقہ ہے
طاقت کا تجزیہ
اس حکمت عملی کے اہم فوائد یہ ہیں:
- ای ایم اے اوسط سے رجحانات کا اندازہ لگانا ، رجحانات کو مؤثر طریقے سے ٹریک کرنا
- حقیقی رجحانات کا اندازہ لگانے کے لئے ٹرانزیکشن کی مقدار کا مجموعی EMA استعمال کریں
- RSI کی رفتار کی پیمائش کرنے کے لئے منافع بخش
- خطرے پر قابو پانے کے لئے ایک سٹاپ نقصان لائن
- مختلف حالات کے مطابق، لچکدار ایڈجسٹمنٹ پیرامیٹرز
خطرے کا تجزیہ
اس حکمت عملی کے اہم خطرات یہ ہیں:
- ای ایم اے اوسط لائن میں تاخیر پیدا ہوتی ہے ، ممکنہ طور پر موڑ کا نقطہ نظر سے محروم ہوجاتا ہے
- ٹرانزیکشن کی تعداد حقیقی رجحانات کی عکاسی نہیں کرتی
- فکسڈ فیصد سٹاپ نقصان بہت زیادہ میکانائزڈ ہوسکتا ہے
- پیرامیٹرز بہت زیادہ ہیں، ان کو ایڈجسٹ کرنا بہت مشکل ہے
- ٹرانزیکشن کی کثرت اور ٹرانزیکشن فیس کی زیادہ لاگت
خطرے سے نمٹنے کے طریقے:
- ای ایم اے پیرامیٹرز کو بہتر بنائیں اور تاخیر کو کم کریں
- دوسرے اشارے کے ساتھ مل کر ٹرانزیکشن سگنل کی تصدیق کریں
- مارکیٹ کے حالات کے مطابق سٹاپ نقصان کو بہتر بنائیں
- صرف بنیادی ترتیبات کو برقرار رکھنے کے لئے پیرامیٹرز کو آسان بنائیں
- اسٹاپ نقصان کی حد اور ٹریڈنگ کی فریکوئنسی میں مناسب نرمی
اصلاح کی سمت
اس حکمت عملی کو مندرجہ ذیل پہلوؤں سے بہتر بنایا جاسکتا ہے:
- مختلف EMA پیرامیٹرز کی ترتیبات کو آزمائیں اور بہترین پیرامیٹرز کا مجموعہ تلاش کریں
- VOLUME ضرب کو بڑھانے کے طور پر آنے والے سگنل کی طاقت کا فیصلہ
- ایم اے سی ڈی ، کے ڈی اور دیگر اشارے کے ساتھ مل کر داخلے کی تصدیق
- مخصوص اسٹاک کی خصوصیات کے مطابق اسٹاپ نقصان کے فیصد کو بہتر بنانا
- ٹرانزیکشن فریکوئنسی کو بہتر بنانا اور ٹرانزیکشن فیس کو کم کرنا
خلاصہ کریں۔
یہ حکمت عملی مجموعی طور پر ایک مساوی لائن نظام پر مبنی رجحان کی پیروی کرنے والی حکمت عملی ہے۔ مرکزی خیال یہ ہے کہ ای ایم اے کا استعمال رجحان کی سمت کا تعین کرنے کے لئے کیا جائے ، اور اس کی تصدیق کے لئے حجم کی حرکیات کے اشارے کے ساتھ کام کیا جائے۔ پیرامیٹرز کی اصلاح کے ذریعہ مسلسل اصلاح کی جاسکتی ہے ، اور دیگر اشارے کی مزید تصدیق میں معاون ہے۔ مجموعی طور پر ایک لچکدار رجحان کی پیروی کرنے والی حکمت عملی ہے ، جو مہارت سے استعمال ہونے پر اچھی واپسی حاصل کرسکتی ہے۔
Source
Pine
Strategy parameters
Related strategies
Comment
All comments (0)
No data
- 1