دوہری ٹریک سسٹم مومنٹم ٹریڈنگ کی حکمت عملی

[trans]
جائزہ
اس حکمت عملی میں MACD اور Stoch RSI دونوں اشارے کا استعمال کیا گیا ہے ، جس میں دوہری ٹریڈنگ سسٹم بنایا گیا ہے ، جس میں رجحانات کی پیروی اور اوورلوڈ اور اوورلوڈ فیصلے کی اجازت دی گئی ہے۔ حکمت عملی ایک ہی وقت میں دن کی لائن اور 4 گھنٹے کی لائن پر اشارے کی تعمیر کرتی ہے ، جس میں متعدد ٹائم فریم فیصلے کی اجازت دی جاتی ہے ، جس سے غلط فیصلے کی امکان کم ہوجاتی ہے۔
حکمت عملی کا اصول
اسٹریٹجک پورٹ فولیو MACD اور Stoch RSI دو مختلف قسم کے تکنیکی اشارے کا استعمال کرتا ہے ، ان کی تشکیل کے لئے۔ MACD ایک متغیر اشارے ہے ، جس کی قیمت میں تبدیلی کی رفتار کا فیصلہ کیا جاتا ہے۔ Stoch RSI ایک اوورلوڈ اوورلوڈ اشارے ہے ، جس کا فیصلہ کیا جاتا ہے کہ قیمت نسبتا strong مضبوط ہے۔
حکمت عملی سب سے پہلے MACD اور Stoch RSI اشارے کو یومیہ لائن اور 4 گھنٹوں کی لائن پر بناتی ہے تاکہ رجحان اور اوور خرید اوور فروخت کا فیصلہ کیا جاسکے۔ جب دونوں ٹائم پیریڈ کے اشارے بیک وقت خرید / فروخت سگنل دیتے ہیں تو ، خرید / فروخت کے لئے اسی طرح کی کارروائی کی جاتی ہے۔
خاص طور پر ، MACD اشارے کی تعمیر ، DIF لائن اور DEA لائنوں کو سنہری کانٹا کا فیصلہ کرنے کے لئے تشکیل دیا گیا ہے۔ اسٹوک RSI اشارے کی تعمیر ، K لائن اور D لائنیں سنہری کانٹا کا فیصلہ کرنے کے لئے تشکیل دی گئیں۔ جب اشارے کے دونوں سیٹ بیک وقت سنہری کانٹا کرتے ہیں تو خریدنے کا اشارہ دیتے ہیں اور بیک وقت سنہری کانٹا کرتے ہیں تو بیچنے کا اشارہ دیتے ہیں۔
اس طرح ، حکمت عملی میں دوہری ریل اشارے اور کثیر ٹائم فریم فیصلے کا استعمال کیا جاتا ہے تاکہ قیمتوں میں تبدیلی کی رفتار اور نسبتا strength کمزوری کا جامع فیصلہ کیا جاسکے ، جس سے فیصلہ سازی کی درستگی میں اضافہ اور بہتر منافع حاصل کرنے میں مدد ملے۔
طاقت کا تجزیہ
اس حکمت عملی کے درج ذیل فوائد ہیں:
- ڈبل ریل انڈیکیٹرز کا مجموعہ ، جامع فیصلے اور بہتر فیصلہ سازی کی درستگی
- ایک سے زیادہ ٹائم فریم استعمال کریں تاکہ غلط فہمیوں کا خطرہ کم ہو
- ٹرینڈ ٹریک اور اوور بیئر اوور سیل فیصلے کا استعمال کرتے ہوئے ، قیمتوں میں تبدیلی کی رفتار اور نسبتا weak کمزوری کو جامع طور پر مدنظر رکھنا
- مختلف اقسام اور مارکیٹ کے حالات کے مطابق انڈیکس پیرامیٹرز کو ایڈجسٹ کیا جا سکتا ہے
- واضح کوڈ کی ساخت، سمجھنے اور توسیع کرنے میں آسان
خطرے کا تجزیہ
اس حکمت عملی کے کچھ خطرات بھی ہیں:
- مارکیٹ میں سسٹم کا خطرہ ہے جس سے مکمل طور پر بچا نہیں جا سکتا
- اشارے کے پیرامیٹرز کو غلط ترتیب دینے سے تجارت کی کثرت یا کھوئے ہوئے مواقع پیدا ہوسکتے ہیں
- دو ریل اشارے کے ساتھ ساتھ غلط سگنل دینے کا امکان موجود ہے ، لیکن ایک ہی اشارے سے کم
- بڑے پیمانے پر بلیک سوان جیسے تیزی سے بدلتے ہوئے بازاروں کا مقابلہ کرنے سے قاصر
ردعمل:
- پیرامیٹرز کو بہتر بنائیں ، خرید و فروخت کی شرائط کو ایڈجسٹ کریں ، غلطیوں کو کم کریں
- زیادہ سے زیادہ اشارے کے ساتھ مجموعہ، مزید فیصلے کی بنیاد
- نقصان کی روک تھام کی حکمت عملی کو بڑھانا اور ایک بار نقصان کا خطرہ کنٹرول کرنا
اصلاح کی سمت
اس حکمت عملی کو مندرجہ ذیل پہلوؤں سے بہتر بنایا جاسکتا ہے:
- زیادہ سے زیادہ اشارے شامل کرنے کے لئے، ایک کثیر اشارے کی حکمت عملی کی تعمیر
- مشین لرننگ الگورتھم میں اضافہ ، متحرک پیرامیٹرز کی اصلاح
- جذبات کے اشارے، خبروں کی سطح اور دیگر عوامل کے ساتھ مارکیٹ کی صورتحال کا اندازہ لگانا
- زیادہ سے زیادہ نقصانات کو روکنے اور روکنے کی حکمت عملی، بہتر فنڈ مینجمنٹ
- تجارت کے بہتر مواقع کی تلاش کے لیے مزید اقسام کی تجارت میں اضافہ کرنا
خلاصہ کریں۔
اس حکمت عملی میں دوہری ریل اشارے اور کثیر ٹائم فریم فیصلے کے مجموعی استعمال کے ذریعے ، قیمتوں میں تبدیلی کی رفتار اور نسبتا مضبوطی کا جامع فیصلہ کیا جاسکتا ہے ، مارکیٹ کے رجحانات کو مؤثر طریقے سے حاصل کیا جاسکتا ہے ، اور کسی ایک اشارے میں غلط فیصلے کی خامیوں کو بہتر بنایا جاسکتا ہے۔ اس کے علاوہ ، اس میں پیرامیٹرز کو ایڈجسٹ کرنے میں لچکدار ، سمجھنے میں آسان اور وسعت دینے جیسے فوائد بھی ہیں۔ اس کے بعد ، اس حکمت عملی کی کارکردگی کو مزید بہتر بنانے کے لئے ، کثیر اشارے کے مجموعے ، متحرک پیرامیٹر کی اصلاح ، جذباتی اشارے کی تعارف وغیرہ کے ذریعہ توسیع اور اصلاح کی جاسکتی ہے۔
||
Overview
This strategy combines the MACD and Stoch RSI indicators to build a dual-rail trading system for trend tracking and oversold/overbought judgment. The strategy also builds indicators on the daily and 4-hour timeframes to make multi-timeframe judgments to reduce misjudgment probability.
Strategy Principle
The strategy combines the MACD and Stoch RSI indicators, which are different types of technical indicators, for configuration. MACD is a momentum indicator that judges price change velocity; Stoch RSI is an overbought/oversold indicator that judges relative price strength.
The strategy first constructs the MACD and Stoch RSI indicators on the daily and 4-hour timeframes respectively for trend and overbought/oversold judgments. When signals are triggered on both timeframes, corresponding buy/sell operations are performed.
Specifically, the MACD indicator is constructed with the DIF and DEA lines forming golden/dead crosses for judgment; the Stoch RSI indicator is constructed with the K and D lines forming golden/dead crosses for judgment. When both indicator pairs have golden crosses, buy signals are generated; when both have dead crosses, sell signals are generated.
Thus, by comprehensively applying the dual-indicator system and multi-timeframe judgments, the strategy judges price velocity and relative strength thoroughly, which helps improve decision accuracy and gain better returns.
Advantage Analysis
This strategy has the following advantages:
- Combining dual-indicator system for comprehensive judgment and higher decision accuracy
- Applying multi-timeframe to reduce misjudgment probability
- Adopting trend tracking and overbought/oversold judgment for consideration of both price velocity and relative strength
- Flexible indicator parameters adjustable for different products and market environments
- Clean code structure easy to understand and expand
Risk Analysis
There are also some risks with this strategy:
- There exist systemic market risks that cannot be fully avoided
- Inappropriate indicator parameter settings may lead to overtrading or missing opportunities
- Dual indicators may still give concurrent wrong signals, but less likely than single ones
- Unable to cope with drastic market changes like black swan events
Countermeasures:
- Optimize parameters and adjust trading conditions to reduce misjudgments
- Incorporate more indicators for combined judgments
- Add stop loss mechanisms to control single loss risk
Optimization Directions
This strategy can also be improved in the following aspects:
- Incorporate more indicators for multi-indicator strategies
- Add machine learning algorithms for dynamic parameter optimization
- Combine sentiment indicators, news etc. for more comprehensive market condition judgments
- Add stop loss, take profit strategies to optimize money management
- Expand to more trading products to discover better opportunities
Conclusion
By combined application of the dual-indicator system and multi-timeframe judgments, this strategy judges price velocity and relative strength thoroughly, which can effectively capture market trends and improve deficiencies of single indicators. It also has advantages like flexible parameter tuning, easy understanding and expansion. Further expansions by multi-indicator combination, dynamic parameter optimization, sentiment indicator incorporation etc. can help boost strategy performance.
[trans]
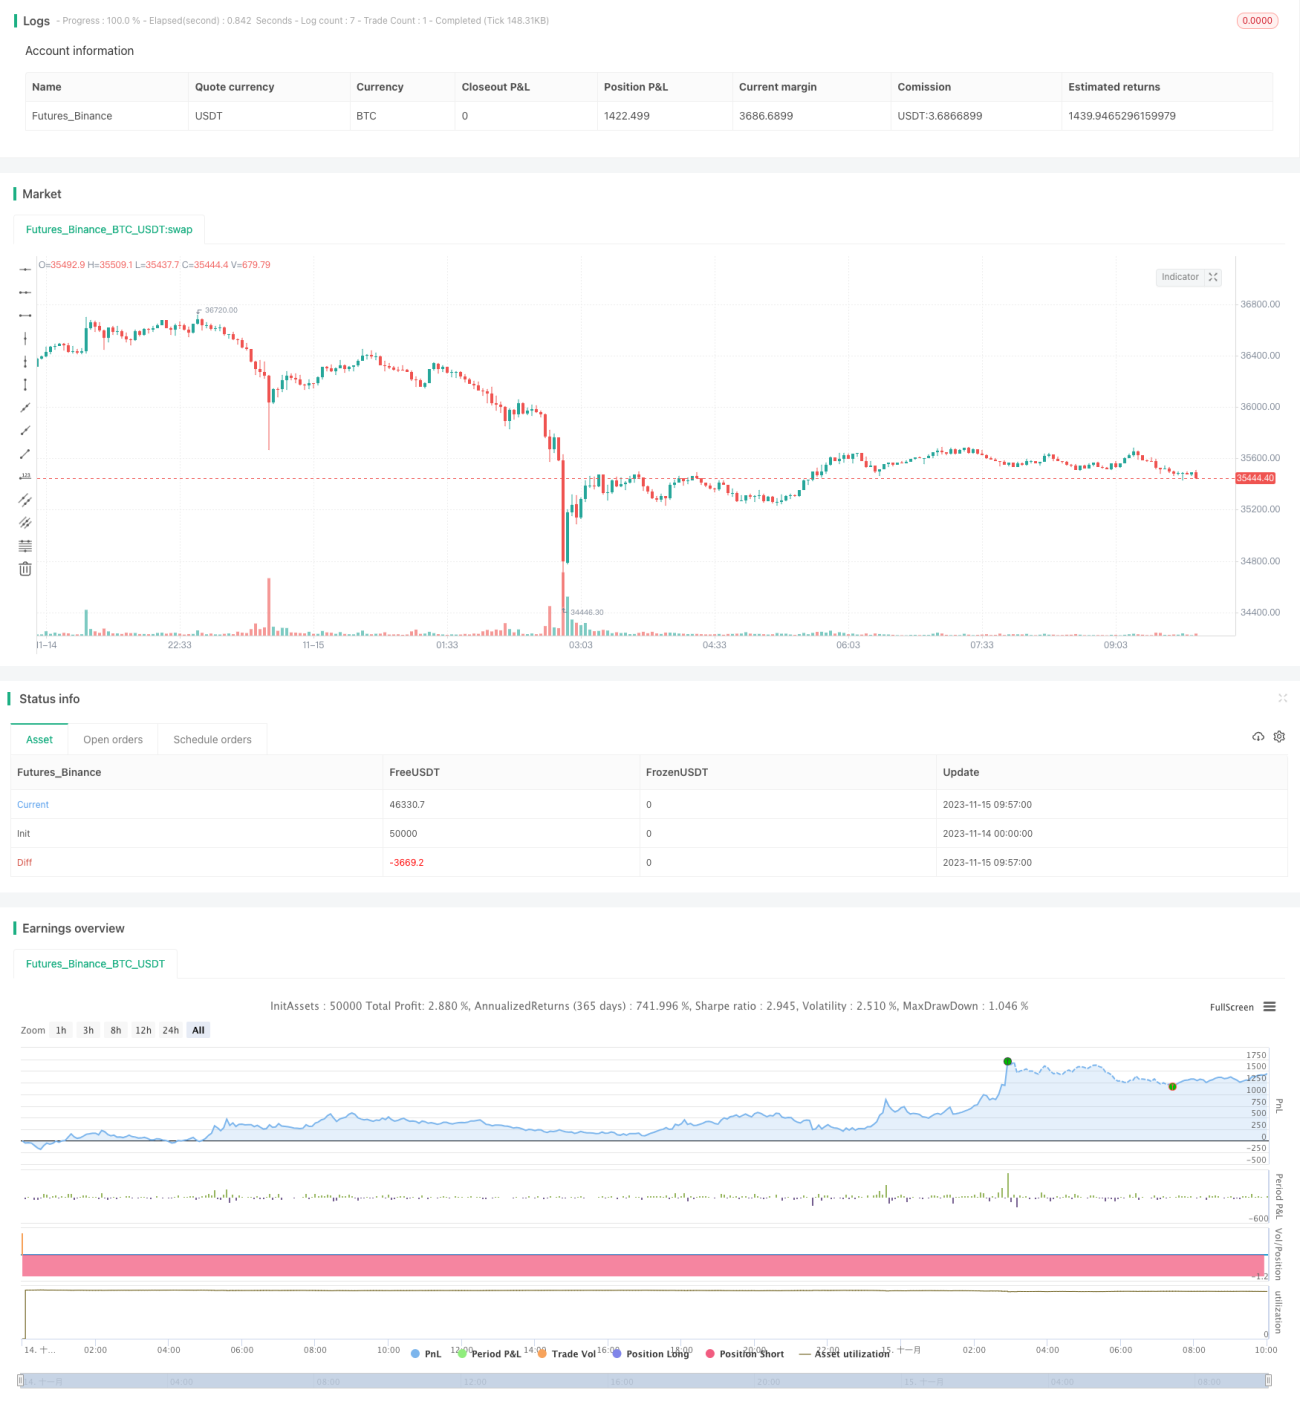
/*backtest
start: 2023-11-14 00:00:00
end: 2023-11-15 10:00:00
period: 3m
basePeriod: 1m
exchanges: [{"eid":"Futures_Binance","currency":"BTC_USDT"}]
*/

//@version=2
strategy(title='[RS]Khizon (UWTI) Strategy V0', shorttitle='K', overlay=false, pyramiding=0, initial_capital=100000, currency=currency.USD)
//  ||  Inputs:
macd_src = input(title='MACD Source:', defval=close)- 1