
اس حکمت عملی میں MACD اشارے اور برننگ چینل اشارے کا استعمال کیا گیا ہے ، جس میں سمندری طوفان کے ٹریڈنگ قوانین کے ساتھ مل کر ایک کثیر جہتی فیصلہ سازی کا نظام تشکیل دیا گیا ہے ، جس کا مقصد حکمت عملی کی منافع بخش صلاحیت کو بڑھانا ہے جبکہ خطرے کو کنٹرول کرنا ہے۔
MACD اشارے کی تیز اور سست اوسط لکیری فورک اور ڈائی فورک شکل کا استعمال کرتے ہوئے ممکنہ رجحانات کا تعین کریں ، اور بورن چینل کے اوپر اور نیچے کی ٹریک کا تعین کرکے اوورلوڈ اور اوور سیل کے معاملات کا اشارہ کریں۔
سمندری طوفان کے تجارتی قواعد میں N کی قیمتوں کے ساتھ مل کر ٹریکنگ اسٹاپ نقصان کا طریقہ کار تشکیل دیا گیا ہے ، جس سے منافع کو مزید لاک کیا جاسکتا ہے اور خطرات پر قابو پایا جاسکتا ہے۔
برننگ چینل کی خصوصیت کا استعمال کرتے ہوئے ، پہلی پوزیشن کھولنے کے تناسب کو ایڈجسٹ کریں ، اور اس کے بعد سمندری طوفان کے تجارتی اصولوں کے مطابق پوزیشنوں کو بڑھانا ، پوزیشن کھولنے اور روکنے کے لئے درجہ بندی کو نافذ کریں ، اور منافع کی جگہ کو بڑھائیں۔
ایم اے سی ڈی اشارے میں رجحانات کا فیصلہ کرنے کی مضبوط صلاحیت ہے ، اور برلن چینل اشارے اوور بیئر اور اوور سیل کی صورتحال کا مؤثر اندازہ لگاتا ہے ، دونوں کو مل کر فیصلہ کرنے کا نظام تشکیل دیا جاتا ہے جس کی درستگی میں اضافہ ہوتا ہے۔
سمندری سمندری ٹریڈنگ کے قوانین میں ٹریکنگ سٹاپ نقصان کا طریقہ کار منافع کو بہتر طور پر لاک کرنے کے لئے استعمال کیا جاتا ہے، اور بہت زیادہ واپسی سے بچنے کے لئے.
درجہ بندی کے نقصانات کو روکنے کے ساتھ مل کر، خطرے کو کنٹرول کرنے کے پیش نظر، وسیع پیمانے پر پھیلاؤ کی جگہ.
برن چینل پیرامیٹرز کو غلط طریقے سے ترتیب دیا گیا ہے ، جس سے مواقع ضائع ہوسکتے ہیں یا غلط سگنل بڑھایا جاسکتا ہے۔
سمندری سمندری ٹریڈنگ کے قواعد میں این کی قیمت کو احتیاط سے ترتیب دینا ضروری ہے ، کیونکہ اس سے زیادہ یا اس سے کم حکمت عملی کی کارکردگی کو متاثر کرسکتا ہے۔
اس کے علاوہ ، یہ بھی کہا گیا ہے کہ اس طرح کے واقعات میں بہت سے لوگوں کو نقصان پہنچایا گیا ہے۔
برننگ کوریج پیرامیٹرز کو ایڈجسٹ کریں ، کوریج کی چوڑائی کو بہتر بنائیں ، منافع کے مواقع کو بہتر بنائیں۔
مختلف N اقدار کی جانچ کریں اور بہترین سٹاپ نقصان کی پوزیشن تلاش کریں۔
منافع کو یقینی بنانے کے لئے خطرے کو کم کرنے کے لئے، زیادہ سے زیادہ اور کثرت کو بہتر بنائیں.
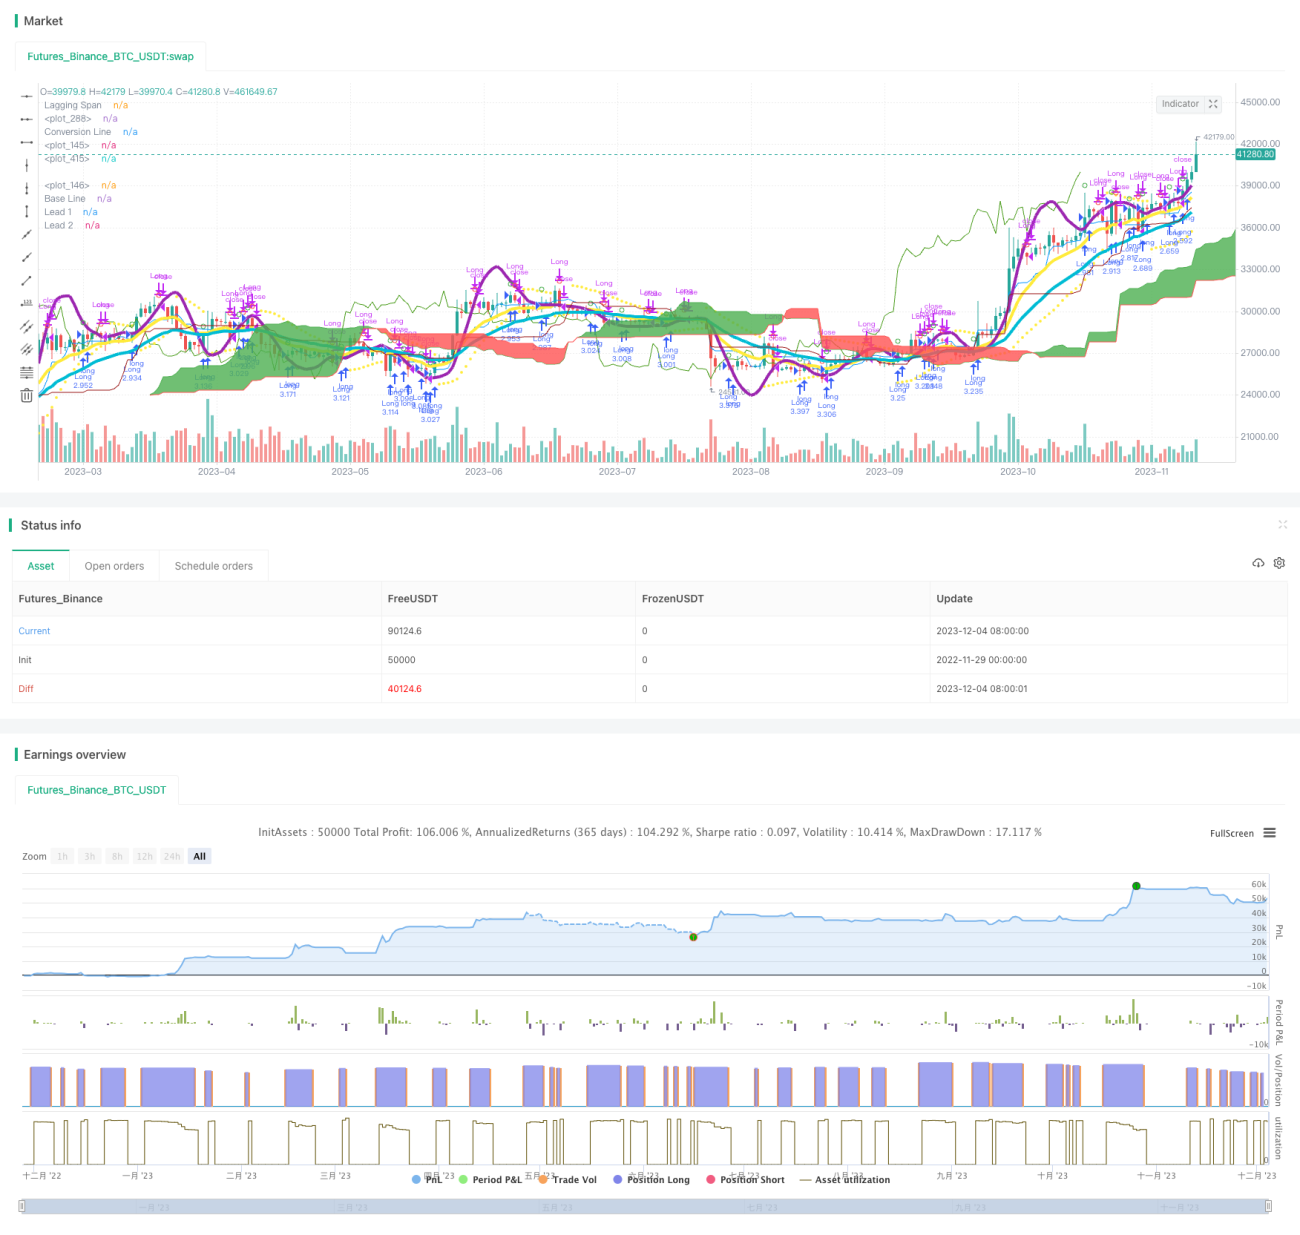
اس حکمت عملی میں MACD ، برن چینل اور ساحل سمندر کے ٹریڈنگ قواعد کے تین بڑے پیمانے پر پیمائش کرنے والے ٹولز کا استعمال کیا گیا ہے تاکہ پیرامیٹرز کو ایڈجسٹ کرکے بہترین میچ مل سکے ، جس سے فیصلہ کن اشارے کا نظام تشکیل دیا جاسکے۔ اس طرح ، ہر ٹول کی طاقت کو بھرپور طور پر استعمال کیا جاسکتا ہے ، ایک دوسرے کی تکمیل کی جاسکتی ہے ، اور نظام کی کارکردگی کو بہتر بنایا جاسکتا ہے۔ اس حکمت عملی میں ایک سخت نقصانات کا بندوبست کرنے کا طریقہ کار بھی شامل ہے اور مناسب خطرہ بھی شامل کیا گیا ہے ، جس سے زیادہ منافع کی تلاش کے ساتھ ہی خطرے سے متعلق منافع کی مماثلت کو یقینی بنایا جاسکتا ہے۔ مجموعی طور پر ، اس حکمت عملی نے اچھی مستحکم منافع بخش کارکردگی کا مظاہرہ کیا۔
/*backtest
start: 2022-11-29 00:00:00
end: 2023-12-05 00:00:00
period: 1d
basePeriod: 1h
exchanges: [{"eid":"Futures_Binance","currency":"BTC_USDT"}]
*/
//@version=3
strategy("Tagmaniak MACD Algo", shorttitle="Tagmaniak MACD Algo", overlay=true, pyramiding = 0, default_qty_type = strategy.percent_of_equity, default_qty_value = 100, initial_capital=7000, calc_on_order_fills = true, commission_type=strategy.commission.percent, commission_value=0, currency = currency.USD)
//study("MFI Fresh", shorttitle="MFI Fresh", overlay=true)
//Risk Management Settings
//trategy.risk.max_drawdown(20, strategy.percent_of_equity)
//strategy.risk.max_intraday_loss(10, strategy.percent_of_equity)
//strategy.risk.max_cons_loss_days(3)
/////////////////
ts = input(title="Trailing Stop in cents", defval=50)/100
//Time Inputs
FromMonth = input(defval = 6, title = "From Month", minval = 1)
FromDay = input(defval = 1, title = "From Day", minval = 1)
FromYear = input(defval = 2017, title = "From Year", minval = 1)
ToMonth = input(defval = 1, title = "To Month", minval = 1)
ToDay = input(defval = 1, title = "To Day", minval = 1)
ToYear = input(defval = 9999, title = "To Year", minval = 1)
//Time Variable
testPeriod() =>
(time > timestamp(FromYear, FromMonth, FromDay, 09, 30)) and (time < timestamp(ToYear, ToMonth, ToDay, 09, 29))
//MA On and MA Colors On? Inputs
switch1=input(false, title="Enable Bar Color?")
switch2=input(true, title="Enable Moving Averages?")
switch3=input(false, title="Enable Background Color?")
switch4=input(false, title="Enable Bolinger Bands?")
switch5=input(false, title="Enable Keltner Channel?")
////////////////////////////////Williams %R
R_length = input(14, minval=1)
R_overBought = input(title="%R Overbought", defval=80)
R_overSold = input(title="%R Oversold", defval=20)
R_upper = highest(R_length)
R_lower = lowest(R_length)
R_out = 100 * (close - R_upper) / (R_upper - R_lower)
WilliamsR_longEntry = crossover(R_out, R_overSold)
WilliamsR_shortEntry = crossunder(R_out, R_overBought)
//plot(R_out)
//R_band1 = hline(R_overSold)
//R_band0 = hline(R_overBought)
//fill(R_band1, R_band0)
////////////////////////////////RSI Variables
rsi_source = close
RSI_Length = input(title="RSI Length", defval=3)
RSI_overBought = input(title="RSI Overbought", defval=80)
RSI_overSold = input(title="RSI Oversold", defval=20)
up = rma(max(change(rsi_source), 0), RSI_Length)
down = rma(-min(change(rsi_source), 0), RSI_Length)
rsi = down == 0 ? 100 : up == 0 ? 0 : 100 - (100 / (1 + up / down))
RSI_longEntry = rsi > 50
//crossover(rsi, RSI_overSold)
RSI_shortEntry = rsi < 50
//crossunder(rsi, RSI_overBought)
//plot(rsi, color=purple)
//band1 = hline(RSI_overBought)
//band0 = hline(RSI_overSold)
//fill(band1, band0, color=purple, transp=90)
//////////////////////Commodity Channel Index
cci_length = input(20, minval=1)
cci_src = input(close, title="Source")
cci_ma = sma(cci_src, cci_length)
cci = (cci_src - cci_ma) / (0.015 * dev(cci_src, cci_length))
cci_longEntry = crossover(cci, -100)
cci_shortEntry = crossunder(cci, 100)
//plot(cci, color=olive)
//cci_band1 = hline(100, color=gray, linestyle=dashed)
//cci_band0 = hline(-100, color=gray, linestyle=dashed)
//fill(cci_band1, cci_band0, color=olive)
//MFI Inputs
MFI_length = input(title="MFI Length", defval=3)
MFI_overBought = input(title="MFI Overbought", defval=80)
MFI_overSold = input(title="MFI Oversold", defval=20)
//MFI Variables
rawMoneyFlow = hlc3 * volume
positiveMoneyFlow = 0.0
positiveMoneyFlow := hlc3 > hlc3[1] ? positiveMoneyFlow + rawMoneyFlow : positiveMoneyFlow
negativeMoneyFlow = 0.0
negativeMoneyFlow := hlc3 < hlc3[1] ? negativeMoneyFlow + rawMoneyFlow : negativeMoneyFlow
moneyFlowRatio = sma(positiveMoneyFlow, MFI_length) / sma(negativeMoneyFlow, MFI_length)
moneyFlowIndex = 100 - 100 / (1 + moneyFlowRatio)
MFI_longEntry = (crossover(moneyFlowIndex, MFI_overSold))
MFI_shortEntry = (crossunder(moneyFlowIndex, MFI_overBought))
///// MFI Plot for STUDY
//plot(moneyFlowIndex, color=#459915)
//MFI_OB=hline(MFI_overBought, title="Overbought", color=#c0c0c0)
//MFI_OS=hline(MFI_overSold, title="Oversold", color=#c0c0c0)
//fill(MFI_overBought, MFI_overSold, color=#9915ff, transp=90)
////VERY SLOW SMA
veryslowLength=input(50,minval=1, title="Very slow SMA")
veryslowSMA = sma(close, veryslowLength)
//MACD Inputs
source = input(close, title="MACD source")
fastLength = input(title="MACD Fast Length", defval=12)
fastLength2 = input(title="MACD Fast Length #2", defval=3)
slowLength = input(title="MACD Slow Length", defval=26)
slowLength2 = input(title="MACD Slow Length #2", defval=7)
MACD_fastsignalSmoothing = input(title="Signal Smoothing", defval=7)
MACD_slowsignalSmoothing = input(title="Signal Smoothing", defval=12)
MACD_fastsignalSmoothing2 = input(title="Signal Smoothing #2", defval=5)
MACD_slowsignalSmoothing2 = input(title="Signal Smoothing #2", defval=9)
MACD_percentthreshold = input(title="MACD % Threshold", defval=-0.0030, step=0.0001)
//MACD variables
fastEMA = ema(source, fastLength)
fastEMA2 = ema(source, fastLength2)
slowEMA = ema(source, slowLength)
slowEMA2 = ema(source, slowLength2)
MACD_Line = fastEMA - slowEMA
MACD_Line2 = fastEMA2 - slowEMA2
MACD_fastsignalLine = ema(MACD_Line, MACD_fastsignalSmoothing)
MACD_slowsignalLine = ema(MACD_Line, MACD_slowsignalSmoothing)
MACD_fastsignalLine2 = ema(MACD_Line2, MACD_fastsignalSmoothing2)
MACD_slowsignalLine2 = ema(MACD_Line2, MACD_slowsignalSmoothing2)
fasthist = MACD_Line - MACD_slowsignalLine
MACD_Histogram2 = MACD_Line2 - MACD_fastsignalLine2
minimum = close * MACD_percentthreshold
SMA = sma(MACD_Line, 10)
// MACD and veryslowSMA Plot for STRATEGY
Fast=plot(switch2?fastEMA:na,color=yellow, linewidth=4)
Slow=plot(switch2?slowEMA:na,color=aqua, linewidth=4)
//VerySlow=plot(switch2?veryslowSMA:na,color=purple,linewidth=4)
//fill(Fast,VerySlow,color=gray)
/////// MACD Plots for STUDY
//plot(fasthist, color=fasthist>0 and fasthist[0]>fasthist[1]?#00ff00:fasthist<=0 and fasthist[0]<fasthist[1]?#f72e2e:fasthist>0 and fasthist[0]<fasthist[1]?#008000:fasthist<0 and fasthist[0]>fasthist[1]?#7f0000:white, style=histogram)
//plot(slowhist, color=slowhist>0 and slowhist[0]>slowhist[1]?#00ff00:slowhist<=0 and slowhist[0]<slowhist[1]?#f72e2e:slowhist>0 and slowhist[0]<slowhist[1]?#008000:slowhist<0 and slowhist[0]>slowhist[1]?#7f0000:white, style=histogram)
//plot(MACD_Line, color=yellow, title="MACD Line")
//plot(MACD_fastsignalSmoothing, color=green, title="Fast Signal Line")
//plot(MACD_slowsignalSmoothing, color=red, title="Slow Signal Line")
//plot(MACD_Line2, color=aqua, title="MACD Line 2")
//plot(MACD_fastsignalSmoothing2, color=orange, title="Fast Signal Line 2")
//plot(MACD_slowsignalSmoothing2, color=white, title="Slow Signal Line 2")
//plot(minimum, color=white, title="% Threshold")
//plot(fasthist, color=fasthist>0 and fasthist[0]>fasthist[1]?#00ff00:fasthist<=0 and fasthist[0]<fasthist[1]?#f72e2e:fasthist>0 and fasthist[0]<fasthist[1]?#008000:fasthist<0 and fasthist[0]>fasthist[1]?#7f0000:white, style=histogram)
//plot(MACD_Histogram2, color=MACD_Histogram2>0?blue:MACD_Histogram2<0?orange:white, style=histogram)
//plot(SMA, color=white, title="SMA")
//MACD Entry Conditions
MACD_longEntry2 = (crossover(MACD_Histogram2, 0))
MACD_shortEntry2 = (crossunder(MACD_Histogram2, 0))
MACD_longEntry = (crossover(fasthist, 0))
MACD_shortEntry = (crossunder(fasthist, 0))
// Colors
//MAtrendcolor = change(veryslowSMA) > 0 ? green : red
//trendcolor = fastEMA > slowEMA and change(veryslowSMA) > 0 and close > slowEMA ? green : fastEMA < slowEMA and change(veryslowSMA) < 0 and close < slowEMA ? red : yellow
//bartrendcolor = close > fastEMA and close > slowEMA and close > veryslowSMA and change(slowEMA) > 0 ? green : close < fastEMA and close < slowEMA and close < veryslowSMA and change(slowEMA) < 0 ? red : yellow
//backgroundcolor = slowEMA > veryslowSMA and MACD_longEntry and MACD_Line > 0 and fastEMA > slowEMA and close[slowLength] > veryslowSMA ? green : slowEMA < veryslowSMA and MACD_shortEntry and MACD_Line < 0 and fastEMA < slowEMA and close[slowLength] < veryslowSMA ? red : na
//barcolor(switch1?bartrendcolor:na)
// Conditional Bar Colors
//backgroundcolor = (MACD_longEntry ? green : MACD_shortEntry ? red : na)
//bgcolor(switch3?backgroundcolor:na,transp=80)
////BOLLINGER BAND Conditions
bb_source = close
bb_length = input(20, minval=1)
bb_mult = input(1.86, minval=0.001, maxval=50)
bb_basis = ema(bb_source, bb_length)
bb_dev = bb_mult * stdev(bb_source, bb_length)
bb_upper = bb_basis + bb_dev
bb_lower = bb_basis - bb_dev
bb_longEntry = crossover(bb_source, bb_lower)
bb_shortEntry = crossunder(bb_source, bb_upper)
plot(switch4?bb_basis:na, color=red, linewidth=4)
p1=plot(switch4?bb_upper:na)
p2=plot(switch4?bb_lower:na)
fill(p1,p2, color=aqua, transp=95)
////KELTNER CHANNEL Inputs/Variables/Plots
KC_useTrueRange = input(true)
KC_length = input(20, minval=1)
KC_mult = input(3.0)
KC_source = input(close, title="Source")
KC_ma = ema(KC_source, KC_length)
KC_range = KC_useTrueRange ? tr : high - low
KC_rangema = ema(KC_range, KC_length)
KC_upper = KC_ma + KC_rangema * KC_mult
KC_lower = KC_ma - KC_rangema * KC_mult
KC_longEntry = crossover(KC_source, KC_lower)
KC_shortEntry = crossunder(KC_source, KC_upper)
plot(switch5?KC_ma:na, color=red, title="Basis")
KC_u = plot(switch5?KC_upper:na, color=red, title="Upper")
KC_l = plot(switch5?KC_lower:na, color=red, title="Lower")
fill(KC_u, KC_l, color=red)
///////////////////ADX
//len = input(title="ADX Length", type=integer, defval=14)
//th = input(title="ADX threshold", type=integer, defval=20)
//TrueRange = max(max(high-low, abs(high-nz(close[1]))), abs(low-nz(close[1])))
//DirectionalMovementPlus = high-nz(high[1]) > nz(low[1])-low ? max(high-nz(high[1]), 0): 0
//DirectionalMovementMinus = nz(low[1])-low > high-nz(high[1]) ? max(nz(low[1])-low, 0): 0
//SmoothedTrueRange = nz(SmoothedTrueRange[1]) - (nz(SmoothedTrueRange[1])/len) + TrueRange
//SmoothedDirectionalMovementPlus = nz(SmoothedDirectionalMovementPlus[1]) - (nz(SmoothedDirectionalMovementPlus[1])/len) + DirectionalMovementPlus
//SmoothedDirectionalMovementMinus = nz(SmoothedDirectionalMovementMinus[1]) - (nz(SmoothedDirectionalMovementMinus[1])/len) + DirectionalMovementMinus
//DIPlus = sma(SmoothedDirectionalMovementPlus / SmoothedTrueRange * 100, len)
//DIMinus = sma(SmoothedDirectionalMovementMinus / SmoothedTrueRange * 100, len)
//DX = abs(DIPlus-DIMinus) / (DIPlus+DIMinus)*100
//ADX = sma(DX, len)
///
//ADX_longEntry = crossover(DIPlus, DIMinus) //or (DIPlus > DIMinus and DIPlus > th and ADX > th)
//ADX_shortEntry = crossover(DIMinus, DIPlus) //or (DIMinus > DIPlus and DIMinus > th and ADX > th)
//DI_long = if DIPlus > DIMinus and ADX > 20 and DIPlus > 20
//plot(DIPlus, color=green, title="DI+")
//plot(DIMinus, color=red, title="DI-")
//plot(ADX, color=black, title="ADX")
//hline(th, color=black, linestyle=dashed)
//////////////////////////////////Playing with RES
r1 = input("5", "Resolution")
r2 = input("15", "Resolution")
r3 = input("30", "Resolution")
r4 = input("60", "Resolution" )
o1 = request.security(heikinashi(syminfo.tickerid), r1, MACD_Line[1])
c1 = request.security(heikinashi(syminfo.tickerid), r1, MACD_slowsignalLine[1])
o2 = request.security(heikinashi(syminfo.tickerid), r2, MACD_Line[1])
c2 = request.security(heikinashi(syminfo.tickerid), r2, MACD_slowsignalLine[1])
o3 = request.security(heikinashi(syminfo.tickerid), r3, MACD_Line[1])
c3 = request.security(heikinashi(syminfo.tickerid), r3, MACD_slowsignalLine[1])
o4 = request.security(heikinashi(syminfo.tickerid), r4, MACD_Line[1])
c4 = request.security(heikinashi(syminfo.tickerid), r4, MACD_slowsignalLine[1])
res_long = (o4 > c4 and o3 > c3 and o2 > c2 and o1 > c1)
res_short = (o4 < c4 and o3 < c3 and o2 < c2 and o1 < c1)
///////////////////// Parabolic SAR (stop and reverse)
start = input(0.02)
increment = input(0.02)
maximum = input(0.2)
psar = sar(start, increment, maximum)
plot(psar, style=circles, color=yellow)
psar_longEntry = close > psar
psar_longExit = crossunder(close, psar)
psar_shortEntry = close < psar//crossunder(close, psar)
psar_shortExit = crossover(close, psar)
mix = (moneyFlowIndex + rsi)/2
RSI_MFI = ema(mix, input(3))
//color = RSI_MFI > 80 ? red :RSI_MFI < 20 ? green : silver
vrsi = RSI_MFI
rsiBuySell = vrsi[1] < 95 and crossover(vrsi, 95) or vrsi[1] < 90 and crossover(vrsi, 90) or vrsi[1] < 85 and crossover(vrsi, 85) or vrsi[1] < 80 and crossover(vrsi, 80) or vrsi[1] < 75 and crossover(vrsi, 75) or vrsi[1] < 70 and crossover(vrsi, 70) or vrsi[1] < 65 and crossover(vrsi, 65) or vrsi[1] < 60 and crossover(vrsi, 60) or vrsi[1] < 55 and crossover(vrsi, 55) or vrsi[1] < 50 and crossover(vrsi, 50) or vrsi[1] < 45 and crossover(vrsi, 45) or vrsi[1] < 40 and crossover(vrsi, 40) or vrsi[1] < 35 and crossover(vrsi, 35) or vrsi[1] < 30 and crossover(vrsi, 30) or vrsi[1] < 25 and crossover(vrsi, 25) or vrsi[1] < 20 and crossover(vrsi, 20) or vrsi[1] < 15 and crossover(vrsi, 15) or vrsi[1] < 10 and crossover(vrsi, 10) or vrsi[1] < 5 and crossover(vrsi, 5) ? 1 : vrsi[1] > 95 and crossunder(vrsi, 95) or vrsi[1] > 90 and crossunder(vrsi, 90) or vrsi[1] > 85 and crossunder(vrsi, 85) or vrsi[1] > 80 and crossunder(vrsi, 80) or vrsi[1] > 75 and crossunder(vrsi, 75) or vrsi[1] > 70 and crossunder(vrsi, 70) or vrsi[1] > 65 and crossunder(vrsi, 65) or vrsi[1] > 60 and crossunder(vrsi, 60) or vrsi[1] > 55 and crossunder(vrsi, 55) or vrsi[1] > 50 and crossunder(vrsi, 50) or vrsi[1] > 45 and crossunder(vrsi, 45) or vrsi[1] > 40 and crossunder(vrsi, 40) or vrsi[1] > 35 and crossunder(vrsi, 35) or vrsi[1] > 30 and crossunder(vrsi, 30) or vrsi[1] > 25 and crossunder(vrsi, 25) or vrsi[1] > 20 and crossunder(vrsi, 20) or vrsi[1] > 15 and crossunder(vrsi, 15) or vrsi[1] > 10 and crossunder(vrsi, 10) or vrsi[1] > 5 and crossunder(vrsi, 5) ?-1:na
//////////////////////////////////Entry Conditions
//
MA1 = ema(hlc3, input(3))
MA2 = wma(MA1, input(7))
MA3 = ema(MA2, input(2))
MA4 = wma(MA3, input(1))
buy = close > MA4 or hlc3[1] < MA4 and hlc3 > MA4 and rsiBuySell == 1
sell = close < MA4 or hlc3[1] > MA4 and hlc3 < MA4 and rsiBuySell == -1
p=14
CO=close-open
HL=high-low
value1 = (CO + 2*CO[1] + 2*CO[2] + CO[3])/6
value2 = (HL + 2*HL[1] + 2*HL[2] + HL[3])/6
num=sum(value1,p)
denom=sum(value2,p)
RVI=denom!=0?num/denom:0
RVIsig=(RVI+ 2*RVI[1] + 2*RVI[2] + RVI[3])/6
//plot(RVI,color=white,style=line,linewidth=1)
//plot(RVIsig,color=orange,style=line,linewidth=1)
Tenkan_periods = input(9, minval=1, title="Conversion Line Periods"),
Kijun_periods = input(26, minval=1, title="Base Line Periods")
Senkou_Span_B_Length = input(50, minval=1, title="Lagging Span 2 Periods"),
Chikou_Span_Length = input(25, minval=1, title="Displacement")
donchian(len) => avg(lowest(len), highest(len))
Tenkan_sen = donchian(Tenkan_periods)
Kijun_sen = donchian(Kijun_periods)
Senkou_Span_A = avg(Tenkan_sen, Kijun_sen)
Senkou_Span_B = donchian(Senkou_Span_B_Length)
plot(Tenkan_sen, color=#0496ff, title="Conversion Line")
plot(Kijun_sen, color=#991515, title="Base Line")
plot(close, offset = -Chikou_Span_Length, color=#459915, title="Lagging Span")
p3 = plot(Senkou_Span_A, offset = Chikou_Span_Length, color=green,
title="Lead 1")
p4 = plot(Senkou_Span_B, offset = Chikou_Span_Length, color=red,
title="Lead 2")
fill(p3, p4, color = Senkou_Span_A > Senkou_Span_B ? green : red, transp=50)
Ichimoku_longEntry = Senkou_Span_B < Senkou_Span_A
Ichimoku_shortEntry = Senkou_Span_A < Senkou_Span_B
len9 = input(9, minval=1, title="Length")
srce = input(hlc3, title="Source")
ema9 = ema(srce, len9)
sma50 = sma(ema9, 80)
sma30 = vwma(sma50, 26)
ema930 = ema(sma30, 9)
//plot(ema930, color=blue, title="MA", linewidth=5, transp=0)
SMA100 = sma(input(ohlc4), input(10))
Lookback = SMA100[input(7)]
sma300 = SMA100 + (SMA100 - Lookback)
//if Ichimoku_longEntry
longEntry = (MACD_longEntry2) //or Stoch_longEntry// or buy //or cci_longEntry or bb_longEntry or psar_shortExit //or //// // KC_longEntry// or WilliamsR_longEntry// // // or RSI_longEntry// // or or MFI_longEntry// or crossover(close,psar) //(o4 < c4 and o3 < c3 and o2 < c2 and o1 < c1)
//if Ichimoku_shortEntry
shortEntry = (MACD_shortEntry2) //or Stoch_shortEntry// or sell//or cci_shortEntry or bb_shortEntry or psar_longExit// // //or KC_shortEntry// or WilliamsR_shortEntry// //or cci_shortEntry // // or or MFI_shortEntry// or crossunder(close,psar)// (o4 < c4 and o3 < c3 and o2 < c2 and o1 < c1)
//longExit = shortEntry or psar_longExit // if not (ADX > th and )
//shortExit = longEntry or psar_shortExit // if not (ADX > th and )
////psar for trailing stops or some other measure? we must have a good trailing stop.
///////////////////////////////Strategy Execution
if testPeriod()
strategy.entry("Long", strategy.long, when=longEntry)
strategy.close("Long", when=shortEntry)
//if testPeriod()
// strategy.entry("Long", strategy.long, when=longEntry)
// strategy.exit("Exit Long", "Long", when=shortEntry)
//else
// strategy.cancel("Long")
//if testPeriod()
// strategy.entry("Short", strategy.short, when=shortEntry)
// strategy.exit("Exit Short", "Short", when=longEntry)
//else
// strategy.cancel("Long")
//Other Plots and Alerts
plotshape(MACD_longEntry2, title= "3,7 Long Open", color=green, style=shape.circle)
plotshape(MACD_shortEntry2, title= "3,7 Short Open", color=red, style=shape.circle)
//plotshape(Stoch_longEntry, title= "Stoch Long Open", color=aqua, style=shape.circle)
//plotshape(Stoch_shortEntry, title= "Stoch Short Open", color=orange, style=shape.circle)
//plotshape(buy, title= "RES Long Open", color=green, location=location.belowbar, style=shape.circle)
///plotshape(sell, title= "RES Short Open", color=red, location=location.belowbar, style=shape.circle)
//plotshape(MACD_longEntry, title= "12,26 Long Open", color=green, style=shape.arrowup, size=size.normal, location=location.belowbar)
//plotshape(MACD_shortEntry, title= "12,26 Short Open", color=red, style=shape.arrowdown, size=size.normal, location=location.abovebar)
//plotshape(MACD_longEntry, title= "12,26 Long Open", color=green, style=shape.diamond, size=size.tiny, location=location.belowbar)
//plotshape(MACD_shortEntry, title= "12,26 Short Open", color=red, style=shape.diamond, size=size.tiny, location=location.abovebar)
//plotchar(longCondition, location=bottom char="L", color=green)
//plotchar(shortCondition, char="S", color=red)
//alertcondition(longCondition, title="MFI+MACD Long", message="(MFI crossOver 30) or MACD+")
//alertcondition(shortCondition, title="MFI+MACD Short", message="(MFI crossUnder 70) or MACD-")
plot(sma300, color=purple, linewidth=4)