مقداری تجارت کی درست طویل اور مختصر حکمت عملی

جائزہ
اس مضمون میں بنیادی طور پر بورن چینل ، ADX اشارے کے ساتھ مل کر K لائن کی بنیاد پر زیادہ خلا کے فیصلے کے لئے ایک مقداری تجارتی حکمت عملی کا تعارف کیا گیا ہے۔ یہ حکمت عملی مارکیٹ کے رجحانات اور اتار چڑھاؤ کا اندازہ لگانے کے لئے بورن چینل کا استعمال کرتی ہے ، اور مارکیٹ کے رجحانات کو کمزوری کا اندازہ لگانے کے لئے ADX اشارے کے ساتھ مل کر ، مضبوط رجحانات کی سمت میں مارکیٹ میں زیادہ سے زیادہ خلا کا انتخاب کرتی ہے ، اور اتار چڑھاؤ کی صورت میں ، زیادہ سے زیادہ خطرے سے بچنے کے لئے پوری نظر ڈالتی ہے۔
حکمت عملی کا اصول
-
- بورن چینل کے اوپر اور نیچے کی ٹریک کی بنیاد پر مارکیٹ کے رجحان کی سمت کا فیصلہ کریں۔ قیمت اوپر کی ٹریک کے اوپر ایک ہیڈ ٹریڈ ہے ، نیچے کی ٹریک کے نیچے ایک ہیڈ ٹریڈ ہے۔
-
- بلین چینل کی بینڈوڈتھ مارکیٹ کی اتار چڑھاؤ اور خطرے کی عکاسی کرتی ہے۔ بلین کی بینڈوڈتھ سے مراد یہ ہے کہ مارکیٹ میں زیادہ اتار چڑھاؤ ہوتا ہے ، خطرہ زیادہ ہوتا ہے ، اس وقت پوزیشن لگانے سے گریز کیا جانا چاہئے۔
-
- ADX اشارے مارکیٹ کے رجحان کی مضبوطی کا تعین کرتا ہے۔ ADX قدر 25 سے زیادہ ہونے پر رجحان کا مظاہرہ کیا جاتا ہے ، اس وقت یہ فیصلہ کیا جاتا ہے کہ بورن چینل کی سمت میں پوزیشن لگانے کا انتخاب کیا گیا ہے۔ ADX 25 سے کم ہونے پر جھٹکے کا مظاہرہ کیا جاتا ہے ، اس وقت تجارت سے گریز کیا جانا چاہئے۔
-
- زیادہ کم کرنے کی سمت میں فیصلہ کرنے کے بعد ، اے ٹی آر اشارے کے مطابق اسٹاپ نقصان کی سطح طے کریں۔ اے ٹی آر مارکیٹ میں اتار چڑھاؤ کی شدت کی پیمائش کرنے کے لئے استعمال ہوتا ہے ، اے ٹی آر کے ضارب کے مطابق اسٹاپ نقصان کی فاصلہ طے کریں۔
-
- اسٹاپ کو بلین کے مطابق اوپر اور نیچے ریل پر سیٹ کریں۔ کثیر سر اسٹاپ نیچے ریل کے لئے ، خالی سر اسٹاپ اوپر ریل کے لئے۔ یا اے ٹی آر اشارے کے اے ٹی آر ضرب کے مطابق فکسڈ اسٹاپ فاصلہ ترتیب دیں۔
-
- اسٹاپ نقصان اور اسٹاپ نقصان کے درمیان منافع اور نقصان کا انتظام کریں ، منافع کو مقفل کرنے کے لئے متحرک اسٹاپ قائم کریں۔
اسٹریٹجک فوائد
-
بورن چینل اور ADX اشارے کی سمت کا فیصلہ کرنے کے ساتھ مل کر ، زیادہ خالی جگہ کا واضح اندازہ لگانا اور منتخب پوزیشن لگانا ، زلزلے کی صورتحال میں بیکار تجارت سے بچنے کے لئے۔
-
بلین بینڈوڈتھ کا استعمال کرتے ہوئے اتار چڑھاؤ کے خطرے کا اندازہ لگائیں۔ بلین بینڈوڈتھ تنگ ہونے پر مواقع زیادہ ہوتے ہیں لیکن خطرہ بھی کم ہوتا ہے۔ بلین بینڈوڈتھ وسیع ہونے پر تجارت سے گریز کریں۔
-
اے ٹی آر اسٹاپ نقصان کی ترتیب خطرے کو قابو میں رکھتی ہے ، جس سے زیادہ سے زیادہ نقصان کا شکار ہونے سے بچا جاسکتا ہے۔
-
برن چینل کی ترتیب کے مطابق سٹاپ پوزیشن، کوئی سٹاپ پیچھا اونچائی سٹاپ پوچھا نیچے کا خطرہ نہیں ہے۔
-
موبائل اسٹاپ منافع کے بعد بروقت اسٹاپ منافع کو یقینی بناتا ہے اور رجحانات کو جاری رکھتا ہے۔
اسٹریٹجک رسک
-
برن چینل اور ADX دونوں پر دباؤ کا امکان ہے۔ اگر کوئی انحراف ہوتا ہے تو یہ غلط فیصلے کا سبب بن سکتا ہے۔
-
اے ٹی آر اشارے صرف تاریخی اتار چڑھاؤ کی عکاسی کرتا ہے اور مستقبل کے اتار چڑھاؤ کی پیش گوئی نہیں کرسکتا ہے۔
-
برن کناں کی علاقائی تقسیم ذہنی ہے اور اس میں مواقع ضائع ہونے کا خدشہ ہے۔
-
موبائل سٹاپ صرف ڈسک میں کیا جا سکتا ہے، وقفے وقفے سے منتقل کرنے کے قابل نہیں ہونے کا خطرہ ہے.
-
ریٹرننگ ڈیٹا فٹنس کا خطرہ۔ حقیقی مارکیٹ میں ٹیسٹ رپورٹوں کی نقل کرنا مشکل ہے۔
حکمت عملی کی اصلاح
-
زیادہ سے زیادہ اشارے کو ایک دوسرے پر بھروسہ کرنے کے لئے مربوط کریں ، تاکہ برلن چینل اور ADX اشارے میں غلط سگنل سے بچا جاسکے۔
-
اے ٹی آر اسٹاپ کو اچھالنے والی اسٹاپ میں شامل کیا جاسکتا ہے۔ یا مارکیٹ میں اتار چڑھاؤ کی پیش گوئی کرنے کے لئے گہری سیکھنے کے الگورتھم کا استعمال کرتے ہوئے اسٹاپ سیٹنگ۔
-
چینل کے پیرامیٹرز کو بہتر بنانا تاکہ اس سے زیادہ مارکیٹنگ کے مواقع کو گلے لگانے میں مدد ملے۔
-
زیادہ موثر پروگرامنگ ٹریڈنگ سسٹم کا استعمال کرتے ہوئے بغیر کسی نگرانی کے موبائل اسٹاپ نقصانات۔
-
اس حکمت عملی کو مضبوط بنانے کے لئے طویل عرصے تک اور زیادہ سے زیادہ قسم کے مجموعوں کے ساتھ دوبارہ جانچ پڑتال کریں.
خلاصہ کریں۔
اس حکمت عملی میں متعدد اشارے کے اشارے شامل ہیں ، جیسے برننگ چینل ، ADX اشارے ، واضح رجحان کی سمت کا تعین کرنے کے بعد منتخب پوزیشن لگانا ، اور اے ٹی آر اشارے کا استعمال کرتے ہوئے اسٹاپ نقصان کی روک تھام کی ترتیب کو بہتر بنانا ، خطرے اور منافع کی شرح کو زیادہ سے زیادہ کنٹرول کرنا ، ایک تجویز کردہ مقدار کی تجارت کی حکمت عملی ہے۔ ہم دیکھتے ہیں کہ اس حکمت عملی میں بہت زیادہ اصلاح کی گنجائش موجود ہے ، آئندہ ایڈیشن کی پیداوار کا انتظار کریں۔
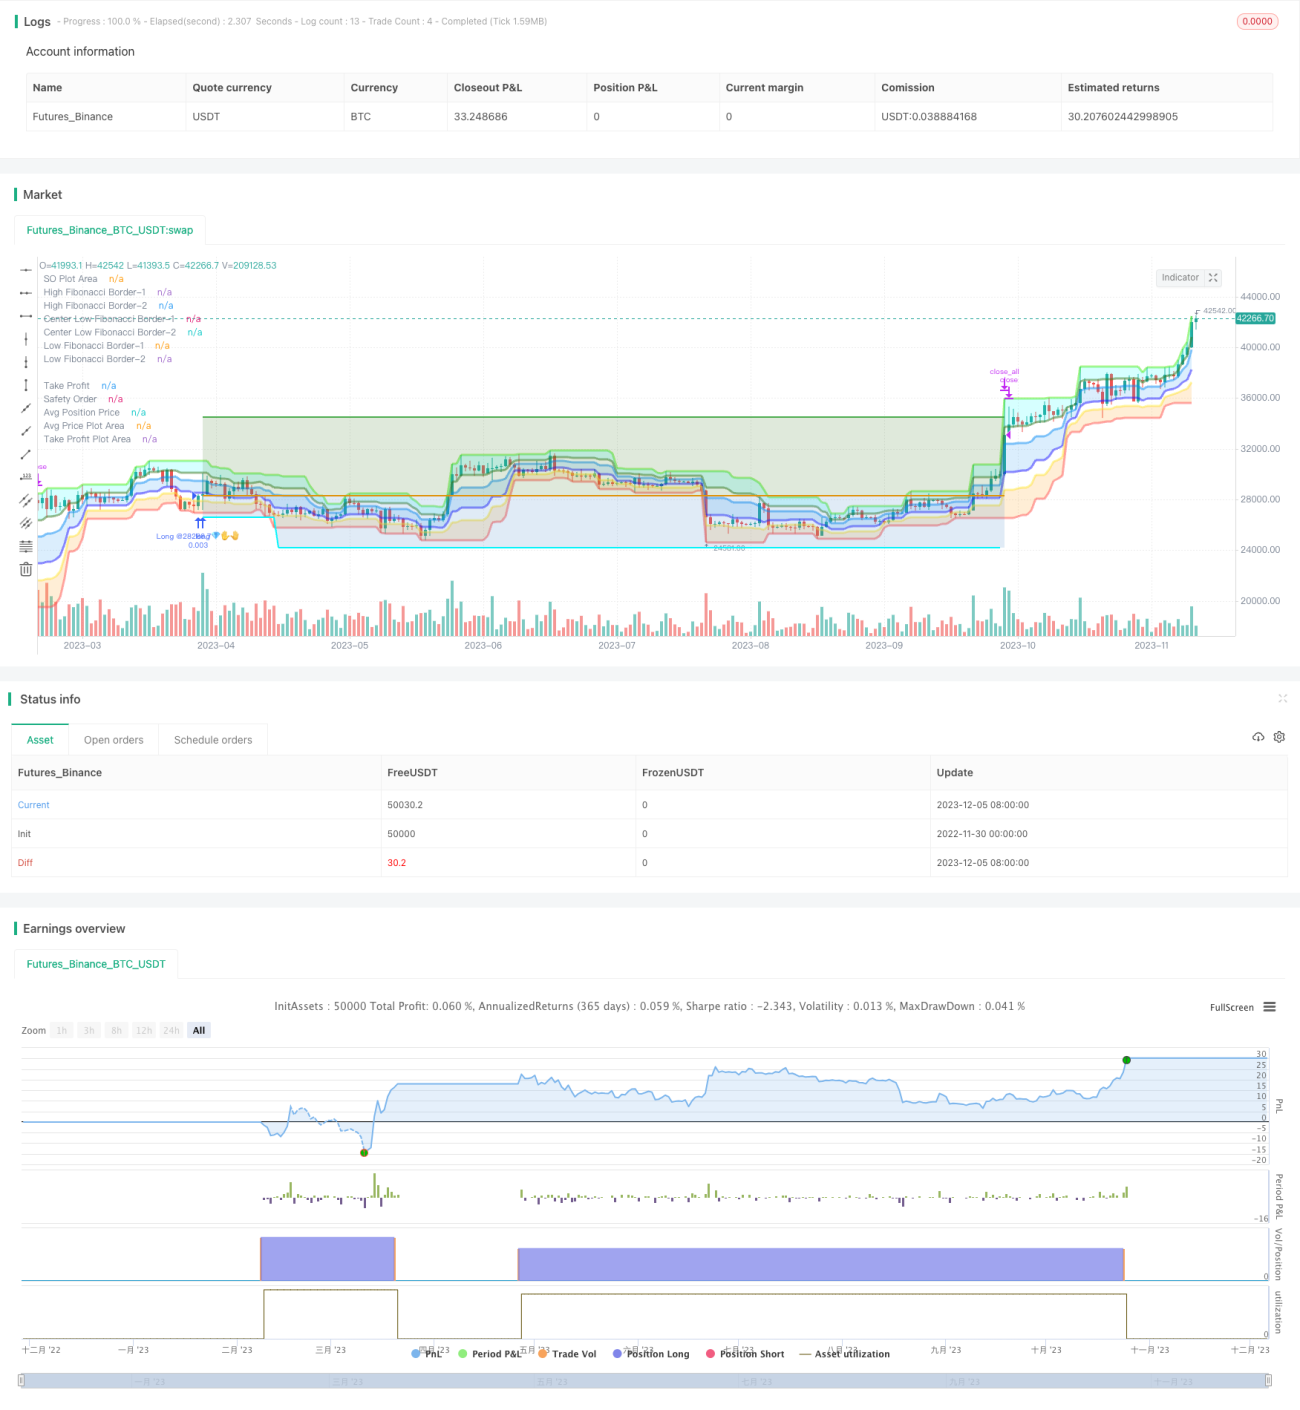
/*backtest
start: 2022-11-30 00:00:00
end: 2023-12-06 00:00:00
period: 1d
basePeriod: 1h
exchanges: [{"eid":"Futures_Binance","currency":"BTC_USDT"}]
*/

// © Fibonacci Zone DCA Strategy - R3c0nTrader ver 2022-06-12
// For backtesting with 3Commas DCA Bot settings
// Thank you "eykpunter" for granting me permission to use "Fibonacci Zones" to create this strategy
// Thank you "junyou0424" for granting me permission to use "DCA Bot with SuperTrend Emulator" which I used for adding bot inputs, calculations, and strategy- 1