حکمت عملی کے بعد ڈبل ریورسل رجحان


تخلیق کی تاریخ: 2023-12-13 18:01:53 آخر میں ترمیم کریں: 2023-12-13 18:01:53
کاپی: 0 کلکس کی تعداد: 573
1
پر توجہ دیں
1621
پیروکار

حکمت عملی کے بعد ڈبل ریورسل رجحان

جائزہ

یہ ایک ٹرینڈ ٹریکنگ حکمت عملی ہے جس میں دوہری الٹ سگنل شامل ہیں۔ یہ 123 الٹ حکمت عملی اور کارکردگی انڈیکس حکمت عملی کو مربوط کرتا ہے تاکہ قیمت کے الٹ پوائنٹس کو ٹریک کیا جاسکے ، جس سے زیادہ قابل اعتماد رجحان کا فیصلہ کیا جاسکے۔

حکمت عملی کا اصول

یہ حکمت عملی دو ذیلی حکمت عملیوں پر مشتمل ہے:

  1. 123 واپسی کی حکمت عملی

14 دن کی لائن کا استعمال کرتے ہوئے الٹی سگنل کا فیصلہ کریں۔ مخصوص قواعد یہ ہیں:

  • کثیر سر سگنل: پہلے دو دن کے اختتامی قیمت میں کمی ، موجودہ K لائن اختتامی قیمت پچھلے دن کے اختتامی قیمت سے زیادہ ہے ، 9 ویں دن اسٹوکاسٹک سست 50 سے کم
  • خالی سر سگنل: پہلے دو دن کے اختتامی قیمت میں اضافہ ، موجودہ K لائن اختتامی قیمت پچھلے دن کے اختتامی قیمت سے کم ہے ، 9 دن اسٹوکاسٹک فاسٹ 50 سے زیادہ
  1. کارکردگی انڈیکس حکمت عملی

پچھلے 14 دنوں میں ہونے والے اتار چڑھاو کو بطور اشارے استعمال کیا جاتا ہے۔ اس کے قواعد درج ذیل ہیں:

  • کارکردگی انڈیکس> ((0)) ، کثیر سر سگنل پیدا
  • کارکردگی انڈیکس <(0) ، ایک خالی سر سگنل پیدا

حتمی سگنل دو قسم کے سگنل کا مجموعہ ہے۔ یعنی ہمہ جہتی کثیر فضائی سگنل کی ضرورت ہوتی ہے تاکہ خرید و فروخت کی اصل کارروائی ہو۔

اس سے کچھ شور کو فلٹر کیا جا سکتا ہے اور سگنل کو زیادہ قابل اعتماد بنایا جا سکتا ہے۔

اسٹریٹجک فوائد

اس دوہری الٹ پلٹ نظام کے درج ذیل فوائد ہیں:

  1. ڈبل فیکٹر فیصلہ کے ساتھ، سگنل زیادہ قابل اعتماد ہے
  2. مارکیٹ کے شور کو مؤثر طریقے سے فلٹر کرنے اور غلط سگنل سے بچنے کے لئے
  3. 123 فارمیٹ کلاسیکی اور عملی ، آسانی سے فیصلہ اور نقل کرنا
  4. کارکردگی کے انڈیکس مستقبل کے رجحانات کا تعین کر سکتے ہیں
  5. پیرامیٹرز کا مجموعہ لچکدار ہے اور مزید بہتر بنایا جاسکتا ہے

اسٹریٹجک رسک

اس حکمت عملی کے کچھ خطرات بھی ہیں:

  1. ٹرینڈ کی مکمل گرفت نہ ہونے کی وجہ سے اچانک تبدیلی سے محروم رہنا
  2. ڈبل کنڈیشنز کا مجموعہ سگنل میں کمی کا سبب بنتا ہے ، جو منافع کو متاثر کرسکتا ہے
  3. ہمدردانہ فیصلے کی ضرورت ہوتی ہے اور انفرادی اسٹاک کے مخصوص اتار چڑھاؤ سے متاثر ہوتا ہے
  4. پیرامیٹرز کی ترتیب کے مسائل سگنل انحراف کا سبب بن سکتا ہے

مندرجہ ذیل اصلاحات پر غور کیا جا سکتا ہے:

  1. پیرامیٹرز کو ایڈجسٹ کریں ، جیسے K لائن کی لمبائی ، اسٹوکاسٹک دورانیہ ، وغیرہ
  2. ڈبل سگنل کے فیصلے کی منطق کو بہتر بنانا
  3. اور اس کے علاوہ بھی بہت سے عوامل ہیں، جیسے ٹرانسمیشن.
  4. نقصان کی روک تھام میں اضافہ

خلاصہ کریں۔

اس حکمت عملی میں دوہری الٹ فیصلے شامل ہیں ، جس سے قیمتوں میں تبدیلی کے مقامات کو مؤثر طریقے سے پتہ چلتا ہے۔ اگرچہ سگنل کے واقع ہونے کا امکان کم ہے ، لیکن اس کی وشوسنییتا زیادہ ہے ، اور یہ درمیانی لمبی لائن رجحانات کو پکڑنے کے لئے موزوں ہے۔ اس حکمت عملی کی تاثیر کو مزید بڑھانے کے لئے پیرامیٹرز کو ایڈجسٹ کرنے اور کثیر عنصر کی اصلاح کے ذریعے استعمال کیا جاسکتا ہے۔
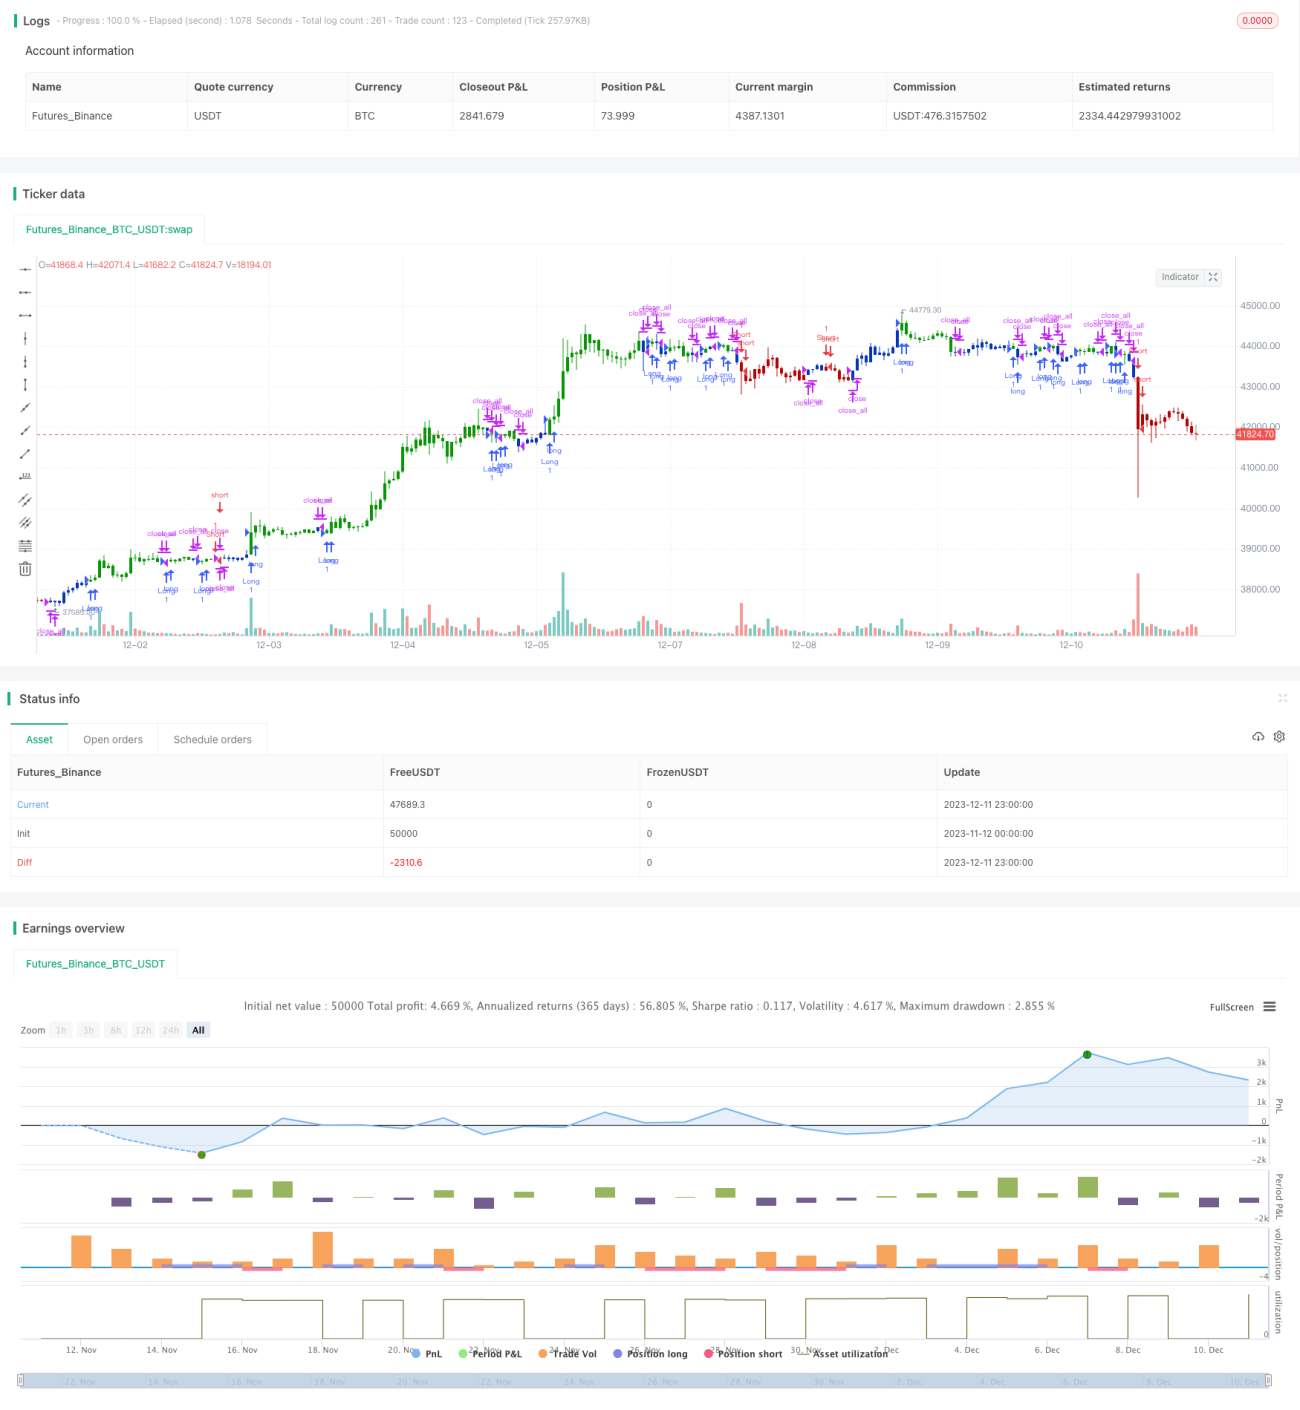
حکمت عملی کا ماخذ کوڈ
/*backtest
start: 2023-11-12 00:00:00
end: 2023-12-12 00:00:00
period: 1h
basePeriod: 15m
exchanges: [{"eid":"Futures_Binance","currency":"BTC_USDT"}]
*/

//@version=4
////////////////////////////////////////////////////////////
//  Copyright by HPotter v1.0 15/04/2021
// This is combo strategies for get a cumulative signal. 
//
// First strategy
// This System was created from the Book "How I Tripled My Money In The 
// Futures Market" by Ulf Jensen, Page 183. This is reverse type of strategies.
// The strategy buys at market, if close price is higher than the previous close 
// during 2 days and the meaning of 9-days Stochastic Slow Oscillator is lower than 50. 
// The strategy sells at market, if close price is lower than the previous close price 
// during 2 days and the meaning of 9-days Stochastic Fast Oscillator is higher than 50.
//
// Second strategy
// The Performance indicator or a more familiar term, KPI (key performance indicator), 
// is an industry term that measures the performance. Generally used by organizations, 
// they determine whether the company is successful or not, and the degree of success. 
// It is used on a business’ different levels, to quantify the progress or regress of a 
// department, of an employee or even of a certain program or activity. For a manager 
// it’s extremely important to determine which KPIs are relevant for his activity, and 
// what is important almost always depends on which department he wants to measure the 
// performance for.  So the indicators set for the financial team will be different than 
// the ones for the marketing department and so on.
//
// Similar to the KPIs companies use to measure their performance on a monthly, quarterly 
// and yearly basis, the stock market makes use of a performance indicator as well, although 
// on the market, the performance index is calculated on a daily basis. The stock market 
// performance indicates the direction of the stock market as a whole, or of a specific stock 
// and gives traders an overall impression over the future security prices, helping them decide 
// the best move. A change in the indicator gives information about future trends a stock could 
// adopt, information about a sector or even on the whole economy. The financial sector is the 
// most relevant department of the economy and the indicators provide information on its overall 
// health, so when a stock price moves upwards, the indicators are a signal of good news. On the 
// other hand, if the price of a particular stock decreases, that is because bad news about its 
// performance are out and they generate negative signals to the market, causing the price to go 
// downwards. One could state that the movement of the security prices and consequently, the movement 
// of the indicators are an overall evaluation of a country’s economic trend.
//
// WARNING:
// - For purpose educate only
// - This script to change bars colors.
////////////////////////////////////////////////////////////
Reversal123(Length, KSmoothing, DLength, Level) =>
    vFast = sma(stoch(close, high, low, Length), KSmoothing) 
    vSlow = sma(vFast, DLength)
    pos = 0.0
    pos := iff(close[2] < close[1] and close > close[1] and vFast < vSlow and vFast > Level, 1,
	         iff(close[2] > close[1] and close < close[1] and vFast > vSlow and vFast < Level, -1, nz(pos[1], 0))) 
	pos


PI(Period) =>
    pos = 0.0
    xKPI = (close - close[Period]) * 100 / close[Period]
    pos := iff(xKPI > 0, 1,
              iff(xKPI < 0, -1, nz(pos[1], 0))) 
    pos

strategy(title="Combo Backtest 123 Reversal & Perfomance index", shorttitle="Combo", overlay = true)
line1 = input(true, "---- 123 Reversal ----")
Length = input(14, minval=1)
KSmoothing = input(1, minval=1)
DLength = input(3, minval=1)
Level = input(50, minval=1)
//-------------------------
line2 = input(true, "---- Perfomance index ----")
Period = input(14, minval=1)
reverse = input(false, title="Trade reverse")
posReversal123 = Reversal123(Length, KSmoothing, DLength, Level)
posPI = PI(Period)
pos = iff(posReversal123 == 1 and posPI == 1 , 1,
	   iff(posReversal123 == -1 and posPI == -1, -1, 0)) 
possig = iff(reverse and pos == 1, -1,
          iff(reverse and pos == -1 , 1, pos))	   
if (possig == 1 ) 
    strategy.entry("Long", strategy.long)
if (possig == -1 )
    strategy.entry("Short", strategy.short)	 
if (possig == 0) 
    strategy.close_all()
barcolor(possig == -1 ? #b50404: possig == 1 ? #079605 : #0536b3 )