 ["abc", "def", {"type": "button", "cmd": "coverAll", "name": "close position"}]
      ]
  })"_json;

  auto ticker = exchange.GetTicker();
  json jsonTicker = R"({"Buy": 0, "Sell": 0, "High": 0, "Low": 0, "Volume": 0, "Last": 0, "Time": 0})"_json;
  jsonTicker["Buy"] = ticker.Buy;
  jsonTicker["Sell"] = ticker.Sell;
  jsonTicker["Last"] = ticker.Last;
  jsonTicker["Volume"] = ticker.Volume;
  jsonTicker["Time"] = ticker.Time;
  jsonTicker["High"] = ticker.High;
  jsonTicker["Low"] = ticker.Low;

  json arr = R"([{"body": {}, "colspan": 2}, "abc"])"_json;
  arr[0]["body"] = jsonTicker;
  table["rows"].push_back(arr);
  LogStatus("`" + table.dump() + "`");
}
)
- Vertical merger
```js
function main() {
var table = {
type: 'table',
title: 'Table demo',
cols: ['ColumnA', 'ColumnB', 'ColumnC'],
rows: [
['A1', 'B1', {'type':'button', 'cmd': 'coverAll', 'name': 'C1'}]
]
}
var ticker = exchange.GetTicker()
var name = exchange.GetName()
table.rows.push([{body : "A2 + B2:" + JSON.stringify(ticker), colspan : 2}, "C2"])
table.rows.push([{body : "A3 + A4 + A5:" + name, rowspan : 3}, "B3", "C3"])
// A3 is merged by the first cell in the previous row
table.rows.push(["B4", "C4"])
// A2 is merged by the first cell in the previous row
table.rows.push(["B5", "C5"])
table.rows.push(["A6", "B6", "C6"])
LogStatus('`' + JSON.stringify(table) + '`')
}
import json
def main():
    table = {
        "type" : "table",
        "title" : "Table demo",
        "cols" : ["ColumnA", "ColumnB", "ColumnC"],
        "rows" : [
            ["A1", "B1", {"type": "button", "cmd": "coverAll", "name": "C1"}]
        ]
    }

    ticker = exchange.GetTicker()
    name = exchange.GetName()

    table["rows"].append([{"body": "A2 + B2:" + json.dumps(ticker), "colspan": 2}, "C2"])
    table["rows"].append([{"body": "A3 + A4 + A5:" + name, "rowspan": 3}, "B3", "C3"])
    table["rows"].append(["B4", "C4"])
    table["rows"].append(["B5", "C5"])
    table["rows"].append(["A6", "B6", "C6"])
    LogStatus("`" + json.dumps(table) + "`")
void main() {
    json table = R"({
        "type" : "table",
        "title" : "Table demo",
        "cols" : ["ColumnA", "ColumnB", "ColumnC"],
        "rows" : [
            ["A1", "B1", {"type": "button", "cmd": "coverAll", "name": "C1"}]
        ]
    })"_json;
    // In order to test, the code is short and easy to read, and the constructed data is used here
    json jsonTicker = R"({"High": 0, "Low": 0, "Buy": 0, "Sell": 0, "Last": 0, "Time": 0, "Volume": 0})"_json;
    auto name = exchange.GetName();
    json arr1 = R"([{"body": "", "colspan": 2}, "C2"])"_json;
    arr1[0]["body"] = "A2 + B2:" + jsonTicker.dump();
    json arr2 = R"([{"body": "", "rowspan": 3}, "B3", "C3"])"_json;
    arr2[0]["body"] = "A3 + A4 + A5:" + name;
    table["rows"].push_back(arr1);
    table["rows"].push_back(arr2);
    table["rows"].push_back(R"(["B4", "C4"])"_json);
    table["rows"].push_back(R"(["B5", "C5"])"_json);
    table["rows"].push_back(R"(["A6", "B6", "C6"])"_json);
    LogStatus("`" + table.dump() + "`");
}
)
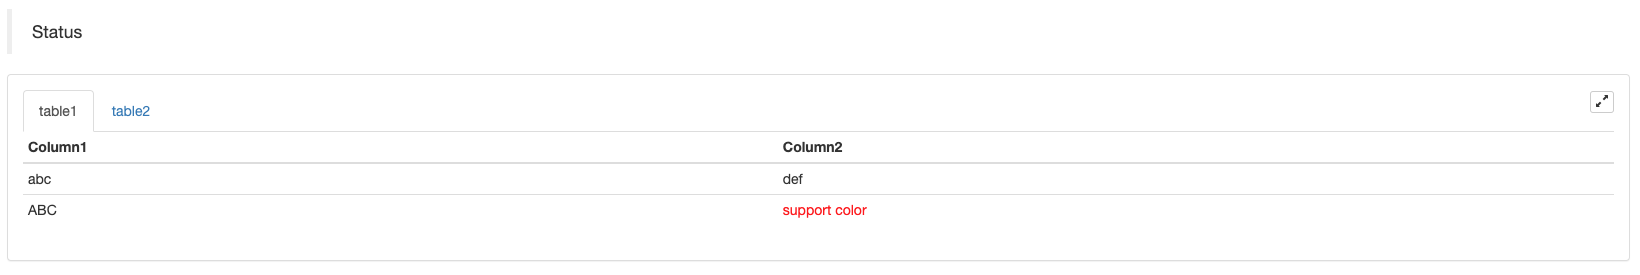
Hiển thị thanh trạng thái bảng xếp hạng:
function main() {
    var table1 = {type: 'table', title: 'table1', cols: ['Column1', 'Column2'], rows: [ ['abc', 'def'], ['ABC', 'support color #ff0000']]}
    var table2 = {type: 'table', title: 'table2', cols: ['Column1', 'Column2'], rows: [ ['abc', 'def'], ['ABC', 'support color #ff0000']]}
    LogStatus('`' + JSON.stringify([table1, table2]) + '`')
}
import json
def main():
    table1 = {"type": "table", "title": "table1", "cols": ["Column1", "Column2"], "rows": [ ["abc", "def"], ["ABC", "support color #ff0000"]]}
    table2 = {"type": "table", "title": "table2", "cols": ["Column1", "Column2"], "rows": [ ["abc", "def"], ["ABC", "support color #ff0000"]]}
    LogStatus("`" + json.dumps([table1, table2]) + "`")
void main() {
    json table1 = R"({"type": "table", "title": "table1", "cols": ["Column1", "Column2"], "rows": [ ["abc", "def"], ["ABC", "support color #ff0000"]]})"_json;
    json table2 = R"({"type": "table", "title": "table2", "cols": ["Column1", "Column2"], "rows": [ ["abc", "def"], ["ABC", "support color #ff0000"]]})"_json;
    json arr = R"([])"_json;
    arr.push_back(table1);
    arr.push_back(table2);
    LogStatus("`" + arr.dump() + "`");
}
Ngoài việc trang hóa bảng, nhiều bảng có thể được sắp xếp từ trên xuống dưới.
function main(){
    var tab1 = {
        type : "table",
        title : "table1",
        cols : ["1", "2"],
        rows : []
    }
    var tab2 = {
        type : "table",
        title : "table2",
        cols : ["1", "2", "3"],
        rows : []
    }
    var tab3 = {
        type : "table",
        title : "table3",
        cols : ["A", "B", "C"],
        rows : []
    }

    tab1.rows.push(["jack", "lucy"])
    tab2.rows.push(["A", "B", "C"])
    tab3.rows.push(["A", "B", "C"])

    LogStatus('`' + JSON.stringify(tab1) + '`\n' +
        '`' + JSON.stringify(tab2) + '`\n' +
        '`' + JSON.stringify(tab3) + '`')

    Log("exit")
}
import json
def main():
    tab1 = {
        "type": "table",
        "title": "table1",
        "cols": ["1", "2"],
        "rows": []
    }
    tab2 = {
        "type": "table",
        "title": "table2",
        "cols": ["1", "2", "3"],
        "rows": []
    }
    tab3 = {
        "type": "table",
        "title": "table3",
        "cols": ["A", "B", "C"],
        "rows": []
    }

    tab1["rows"].append(["jack", "lucy"])
    tab2["rows"].append(["A", "B", "C"])
    tab3["rows"].append(["A", "B", "C"])
    LogStatus("`" + json.dumps(tab1) + "`\n" +
        "`" + json.dumps(tab2) + "`\n" +
        "`" + json.dumps(tab3) + "`")
void main() {
    json tab1 = R"({
        "type": "table",
        "title": "table1",
        "cols": ["1", "2"],
        "rows": []
    })"_json;
    json tab2 = R"({
        "type": "table",
        "title": "table2",
        "cols": ["1", "2", "3"],
        "rows": []
    })"_json;
    json tab3 = R"({
        "type": "table",
        "title": "table3",
        "cols": ["A", "B", "C"],
        "rows": []
    })"_json;
    tab1["rows"].push_back(R"(["jack", "lucy"])"_json);
    tab2["rows"].push_back(R"(["A", "B", "C"])"_json);
    tab3["rows"].push_back(R"(["A", "B", "C"])"_json);
    LogStatus("`" + tab1.dump() + "`\n" +
        "`" + tab2.dump() + "`\n" +
        "`" + tab3.dump() + "`");
}
Kết quả hoạt động:)
Lưu ý:
Khi bot chiến lược đang chạy trên trang bot, nếu bạn cuộn qua các bản ghi lịch sử, thanh trạng thái sẽ đi vào trạng thái ngủ và ngừng cập nhật. Dữ liệu thanh trạng thái sẽ chỉ được làm mới khi nhật ký trên trang đầu tiên.
thanh trạng thái hỗ trợ xuất hình ảnh được mã hóa trongbase64, và cũng hỗ trợ đầu ra các hình ảnh được mã hóa trongbase64Vì chiều dài chuỗi của hình ảnh được mã hóa thường rất dài, không có mã mẫu nào được cung cấp.
EnableLog (()
EnableLog(IsEnable)bật hoặc tắt ghi nhật ký thông tin đơn đặt hàng. Giá trị tham số:isEnablelà kiểu bool. NếuIsEnableđược thiết lập thànhfalse, nhật ký đặt hàng sẽ không được in ra và nó sẽ không được ghi vào cơ sở dữ liệu bot.
Biểu đồ
Chart(...), chức năng tùy chỉnh biểu đồ vẽ.
Chart({…}); tham số làHighCharts.StockChartcác thông số củaHighStockcó thể được phân loại theo chuỗi trongJSON, thêm một_isStocknếu bạn chỉ định_isStock:false, nó sẽ được hiển thị như một biểu đồ bình thường.
Lưu ý:
Nếu bạn đặt thuộc tính của_isStockđếnfalse, biểu đồ được sử dụng là:Biểu đồ cao, như trong biểu đồ:
)
Nếu chúng ta đặt thuộc tính của_isStockđếntrue, biểu đồ được sử dụng là:Cổ cao(bên mặc định)_isStocknhư đúng), như được hiển thị trong biểu đồ:
)
Để trở lại đối tượng, bạn có thể gọiadd(n, data) (n(chẳng hạn như 0) là chỉ sốseries, vàdatalà dữ liệu được viết trong biểu đồ) để thêm dữ liệu vào chỉ số được chỉ địnhseries; gọireset()để xóa dữ liệu biểu đồ, vàresetcó thể lấy một tham số số và chỉ định số lượng các mục được lưu trữ.
Anh có thể gọiadd(n, data, i) (ilà chỉ số của dữ liệu này trongseries) để thay đổi dữ liệu trongseries.
Nó có thể là âm,
chart.add(0, [1574993606000, 13.5], -1), thay đổi dữ liệu của điểm cuối cùng củaseries[0].data.
Vì nó hỗ trợ để hiển thị nhiều biểu đồ, bạn chỉ cần truyền vào các tham số mảng trong quá trình cấu hình, chẳng hạn như:var chart = Chart([{…}, {…}, {…}])Ví dụ, biểu đồ 1 có haiseries, biểu đồ 2 có mộtseries, và biểu đồ 3 có mộtseries. Sau đó, chỉ định loạt ID 0 và 1 khi thêm đại diện để cập nhật dữ liệu của hai thứ tự Cột biểu đồ 1; chỉ định loạt ID 2 khi thêm đề cập đến lần đầu tiênseriescủa biểu đồ 2 Dữ liệu; xác định loạt ID3 đề cập đến dữ liệu củaseriescủa biểu đồ 3.
HighStocks: http://api.highcharts.com/highstock
Cài đặt thuộc tính liên quan đến hiển thị nhiều biểu đồ:ví dụ
Ví dụ, các đối tượng cấu hình biểu đồ:
var cfgA = {
    extension: {
        // It does not participate in grouping, displayed separately, and its default is 'group'
        layout: 'single',
        // This is the specified height, which can be set to string "300px" (set "300", and "300px" will be displayed instead automatically)
        height: 300,
        // It is the unit value of the specified width, with a total value of 12
        col: 8
    },
    title: {
        text: 'Market Chart'
    },
    xAxis: {
        type: 'datetime'
    },
    series: [{
        name: 'Buy 1',
        data: []
    }, {
        name: 'Sell 1',
        data: []
    }]
}

var cfgB = {
    title: {
        text: 'Spread chart'
    },
    xAxis: {
        type: 'datetime'
    },
    series: [{
        name: 'Spread',
        type: 'column',
        data: []
    }]
}

var cfgC = {
    _isStock: false,
    title: {
        text: 'Pie Chart'
    },
    series: [{
        type: 'pie',
        name: 'one',
        // After specifying the initial data, you don't need to update it with the "add" function; Changing the chart configuration directly will update the series
        data: [
            ["A", 25],
            ["B", 25],
            ["C", 25],
            ["D", 25]
        ]
    }]
}

var cfgD = {
    extension: {
        layout: 'single',
        // The unit value of the specified width, with a total value of 12
        col: 8,
        height: '300px'
    },
    title: {
        text: 'Market Chart'
    },
    xAxis: {
        type: 'datetime'
    },
    series: [{
        name: 'Buy 1',
        data: []
    }, {
        name: 'Sell 1',
        data: []
    }]
}

var cfgE = {
    __isStock: false,
    extension: {
        layout: 'single',
        col: 4,
        height: '300px'
    },
    title: {
        text: 'Pie Chart2'
    },
    series: [{
        type: 'pie',
        name: 'one',
        data: [
            ["A", 25],
            ["B", 25],
            ["C", 25],
            ["D", 25]
        ]
    }]
}
cfgA = {
    "extension" : {
        "layout" : "single",
        "height" : 300,
        "col" : 8
    },
    "title" : {
        "text" : "Market Chart"
    },
    "xAxis" : {
        "type" : "datetime"
    },
    "series" : [{
        "name" : "Buy 1",
        "data" : []
    }, {
        "name" : "Sell 1",
        "data" : []
    }]
}

cfgB = {
    "title" : {
        "text" : "Spread chart"
    },
    "xAxis" : {
        "type" : "datetime"
    },
    "series" : [{
        "name" : "Spread",
        "type" : "column",
        "data" : []
    }]
}

cfgC = {
    "__isStock" : False,
    "title" : {
        "text" : "Pie Chart"
    },
    "series" : [{
        "type" : "pie",
        "name" : "one",
        "data" : [
            ["A", 25],
            ["B", 25],
            ["C", 25],
            ["D", 25]
        ]
    }]
}

cfgD = {
    "extension" : {
        "layout" : "single",
        "col" : 8,
        "height" : "300px"
    },
    "title" : {
        "text" : "Market Chart"
    },
    "series" : [{
        "name" : "Buy 1",
        "data" : []
    }, {
        "name" : "Sell 1",
        "data" : []
    }]
}

cfgE = {
    "__isStock" : False,
    "extension" : {
        "layout" : "single",
        "col" : 4,
        "height" : "300px"
    },
    "title" : {
        "text" : "Pie Chart2"
    },
    "series" : [{
        "type" : "pie",
        "name" : "one",
        "data" : [
            ["A", 25],
            ["B", 25],
            ["C", 25],
            ["D", 25]
        ]
    }]
}
json cfgA = R"({
    "extension" : {
        "layout" : "single",
        "height" : 300,
        "col" : 8
    },
    "title" : {
        "text" : "Market Chart"
    },
    "xAxis" : {
        "type" : "datetime"
    },
    "series" : [{
        "name" : "Buy 1",
        "data" : []
    }, {
        "name" : "Sell 1",
        "data" : []
    }]
})"_json;

json cfgB = R"({
    "title" : {
        "text" : "Spread chart"
    },
    "xAxis" : {
        "type" : "datetime"
    },
    "series" : [{
        "name" : "Spread",
        "type" : "column",
        "data" : []
    }]
})"_json;

json cfgC = R"({
    "__isStock" : false,
    "title" : {
        "text" : "Pie Chart"
    },
    "series" : [{
        "type" : "pie",
        "name" : "one",
        "data" : [
            ["A", 25],
            ["B", 25],
            ["C", 25],
            ["D", 25]
        ]
    }]
})"_json;

json cfgD = R"({
    "extension" : {
        "layout" : "single",
        "col" : 8,
        "height" : "300px"
    },
    "title" : {
        "text" : "Market Chart"
    },
    "series" : [{
        "name" : "Buy 1",
        "data" : []
    }, {
        "name" : "Sell 1",
        "data" : []
    }]
})"_json;

json cfgE = R"({
    "__isStock" : false,
    "extension" : {
        "layout" : "single",
        "col" : 4,
        "height" : "300px"
    },
    "title" : {
        "text" : "Pie Chart2"
    },
    "series" : [{
        "type" : "pie",
        "name" : "one",
        "data" : [
            ["A", 25],
            ["B", 25],
            ["C", 25],
            ["D", 25]
        ]
    }]
})"_json;
-
cfgA.extension.layoutthuộc tínhNếu thuộc tính này được đặt và giá trị là
single , biểu đồ sẽ không được chồng lên nhau (nó sẽ không được hiển thị dưới dạng nhãn thẻ) và sẽ được hiển thị riêng biệt (hiển thị gạch). -
cfgA.extension.heightthuộc tínhThuộc tính này được sử dụng để thiết lập chiều cao của biểu đồ. Giá trị có thể là một loại số, hoặc được thiết lập ở chế độ
300px . -
cfgA.extension.colthuộc tínhThuộc tính này được sử dụng để thiết lập chiều rộng của biểu đồ. chiều rộng trang được chia thành 12 đơn vị tổng cộng, và cài đặt
8 có nghĩa là biểu đồ chiếm 8 đơn vị chiều rộng. Chạy toàn bộ chiến lược ví dụ:
Hiệu ứng hiển thị của các đối tượng cấu hình biểu đồ trong các ví dụ trên:
)
)
-
Đối với dữ liệu trên các đối tượng cấu hình biểu đồ, sửa đổi cấu hình biểu đồ trực tiếp, và sau đó cập nhật biểu đồ để thực hiện cập nhật dữ liệu:
Ví dụ, trong
JavaScriptphần mã của ví dụ (Một gương hoàn hảo):cfgC.series[0].data[0][1] = Math.random() * 100 cfgE.series[0].data[0][1] = Math.random() * 100 // "Update" is actually equivalent to resetting the configuration of the chart chart.update([cfgA, cfgB, cfgC, cfgD, cfgE])Cập nhật dữ liệu bằng
addphương pháp, chẳng hạn như thêm một mục vào biểu đồ bánh, và ở đây sau đó làJavaScriptphần mã của ví dụ (Một gương hoàn hảo):// Add a data point to the pie chart; "add" can only update the data points added by the "add" method, the built-in data points cannot be updated later chart.add(3, { name: "ZZ", y: Math.random() * 100 }) -
Các ví dụ sử dụng kèm theo
Chartchức năngVí dụ vẽ đơn giản:
// This chart is an object in JavaScript language. Before using the "Chart" function, we need to declare an object variable of a chart configuration
var chart = {
    // It is marked as a general chart; if you are interested, you can change it to false and run it
    __isStock: true,
    // Zoom tool
    tooltip: {xDateFormat: '%Y-%m-%d %H:%M:%S, %A'},
    // Title
    title : { text : 'Spread analysis chart'},
    // Choose a range
    rangeSelector: {
        buttons:  [{type: 'hour',count: 1, text: '1h'}, {type: 'hour',count: 3, text: '3h'}, {type: 'hour', count: 8, text: '8h'}, {type: 'all',text: 'All'}],
        selected: 0,
        inputEnabled: false
    },
    // The horizontal axis of the coordinate axis is: x axis, and the currently set "Types of" is: time
    xAxis: { type: 'datetime'},
    // The vertical axis of the coordinate axis is: y axis, and the default value is adjusted with the data size
    yAxis : {
        // Title
        title: {text: 'Spread'},
        // Whether to enable the right vertical axis
        opposite: false
    },
    // Data system column; this attribute holds each data system column (line, K-line diagram, label, etc.)
    series : [
        // The index is 0, and the data in the data column is stored in the data array.
        {name : "line1", id : "line 1,buy1Price", data : []},
        // The index is 1, and set dashStyle: 'shortdash', namely: set the dashed line
        {name : "line2", id : "line 2,lastPrice", dashStyle : 'shortdash', data : []}
    ]
}
function main(){
    // Call the "Chart" function to initialize the chart
    var ObjChart = Chart(chart)
    // Empty
    ObjChart.reset()
    while(true){
        // Get the timestamp of this polling, that is, a millisecond timestamp, used to determine the position of the X axis written to the chart
        var nowTime = new Date().getTime()
        // Get market data
        var ticker = _C(exchange.GetTicker)
        // Get "Buy 1" price from the return value of market data
        var buy1Price = ticker.Buy
        // To obtain the last executed price, in order to avoid the overlap of the 2 lines, we add 1
        var lastPrice = ticker.Last + 1
        // Use timestamp as X value and "Buy 1" price as Y value, and pass them into the data sequence of index 0
        ObjChart.add(0, [nowTime, buy1Price])
        // Same as above
        ObjChart.add(1, [nowTime, lastPrice])
        Sleep(2000)
    }
}
import time chart = { "__isStock" : True, "tooltip" : {"xDateFormat" : "%Y-%m-%d %H:%M:%S, %A"}, "title" : {"text" : "Spread analysis chart"}, "rangeSelector" : { "buttons" : [{"type": "count", "count": 1, "text": "1h"}, {"type": "hour", "count": 3, "text": "3h"}, {"type": "hour", "count": 8, "text": "8h"}, {"type": "all", "text": "All"}], "selected": 0, "inputEnabled": False }, "xAxis": {"type": "datetime"}, "yAxis": { "title": {"text": "Spread"}, "opposite": False }, "series": [{ "name": "line1", "id": "line 1,buy1Price", "data": [] }, { "name": "line2", "id": "line 2,lastPrice", "dashStyle": "shortdash", "data": [] }] } def main(): ObjChart = Chart(chart) ObjChart.reset() while True: nowTime = time.time() * 1000 ticker = exchange.GetTicker() buy1Price = ticker["Buy"] lastPrice = ticker["Last"] + 1 ObjChart.add(0, [nowTime, buy1Price]) ObjChart.add(1, [nowTime, lastPrice]) Sleep(2000)void main() { // When write strategies in C++, try not to declare global variables that are not basic types, so the declaration of the chart configuration objects is in the "main" function json chart = R"({ "__isStock" : true, "tooltip" : {"xDateFormat" : "%Y-%m-%d %H:%M:%S, %A"}, "title" : {"text" : "Spread analysis chart"}, "rangeSelector" : { "buttons" : [{"type": "count", "count": 1, "text": "1h"}, {"type": "hour", "count": 3, "text": "3h"}, {"type": "hour", "count": 8, "text": "8h"}, {"type": "all", "text": "All"}], "selected": 0, "inputEnabled": false }, "xAxis": {"type": "datetime"}, "yAxis": { "title": {"text": "Spread"}, "opposite": false }, "series": [{ "name": "line1", "id": "line 1,buy1Price", "data": [] }, { "name": "line2", "id": "line 2,lastPrice", "dashStyle": "shortdash", "data": [] }] })"_json; auto ObjChart = Chart(chart); ObjChart.reset(); while(true) { auto nowTime = Unix() * 1000; auto ticker = exchange.GetTicker(); auto buy1Price = ticker.Buy; auto lastPrice = ticker.Last + 1.0; ObjChart.add(0, {nowTime, buy1Price}); ObjChart.add(1, {nowTime, lastPrice}); Sleep(2000); } }Ví dụ vẽ đường cong tam giác:
// The object used to initialize the chart
var chart = {
    // Chart title
    title: {text: "line value triggers plotLines value"},
    // The related settings of Y axis
    yAxis: {
        // The horizontal line perpendicular to y axis, used as a trigger line, is an array of structures where multiple trigger lines can be set
        plotLines: [{
            // Trigger line value; set a number, and this line will be displayed in the corresponding numerical position
            value: 0,
            // Set the color of the trigger line
            color: 'red',
            // Width
            width: 2,
            // Labels displayed
            label: {
                // Label text
                text: 'Trigger value',
                // Center label position
                align: 'center'
            }
        }]
    },
    // The related settings of X axis, and here the setting type is the time axis
    xAxis: {type: "datetime"},
    series: [
        {name: "sin", type: "spline", data: []},
        // This is a more important data system column; you can set multiple data system column, according to the array index control
        {name: "cos", type: "spline", data: []}
    ]
}
function main(){
    // Pi
    var pi = 3.1415926535897
    // Variable for recording timestamp
    var time = 0
    // Angle
    var angle = 0
    // Coordinate y value, used to receive sine and cosine values
    var y = 0
    // Call the API to initialize charts with "chart" objects
    var objChart = Chart(chart)
    // When initializing, clear the chart
    objChart.reset()
    // Set the value of the trigger line to 1
    chart.yAxis.plotLines[0].value = 1
    // Loop
    while(true){
        // Get the timestamp of the current moment
        time = new Date().getTime()
        // The angle is increased by 5 degrees every 500ms, and the sine value is calculated
        y = Math.sin(angle * 2 * pi / 360)
        // Write the calculated y value to the data of the corresponding index of the chart; the first parameter of the "add" function is the specified index
        objChart.add(0, [time, y])
        // Calculate the cosine value
        y = Math.cos(angle * 2 * pi / 360)
        objChart.add(1, [time, y])
        // Increase by 5 degrees
        angle += 5
        // Pause for 5 seconds, to avoid drawing too frequently and the data growing too fast
        Sleep(5000)
    }
}
import math import time chart = { "title": {"text": "line value triggers plotLines value"}, "yAxis": { "plotLines": [{ "value": 0, "color": "red", "width": 2, "label": { "text": "Trigger value", "align": "center" } }] }, "xAxis": {"type": "datetime"}, "series": [{"name": "sin", "type": "spline", "data": []}, {"name": "cos", "type": "spline", "data": []}] } def main(): pi = 3.1415926535897 ts = 0 angle = 0 y = 0 objChart = Chart(chart) objChart.reset() chart["yAxis"]["plotLines"][0]["value"] = 1 while True: ts = time.time() * 1000 y = math.sin(angle * 2 * pi / 360) objChart.add(0, [ts, y]) y = math.cos(angle * 2 * pi / 360) objChart.add(1, [ts, y]) angle += 5 Sleep(5000)void main() { json chart = R"({ "title": {"text": "line value triggers plotLines value"}, "yAxis": { "plotLines": [{ "value": 0, "color": "red", "width": 2, "label": { "text": "Trigger value", "align": "center" } }] }, "xAxis": {"type": "datetime"}, "series": [{"name": "sin", "type": "spline", "data": []}, {"name": "cos", "type": "spline", "data": []}] })"_json; auto pi = 3.1415926535897; auto ts = 0; auto angle = 0.0; auto y = 0.0; auto objChart = Chart(chart); objChart.reset(); chart["yAxis"]["plotLines"][0]["value"] = 1; while(true) { ts = Unix() * 1000; y = sin(angle * 2 * pi / 360); objChart.add(0, {ts, y}); y = cos(angle * 2 * pi / 360); objChart.add(1, {ts, y}); angle += 5; Sleep(5000); } }Trong
cppchiến lược,Charthàm cũng có thể sử dụng một chuỗi mã hóa để cấu hình biểu đồ:void main () { Chart c = Chart(R"EOF({"chart":{"type":"line"},"title":{"text":"Simple chart"},"xAxis":{"title":{"text":"Date"}},"yAxis":{"title":{"text":"Number"}},"series":[{"name":"number","data":[]}]})EOF"); c.reset(); for (size_t i = 0; i < 10; i++) { // For example, int64 of "sprintf" function has different parameters in 32-bit and 64-bit, so it is best to use "toString" to transfer the platform-related types into strings and then pass c.add(0, format("[%s, %d]", toString(Unix() + i).c_str(), rand() % 100)); } })
-
Một ví dụ phức tạp về biểu đồ hỗn hợpĐịa chỉ chiến lược JavaScript
/*backtest
start: 2020-03-11 00:00:00
end: 2020-04-09 23:59:00
period: 1d
exchanges: [{"eid":"Bitfinex","currency":"BTC_USD"}]
*/

var chartCfg = {
    subtitle: {
        text: "subtitle",
    },
    yAxis: [{
        height: "40%",
        lineWidth: 2,
        title: {
            text: 'PnL',
        },
        tickPixelInterval: 20,
        minorGridLineWidth: 1,
        minorTickWidth: 0,
        opposite: true,
        labels: {
            align: "right",
            x: -3,
        }
    }, {
        title: {
            text: 'Profit',
        },
        top: "42%",
        height: "18%",
        offset: 0,
        lineWidth: 2
    }, {
        title: {
            text: 'Vol',
        },
        top: '62%',
        height: '18%',
        offset: 0,
        lineWidth: 2
    }, {
        title: {
            text: 'Asset',
        },
        top: '82%',
        height: '18%',
        offset: 0,
        lineWidth: 2
    }],
    series: [{
        name: 'PnL',
        data: [],
        id: 'primary',
        tooltip: {
            xDateFormat: '%Y-%m-%d %H:%M:%S'
        },
        yAxis: 0
    }, {
        type: 'column',
        lineWidth: 2,
        name: 'Profit',
        data: [],
        yAxis: 1,
    }, {
        type: 'column',
        name: 'Trade',
        data: [],
        yAxis: 2
    }, {
        type: 'area',
        step: true,
        lineWidth: 0,
        name: 'Long',
        data: [],
        yAxis: 2
    }, {
        type: 'area',
        step: true,
        lineWidth: 0,
        name: 'Short',
        data: [],
        yAxis: 2
    }, {
        type: 'line',
        step: true,
        color: '#5b4b00',
        name: 'Asset',
        data: [],
        yAxis: 3
    }, {
        type: 'pie',
        innerSize: '70%',
        name: 'Random',
        data: [],
        center: ['3%', '6%'],
        size: '15%',
        dataLabels: {
            enabled: false
        },
        startAngle: -90,
        endAngle: 90,
    }],
};

function main() {
    let c = Chart(chartCfg);
    let preTicker = null;
    while (true) {
        let t = exchange.GetTicker();

        c.add(0, [t.Time, t.Last]); // PnL
        c.add(1, [t.Time, preTicker ? t.Last - preTicker.Last : 0]); // profit
        let r = Math.random();
        var pos = parseInt(t.Time/86400);
        c.add(2, [t.Time, pos/2]); // Vol
        c.add(3, [t.Time, r > 0.8 ? pos : null]); // Long
        c.add(4, [t.Time, r < 0.8 ? -pos : null]); // Short
        c.add(5, [t.Time, Math.random() * 100]); // Asset
        // update pie
        chartCfg.series[chartCfg.series.length-1].data = [
            ["A", Math.random()*100],
            ["B", Math.random()*100],
         ];
        c.update(chartCfg)
        preTicker = t;
    }
}
'''backtest
start: 2020-03-11 00:00:00
end: 2020-04-09 23:59:00
period: 1d
exchanges: [{"eid":"Bitfinex","currency":"BTC_USD"}]
'''

import random

chartCfg = {
    "subtitle": {
        "text": "subtitle"
    },
    "yAxis": [{
        "height": "40%",
        "lineWidth": 2,
        "title": {
            "text": 'PnL'
        },
        "tickPixelInterval": 20,
        "minorGridLineWidth": 1,
        "minorTickWidth": 0,
        "opposite": True,
        "labels": {
            "align": "right",
            "x": -3
        }
    }, {
        "title": {
            "text": 'Profit'
        },
        "top": "42%",
        "height": "18%",
        "offset": 0,
        "lineWidth": 2
    }, {
        "title": {
            "text": 'Vol'
        },
        "top": '62%',
        "height": '18%',
        "offset": 0,
        "lineWidth": 2
    }, {
        "title": {
            "text": 'Asset'
        },
        "top": '82%',
        "height": '18%',
        "offset": 0,
        "lineWidth": 2
    }],
    "series": [{
        "name": 'PnL',
        "data": [],
        "id": 'primary',
        "tooltip": {
            "xDateFormat": '%Y-%m-%d %H:%M:%S'
        },
        "yAxis": 0
    }, {
        "type": 'column',
        "lineWidth": 2,
        "name": 'Profit',
        "data": [],
        "yAxis": 1
    }, {
        "type": 'column',
        "name": 'Trade',
        "data": [],
        "yAxis": 2
    }, {
        "type": 'area',
        "step": True,
        "lineWidth": 0,
        "name": 'Long',
        "data": [],
        "yAxis": 2
    }, {
        "type": 'area',
        "step": True,
        "lineWidth": 0,
        "name": 'Short',
        "data": [],
        "yAxis": 2
    }, {
        "type": 'line',
        "step": True,
        "color": '#5b4b00',
        "name": 'Asset',
        "data": [],
        "yAxis": 3
    }, {
        "type": 'pie',
        "innerSize": '70%',
        "name": 'Random',
        "data": [],
        "center": ['3%', '6%'],
        "size": '15%',
        "dataLabels": {
            "enabled": False
        },
        "startAngle": -90,
        "endAngle": 90
    }]
}

def main():
    c = Chart(chartCfg)
    preTicker = None
    while True:
        t = exchange.GetTicker()
        c.add(0, [t["Time"], t["Last"]])
        profit = t["Last"] - preTicker["Last"] if preTicker else 0
        c.add(1, [t["Time"], profit])
        r = random.random()
        pos = t["Time"] / 86400
        c.add(2, [t["Time"], pos / 2])
        long = pos if r > 0.8 else None
        c.add(3, [t["Time"], long])
        short = -pos if r < 0.8 else None
        c.add(4, [t["Time"], short])
        c.add(5, [t["Time"], random.random() * 100])

        # update pie
        chartCfg["series"][len(chartCfg["series"]) - 1]["data"] = [
            ["A", random.random() * 100],
            ["B", random.random() * 100]
        ]
        c.update(chartCfg)
        preTicker = t
/*backtest
start: 2020-03-11 00:00:00
end: 2020-04-09 23:59:00
period: 1d
exchanges: [{"eid":"Bitfinex","currency":"BTC_USD"}]
*/

void main() {
    json chartCfg = R"({
        "subtitle": {
            "text": "subtitle"
        },
        "yAxis": [{
            "height": "40%",
            "lineWidth": 2,
            "title": {
                "text": "PnL"
            },
            "tickPixelInterval": 20,
            "minorGridLineWidth": 1,
            "minorTickWidth": 0,
            "opposite": true,
            "labels": {
                "align": "right",
                "x": -3
            }
        }, {
            "title": {
                "text": "Profit"
            },
            "top": "42%",
            "height": "18%",
            "offset": 0,
            "lineWidth": 2
        }, {
            "title": {
                "text": "Vol"
            },
            "top": "62%",
            "height": "18%",
            "offset": 0,
            "lineWidth": 2
        }, {
            "title": {
                "text": "Asset"
            },
            "top": "82%",
            "height": "18%",
            "offset": 0,
            "lineWidth": 2
        }],
        "series": [{
            "name": "PnL",
            "data": [],
            "id": "primary",
            "tooltip": {
                "xDateFormat": "%Y-%m-%d %H:%M:%S"
            },
            "yAxis": 0
        }, {
            "type": "column",
            "lineWidth": 2,
            "name": "Profit",
            "data": [],
            "yAxis": 1
        }, {
            "type": "column",
            "name": "Trade",
            "data": [],
            "yAxis": 2
        }, {
            "type": "area",
            "step": true,
            "lineWidth": 0,
            "name": "Long",
            "data": [],
            "yAxis": 2
        }, {
            "type": "area",
            "step": true,
            "lineWidth": 0,
            "name": "Short",
            "data": [],
            "yAxis": 2
        }, {
            "type": "line",
            "step": true,
            "color": "#5b4b00",
            "name": "Asset",
            "data": [],
            "yAxis": 3
        }, {
            "type": "pie",
            "innerSize": "70%",
            "name": "Random",
            "data": [],
            "center": ["3%", "6%"],
            "size": "15%",
            "dataLabels": {
                "enabled": false
            },
            "startAngle": -90,
            "endAngle": 90
        }]
    })"_json;

    Chart c = Chart(chartCfg);
    Ticker preTicker;
    while(true) {
        auto t = exchange.GetTicker();
        c.add(0, {t.Time, t.Last});
        auto profit = preTicker.Valid ? t.Last - preTicker.Last : 0;
        c.add(1, {t.Time, profit});
        auto r = rand() % 100;
        auto pos = t.Time / 86400.0;
        c.add(2, {t.Time, pos / 2.0});
        auto longPos = r > 0.8 ? pos : NULL;
        c.add(3, {t.Time, longPos});
        auto shortPos = r < 0.8 ? -pos : NULL;
        c.add(4, {t.Time, shortPos});
        c.add(5, {t.Time, rand() % 100});

        // update pie
        json pie = R"([["A", 0], ["B", 0]])"_json;
        pie[0][1] = rand() % 100;
        pie[1][1] = rand() % 100;
        chartCfg["series"][chartCfg["series"].size() - 1]["data"] = pie;

        c.update(chartCfg);
        preTicker = t;
    }
}
Trong số các biểu đồ,piebiểu đồ là một biểu đồ không có trục thời gian, và cấu hình biểu đồ cần được cập nhật trực tiếp khi cập nhật dữ liệu.c.update(chartCfg)để cập nhật biểu đồ như sau:
    // update pie
    chartCfg.series[chartCfg.series.length-1].data = [
        ["A", Math.random()*100],
        ["B", Math.random()*100],
    ];
    c.update(chartCfg)
    # update pie
    chartCfg["series"][len(chartCfg["series"]) - 1]["data"] = [
        ["A", random.random() * 100],
        ["B", random.random() * 100]
    ]
    c.update(chartCfg)
    // update pie
    json pie = R"([["A", 0], ["B", 0]])"_json;
    pie[0][1] = rand() % 100;
    pie[1][1] = rand() % 100;
    chartCfg["series"][chartCfg["series"].size() - 1]["data"] = pie;
    c.update(chartCfg);
Kết quả hoạt động: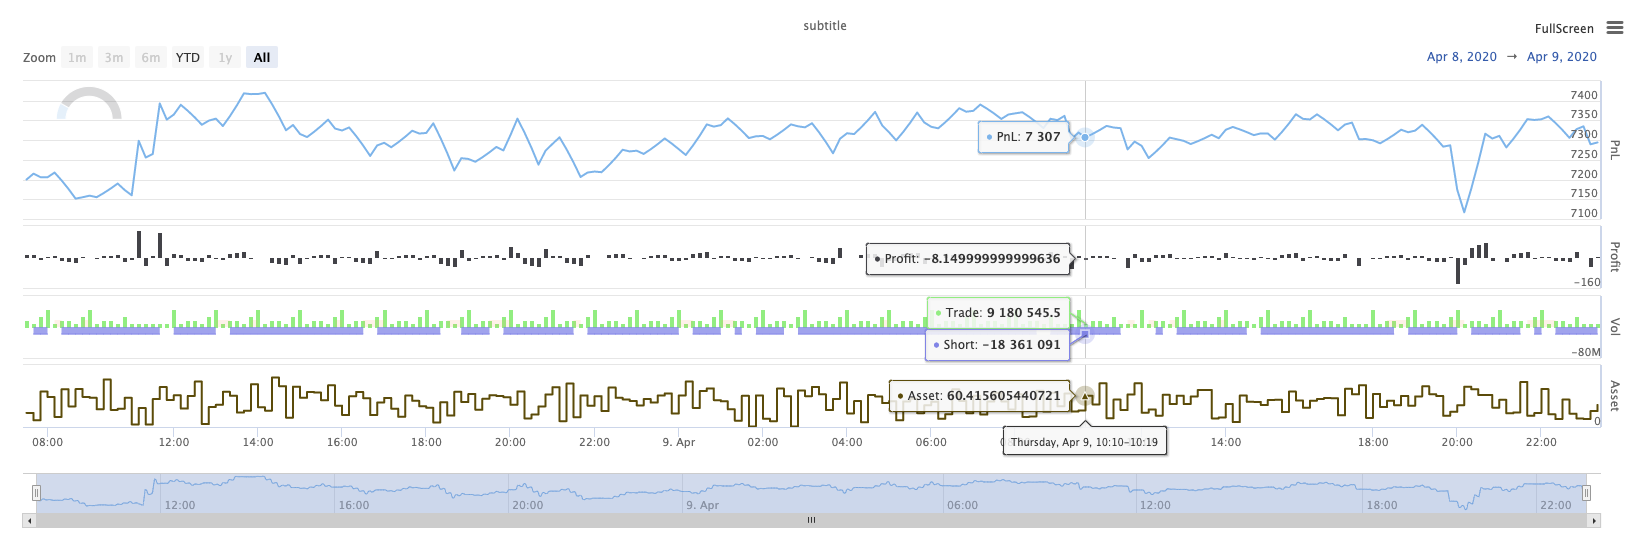
KLineChart ((...)
KLineChart(chartCfg), hàm này được sử dụng để sử dụng một phương pháp vẽ tương tự như ngôn ngữ Pine cho vẽ tùy chỉnh khi chiến lược đang chạy.KLineChart()phương pháp hoặc một trongChart() methods.
Mã tham chiếu:
function main() {
    // Call the KLineChart function to create a chart control object c
    let c = KLineChart({
        overlay: true
    })

    // Use the spot exchange object test to obtain K-line data. If you use the futures exchange object test, you need to set up the contract first.
    let bars = exchange.GetRecords()
    if (!bars) {
        return
    }

    bars.forEach(function(bar, index) {
        c.begin(bar)
        c.barcolor(bar.Close > bar.Open ? 'rgba(255, 0, 0, 0.2)' : 'rgba(0, 0, 0, 0.2)')
        if (bar.Close > bar.Open) {
            c.bgcolor('rgba(0, 255, 0, 0.5)')
        }
        let h = c.plot(bar.High, 'high')
        let l = c.plot(bar.Low, 'low')

        c.fill(h, l, {
            color: bar.Close > bar.Open ? 'rgba(255, 0, 0, 0.2)' : 'rgba(255, 0, 0, 0.2)'
        })
        c.hline(bar.High)
        c.plotarrow(bar.Close - bar.Open)
        c.plotshape(bar.Low, {
            style: 'diamond'
        })
        c.plotchar(bar.Close, {
            char: 'X'
        })
        c.plotcandle(bar.Open*0.9, bar.High*0.9, bar.Low*0.9, bar.Close*0.9)
        if (bar.Close > bar.Open) {
            // long/short/closelong/closeshort
            c.signal("long", bar.High, 1.5)
        } else if (bar.Close < bar.Open) {
            c.signal("closelong", bar.Low, 1.5)
        }
        c.close()
    })
}
def main():
    # Call the KLineChart function to create a chart control object c
    c = KLineChart({
        "overlay": True
    })

    # Use the spot exchange object test to obtain K-line data. If you use the futures exchange object test, you need to set up the contract first.
    bars = exchange.GetRecords()
    if not bars:
        return

    for bar in bars:
        c.begin(bar)
        c.barcolor('rgba(255, 0, 0, 0.2)' if bar.Close > bar.Open else 'rgba(0, 0, 0, 0.2)')
        if bar.Close > bar.Open:
            c.bgcolor('rgba(0, 255, 0, 0.5)')

        h = c.plot(bar.High, 'high')
        l = c.plot(bar.Low, 'low')

        c.fill(h, l, 'rgba(255, 0, 0, 0.2)' if bar.Close > bar.Open else 'rgba(255, 0, 0, 0.2)')
        c.hline(bar.High)
        c.plotarrow(bar.Close - bar.Open)
        c.plotshape(bar.Low, style = 'diamond')
        c.plotchar(bar.Close, char = 'X')
        c.plotcandle(bar.Open*0.9, bar.High*0.9, bar.Low*0.9, bar.Close*0.9)
        if bar.Close > bar.Open:
            # long/short/closelong/closeshort
            c.signal("long", bar.High, 1.5)
        elif bar.Close < bar.Open:
            c.signal("closelong", bar.Low, 1.5)

        c.close()
// Not supported currently
Nếu phải có một đối tượng điều khiển biểu đồ để vẽ trong khu vực vẽ tùy chỉnh của chiến lược, sử dụng chức năngKLineChartCác tham số của cácKLineChartchức năng là một cấu trúc cấu hình biểu đồ, cấu trúc biểu đồ được sử dụng trong mã tham chiếu là rất đơn giản{overlay: true}). Cấu trúc cấu hình biểu đồ này chỉ thiết lập nội dung vẽ để xuất trên biểu đồ chính.overlayđược thiết lập thànhfalse, nội dung trên biểu đồ được đầu ra trên biểu đồ phụ. Nếu bạn cần phải chỉ định một chức năng vẽ để vẽ trên biểu đồ chính, bạn cũng có thể chỉ định các tham sốoverlaynhưtruetrong cuộc gọi hàm cụ thể.
Hoạt động vẽ được thực hiện bằng cách đi qua dữ liệu đường K. Hoạt động vẽ phải bắt đầu với mộtc.begin(bar)gọi chức năng và kết thúc với mộtc.close()Các chức năng giao diện vẽ của ngôn ngữ Pine được hỗ trợ trong hoạt động vẽ là:
-
Barcolor: Đặt màu K-line
barcolor ((color, offset, có thể chỉnh sửa, show_last, title, display)
c.barcolor(bar.Close > bar.Open ? 'rgba(255, 0, 0, 0.2)' : 'rgba(0, 0, 0, 0.2)') // Use the example illustrated in the reference code in this example, without giving unnecessary detailsc.barcolor('rgba(255, 0, 0, 0.2)' if bar.Close > bar.Open else 'rgba(0, 0, 0, 0.2)')displayCác thông số tùy chọn:không có, tất cả
-
bgcolor: Điền nền của đường K với màu được chỉ định
bgcolor ((color, offset, có thể chỉnh sửa, show_last, title, display, overlay)
c.bgcolor('rgba(0, 255, 0, 0.5)')c.bgcolor('rgba(0, 255, 0, 0.5)')displayCác thông số tùy chọn:không có, tất cả
-
biểu đồ: biểu đồ một loạt các dữ liệu trên biểu đồ
plot ((series, title, color, linewidth, style, trackprice, histbase, offset, join, editable, show_last, display)
c.plot(bar.High, 'high')h = c.plot(bar.High, 'high')styleCác thông số tùy chọn:stepline_diamond , stepline , cross , areabr , area , circles , columns , histogram , linebr , line displayCác thông số tùy chọn:không có, tất cả
-
Fill: Fill background between two drawings or hlines with the provided color (Làm đầy nền giữa hai bản vẽ hoặc dòng với màu được cung cấp)
fill ((hline1, hline2, color, title, editable, fillgaps, display)
let h = c.plot(bar.High, 'high')
let l = c.plot(bar.Low, 'low')

c.fill(h, l, {color: bar.Close > bar.Open ? 'rgba(255, 0, 0, 0.2)' : 'rgba(255, 0, 0, 0.2)'})
h = c.plot(bar.High, 'high') l = c.plot(bar.Low, 'low') c.fill(h, l, {"color": 'rgba(255, 0, 0, 0.2)' if bar.Close > bar.Open else 'rgba(255, 0, 0, 0.2)'})displayCác thông số tùy chọn:không có, tất cả
Kể từ khi
JavaScriptngôn ngữ không thể xác định các tham số đến theo tên của các tham số chức năng chính thức, để giải quyết vấn đề này, một{key: value}cấu trúc có thể được sử dụng để chỉ định các thông số được truyền trong một tên thông số chính thức nhất định, ví dụ như trong mã tham chiếu, sử dụng{color: bar.Close > bar.Open ? 'rgba(255, 0, 0, 0.2)' : 'rgba(255, 0, 0, 0.2)'}để xác địnhcolortham số củafillNếu bạn cần xác định các tham số với nhiều tên tham số liên tiếp, bạn có thể sử dụng{key1: value1, key2: value2, key3: value3}Ví dụ, trong ví dụ này, thêm một tham số xác định mộttitle:{color: bar.Close > bar.Open ? 'rgba(255, 0, 0, 0.2)' : 'rgba(255, 0, 0, 0.2)', title: 'fill'}.Đối với giá trị màu sắc, bạn có thể sử dụng
'rgba(255, 0, 0, 0.2)'phương pháp để thiết lập, hoặc sử dụng'#FF0000'phương pháp để thiết lập. -
hline: Lập một đường ngang ở mức giá cố định nhất định
hline ((giá, tiêu đề, màu sắc, kiểu dòng, chiều rộng dòng, có thể chỉnh sửa, hiển thị)
c.hline(bar.High)c.hline(bar.High)linestyleCác thông số tùy chọn:dashed , dotted , solid displayCác thông số tùy chọn:không có, tất cả
-
Plotarrow: Kéo mũi tên lên và xuống biểu đồ
Plotarrow ((series, title, colorup, colorordown, offset, minheight, maxheight, có thể chỉnh sửa, show_last, display)
c.plotarrow(bar.Close - bar.Open)c.plotarrow(bar.Close - bar.Open)displayCác thông số tùy chọn:không có, tất cả
-
Plotshape: Kéo hình dạng trực quan trên biểu đồ
plotshape ((series, title, style, location, color, offset, text, textcolor, editable, size, show_last, display)
c.plotshape(bar.Low, {style: 'diamond'})c.plotshape(bar.Low, style = 'diamond')-
styleCác thông số tùy chọn:diamond , square , label_down , label_up , arrow_down , arrow_up , circle , flag , triangle_down , triangle_up , cross , xcross -
locationCác thông số tùy chọn:bảng trên , bảng dưới , top , bottom , absolute -
sizecác thông số tùy chọn:10px , 14px , 20px , 40px , 80px , so với size.tiny,size.small,size.normal,size.large,size.hugebằng ngôn ngữ Pinesize.autolàsize.small. -
displayCác thông số tùy chọn:không có, tất cả
-
-
plotchar: Kéo hình dạng có thể nhìn thấy trên biểu đồ bằng cách sử dụng bất kỳ ký tự Unicode nào
plotchar ((series, title, char, location, color, offset, text, textcolor, editable, size, show_last, display)
c.plotchar(bar.Close, {char: 'X'})c.plotchar(bar.Close, char = 'X')-
locationCác thông số tùy chọn:bảng trên , bảng dưới , top , bottom , absolute -
sizecác thông số tùy chọn:10px , 14px , 20px , 40px , 80px , so với size.tiny,size.small,size.normal,size.large,size.hugebằng ngôn ngữ Pinesize.autolàsize.small. -
displayCác thông số tùy chọn:không có, tất cả
-
-
plotcandle: Kéo biểu đồ đường K trên biểu đồ
plotcandle ((mở, cao, thấp, đóng, tiêu đề, màu sắc, wickcolor, có thể chỉnh sửa, show_last, bordercolor, display)
c.plotcandle(bar.Open*0.9, bar.High*0.9, bar.Low*0.9, bar.Close*0.9)c.plotcandle(bar.Open*0.9, bar.High*0.9, bar.Low*0.9, bar.Close*0.9)displayCác thông số tùy chọn:không có, tất cả
-
tín hiệu: Các hàm không có sẵn trong ngôn ngữ Pine được sử dụng ở đây để vẽ tín hiệu mua và bán
tín hiệu ((hướng, giá, số lượng, id)
c.signal("long", bar.High, 1.5)c.signal("long", bar.High, 1.5)Các thông số đầu vào
"long"chỉ định hướng giao dịch, tùy chọn"long","closelong","short","closeshort". Các thông số đếnbar.Highlà vị trí trục Y của tín hiệu đánh dấu.1.5đại diện cho số lượng giao dịch của tín hiệu. Các tham số thứ tư có thể được truyền vào để thay thế nội dung văn bản được vẽ theo mặc định."closelong".
Đối với một số màu sắc, phong cách và các thiết lập khác được sử dụng trong các cuộc gọi hàm trên, vui lòng tham khảoBài viết đặc biệt về vẽ với chức năng KLineChart
LogReset()
LogReset()là một thông số để xóa các nhật ký. Bạn có thể truyền vào một tham số nguyên để chỉ định số lượng nhật ký gần đây để giữ lại, và xóa phần còn lại của các nhật ký. Lịch khởi động được đếm mỗi khi nó được bắt đầu, vì vậy nếu không có tham số được truyền vào, và không có đầu ra nhật ký ở đầu của chiến lược, nhật ký sẽ không được hiển thị ở tất cả, chờ đợi nhật ký docker để trở lại (không phải là một tình huống bất thường).
function main() {
    // Mainta