Người mới bắt đầu, hãy kiểm tra nó Đưa bạn đến giao dịch định lượng tiền điện tử (5)
Tác giả:Ninabadass, Tạo: 2022-04-18 17:20:53, Cập nhật: 2022-04-18 17:30:27Người mới bắt đầu, hãy kiểm tra nó Đưa bạn đến giao dịch định lượng tiền điện tử (5)
Trong bài viết trước, chúng tôi đã giải thích phân tích logic giao dịch của một chiến lược lưới đơn giản.
-
Phân tích logic giao dịch Như chúng tôi đã đề cập trong bài viết trước, miễn là bạn đi qua mỗi đường lưới của lưới và đánh giá rằng giá hiện tại vượt qua đường lưới lên hoặc xuống, hành động giao dịch có thể được kích hoạt.
Chi tiết đầu tiên chúng ta phải xem xét là thiết kế của lưới vô hạn.
createNetđể tạo ra cấu trúc dữ liệu lưới ban đầu cùng nhau? Chức năng này tạo ra một cấu trúc dữ liệu lưới với một số lượng hữu hạn các đường lưới. Vì vậy, nếu khi chiến lược đang chạy, giá vượt ra ngoài ranh giới của cấu trúc dữ liệu lưới này (ngoài đường lưới phía trên nơi giá cao nhất, và đường lưới phía dưới nơi giá thấp nhất)? Vì vậy, trước tiên chúng ta cần thêm một cơ chế mở rộng vào cấu trúc dữ liệu lưới.Bắt đầu viết chiến lược chức năng chính, và chức năng chính là mã mà chiến lược bắt đầu thực hiện.
var diff = 50                                 // global variable, the grid interval, can be designed as parameter; for an easy explanation, we write it in an infinite loop
function main() {
    // After the bot starts running, execute the strategy code from here
    var ticker = _C(exchange.GetTicker)       // obtain the latest ticker data in the market; for the ticker data structure, you can refer to FMZ API documentation: https://www.fmz.com/api#ticker
    var net = createNet(ticker.Last, diff)    // the function to initially construct the grid data structure we designed in the previous article; here we construct a grid data structure net

    while (true) {                            // then, the program logic enters the while infinite loop, and the strategy will repeatedly execute the code within the {} symbol from here
        ticker = _C(exchange.GetTicker)       // the first line of the infinite loop code gets the latest market quote data, and updates it to the variable ticker
        // check the grid range
        while (ticker.Last >= net[net.length - 1].price) {
            net.push({
                buy : false,
                sell : false,
                price : net[net.length - 1].price + diff,
            })
        }
        while (ticker.Last <= net[0].price) {
            var price = net[0].price - diff
            if (price <= 0) {
                break
            }
            net.unshift({
                buy : false,
                sell : false,
                price : price,
            })
        }

        // the code is not completed...
    }
}
Đây là mã làm cho cấu trúc dữ liệu lưới có thể mở rộng (được trích từ mã trên):
      // check the grid range
      while (ticker.Last >= net[net.length - 1].price) {   // if the price exceeds the grid line with the highest price in the grid,
          net.push({                                       // add a new grid line after the grid line with the highest price in the grid
              buy : false,                                 // initialize the sell mark
              sell : false,                                // initialize the buy mark
              price : net[net.length - 1].price + diff,    // add a grid interval on the basis of the previous highest price
          })
      }
      while (ticker.Last <= net[0].price) {                // if the price is lower than the grid line with the lowest price in the grid,
          var price = net[0].price - diff                  // distinguished from adding upwards, you should notice the price of the newly added grid line downwards cannot be less than or equal to 0, so you need to judge here
          if (price <= 0) {                                // do not add when the price is less than or equal to 0, and break the loop
              break
          }
          net.unshift({                                    // add a new grid line before the grid line with the lowest price in the grid
              buy : false,
              sell : false,
              price : price,
          })
      }
Tiếp theo, chúng ta cần xem xét cách thực hiện kích hoạt giao dịch.
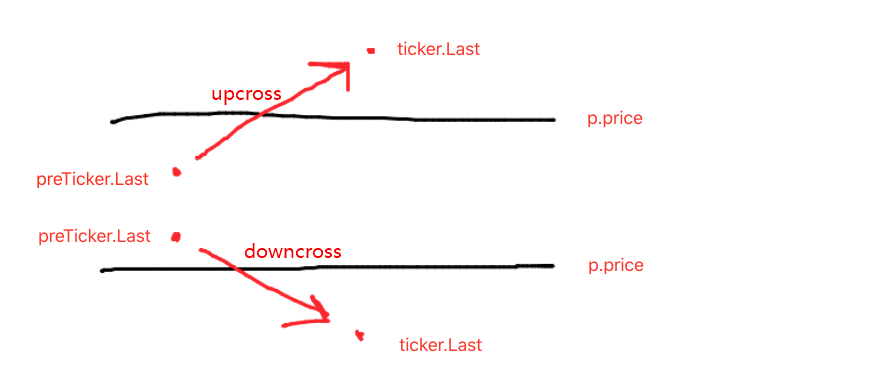
var diff = 50
var amount = 0.002       // add a global variable, which can also be designed as a parameter; for easy explanation, we can write it in an infinite loop
                         // the parameter controls the trading amount on the grid line each time the trading is triggered
function main() {
    var ticker = _C(exchange.GetTicker)
    var net = createNet(ticker.Last, diff)
    var preTicker = ticker       // before the start of the main (infinite) loop, set a variable, to record the market quotes of last time
    while (true) {
        ticker = _C(exchange.GetTicker)
        // check the grid range
        while (ticker.Last >= net[net.length - 1].price) {
            net.push({
                buy : false,
                sell : false,
                price : net[net.length - 1].price + diff,
            })
        }
        while (ticker.Last <= net[0].price) {
            var price = net[0].price - diff
            if (price <= 0) {
                break
            }
            net.unshift({
                buy : false,
                sell : false,
                price : price,
            })
        }

        // index the grid
        for (var i = 0 ; i < net.length ; i++) {     // traverse all grid lines in the grid data structure
            var p = net[i]
            if (preTicker.Last < p.price && ticker.Last > p.price) {         // upcross, and sell; when the current node has been traded, no matter SELL or BUY, no more trade
                if (i != 0) {
                    var downP = net[i - 1]
                    if (downP.buy) {
                        exchange.Sell(-1, amount, ticker)
                        downP.buy = false
                        p.sell = false
                        continue
                    }
                }
                if (!p.sell && !p.buy) {
                    exchange.Sell(-1, amount, ticker)
                    p.sell = true
                }
            } else if (preTicker.Last > p.price && ticker.Last < p.price) {  // downcross, and buy
                if (i != net.length - 1) {
                    var upP = net[i + 1]
                    if (upP.sell) {
                        exchange.Buy(-1, amount * ticker.Last, ticker)
                        upP.sell = false
                        p.buy = false
                        continue
                    }
                }
                if (!p.buy && !p.sell) {
                    exchange.Buy(-1, amount * ticker.Last, ticker)
                    p.buy = true
                }
            }
        }
        preTicker = ticker    // record the current market quotes in preTicker, which will be used as the "last" market quote data to compare with the new one in next loop, to judge upcross and downcross
        Sleep(500)
    }
}
Bạn có thể thấy:
- Điều kiện vượt qua đường lưới điện:
preTicker.Last < p.price && ticker.Last > p.price - Điều kiện vượt qua đường lưới điện:
preTicker.Last > p.price && ticker.Last < p.price
Đây là những gì đã được nói về trong bài viết trước:
Đánh giá upcross hoặc downcross chỉ là bước đầu tiên để xác định xem có nên đặt hàng và giao dịch hay không, và dấu hiệu trong dữ liệu đường lưới cũng cần phải được đánh giá.
Nếu nó là ngược, sau đó đánh giá xem giá có thấp hơn đường lưới hiện tại, cũng như dấu mua trên đường lưới mới nhất; nếu giá trị của dấu mua là đúng, điều đó có nghĩa là đường lưới cuối cùng đã thực hiện mua, và đặt lại dấu mua của đường lưới cuối cùng là sai, và đặt lại dấu bán của đường lưới hiện tại là sai.
Sau khi đánh giá các điều kiện được đề cập ở đây, nếu chúng không được kích hoạt, thì tiếp tục đánh giá. Nếu dấu mua và dấu bán của đường lưới hiện tại đều sai, điều đó có nghĩa là đường lưới hiện tại có thể giao dịch; vì nó là ngược, ở đây chúng ta thực hiện hoạt động bán, và đánh dấu dấu bán của đường lưới là đúng sau khi thực hiện.
Lý thuyết xử lý downcross là như nhau. (những người mới có thể tự mình suy nghĩ về điều này.)
- Điều kiện vượt qua đường lưới điện:
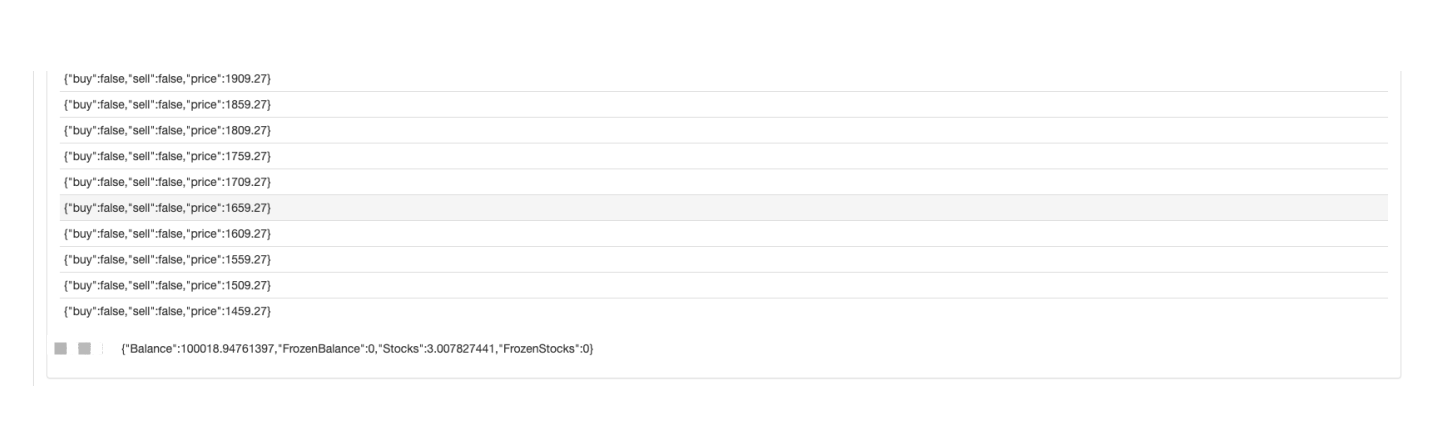
Kiểm tra hoàn chỉnh chiến lược
Để xem một số dữ liệu trong quá trình backtest, một hàmshowTblđược viết để hiển thị dữ liệu.
function showTbl(arr) {
    var tbl = {
        type : "table",
        title : "grid",
        cols : ["grid information"],
        rows : []
    }
    var arrReverse = arr.slice(0).reverse()
    _.each(arrReverse, function(ele) {
        var color = ""
        if (ele.buy) {
            color = "#FF0000"
        } else if (ele.sell) {
            color = "#00FF00"
        }
        tbl.rows.push([JSON.stringify(ele) + color])
    })
    LogStatus(_D(), "\n`" + JSON.stringify(tbl) + "`", "\n account information:", exchange.GetAccount())
}
Mã chiến lược đầy đủ:
/*backtest
start: 2021-04-01 22:00:00
end: 2021-05-22 00:00:00
period: 1d
basePeriod: 1m
exchanges: [{"eid":"OKEX","currency":"ETH_USDT","balance":100000}]
*/

var diff = 50
var amount = 0.002
function createNet(begin, diff) {
    var oneSideNums = 10
    var up = []
    var down = []
    for (var i = 0 ; i < oneSideNums ; i++) {
        var upObj = {
            buy : false,
            sell : false,
            price : begin + diff / 2 + i * diff,
        }
        up.push(upObj)

        var j = (oneSideNums - 1) - i
        var downObj = {
            buy : false,
            sell : false,
            price : begin - diff / 2 - j * diff,
        }
        if (downObj.price <= 0) {  // the price cannot be less than or equal to 0
            continue
        }
        down.push(downObj)
    }

    return down.concat(up)
}

function showTbl(arr) {
    var tbl = {
        type : "table",
        title : "grid",
        cols : ["grid information"],
        rows : []
    }
    var arrReverse = arr.slice(0).reverse()
    _.each(arrReverse, function(ele) {
        var color = ""
        if (ele.buy) {
            color = "#FF0000"
        } else if (ele.sell) {
            color = "#00FF00"
        }
        tbl.rows.push([JSON.stringify(ele) + color])
    })
    LogStatus(_D(), "\n`" + JSON.stringify(tbl) + "`", "\n account information:", exchange.GetAccount())
}

function main() {
    var ticker = _C(exchange.GetTicker)
    var net = createNet(ticker.Last, diff)
    var preTicker = ticker
    while (true) {
        ticker = _C(exchange.GetTicker)
        // check the grid range
        while (ticker.Last >= net[net.length - 1].price) {
            net.push({
                buy : false,
                sell : false,
                price : net[net.length - 1].price + diff,
            })
        }
        while (ticker.Last <= net[0].price) {
            var price = net[0].price - diff
            if (price <= 0) {
                break
            }
            net.unshift({
                buy : false,
                sell : false,
                price : price,
            })
        }

        // index grid
        for (var i = 0 ; i < net.length ; i++) {
            var p = net[i]
            if (preTicker.Last < p.price && ticker.Last > p.price) {         // upcross, and sell; when the current node has been traded, no matter SELL or BUY, no more trade
                if (i != 0) {
                    var downP = net[i - 1]
                    if (downP.buy) {
                        exchange.Sell(-1, amount, ticker)
                        downP.buy = false
                        p.sell = false
                        continue
                    }
                }
                if (!p.sell && !p.buy) {
                    exchange.Sell(-1, amount, ticker)
                    p.sell = true
                }
            } else if (preTicker.Last > p.price && ticker.Last < p.price) {  // downcross, and buy
                if (i != net.length - 1) {
                    var upP = net[i + 1]
                    if (upP.sell) {
                        exchange.Buy(-1, amount * ticker.Last, ticker)
                        upP.sell = false
                        p.buy = false
                        continue
                    }
                }
                if (!p.buy && !p.sell) {
                    exchange.Buy(-1, amount * ticker.Last, ticker)
                    p.buy = true
                }
            }
        }

        showTbl(net)
        preTicker = ticker
        Sleep(500)
    }
}
Chiến lược Backtest:
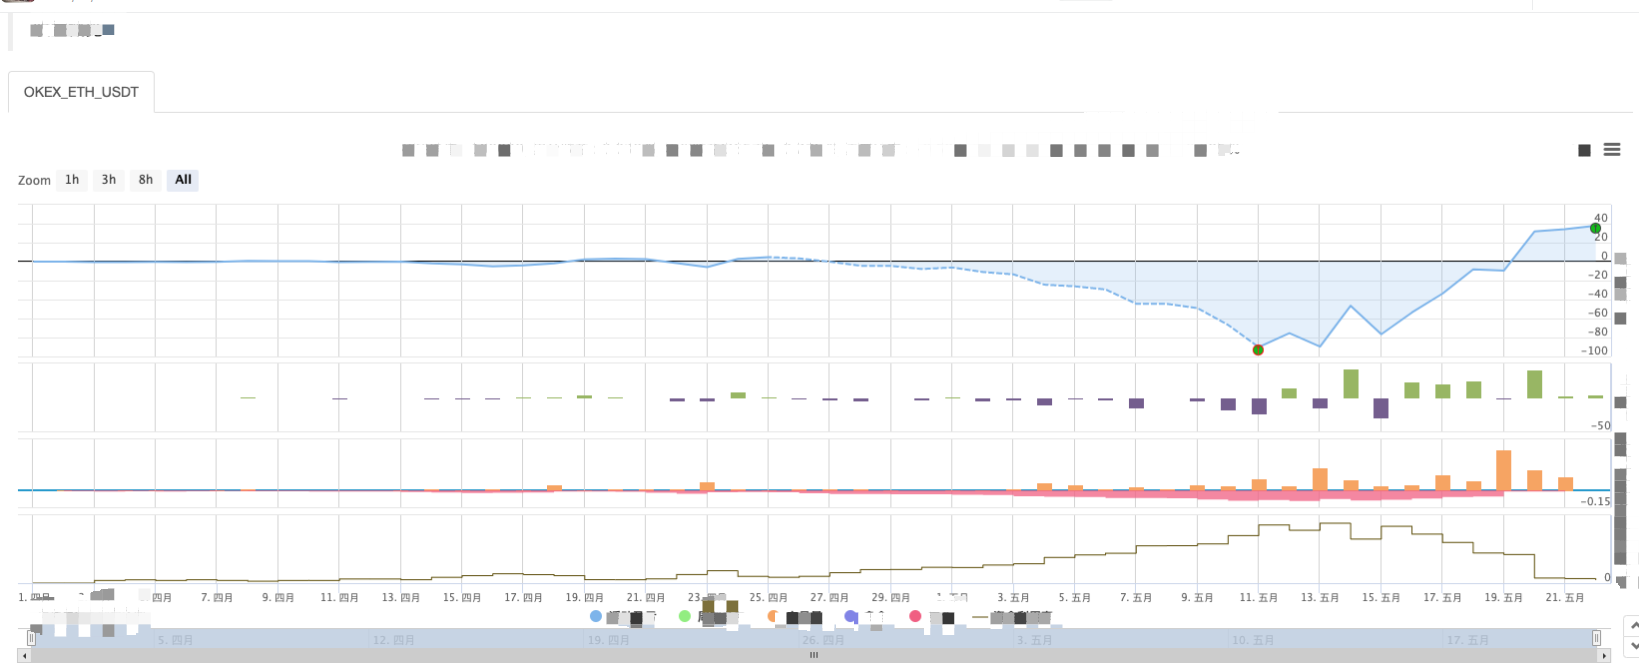
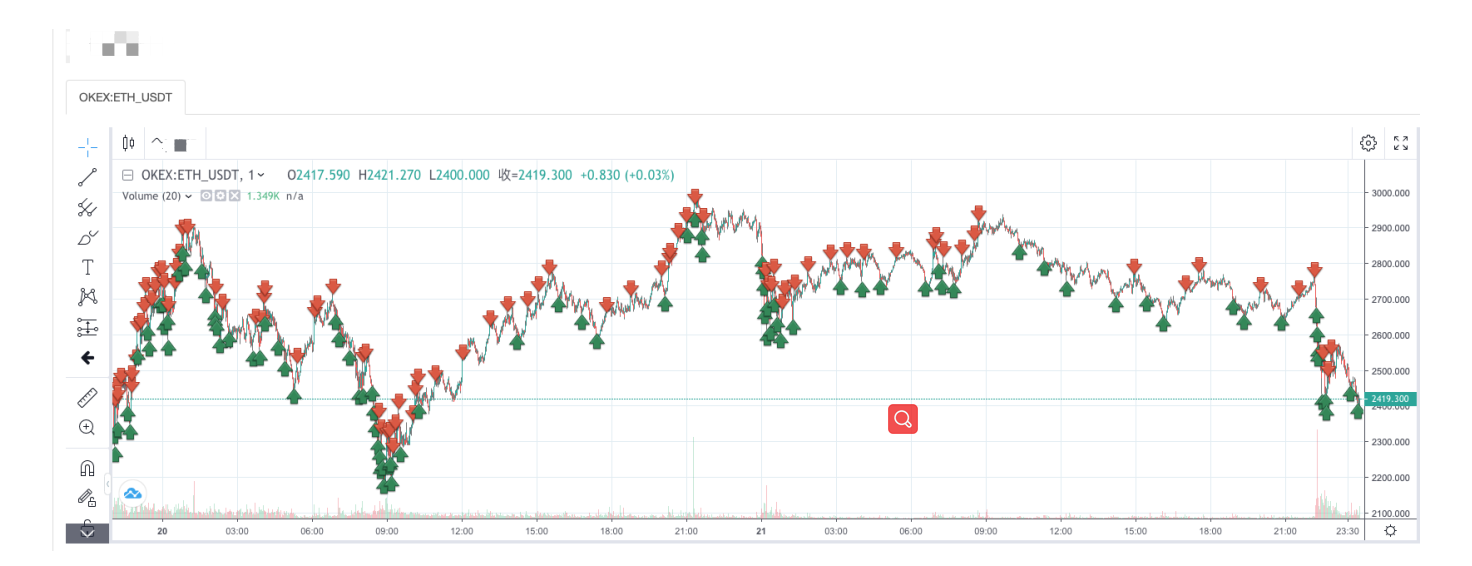
Bạn có thể thấy các đặc điểm của chiến lược lưới điện. Khi có một thị trường xu hướng, sẽ có một khoản lỗ nổi lớn, và lợi nhuận sẽ phục hồi trong một thị trường biến động. Do đó, chiến lược lưới không phải là không có rủi ro. Chiến lược giao ngay vẫn có thể giữ lại để làm cho nó bằng, trong khi chiến lược lưới của hợp đồng tương lai có rủi ro hơn và cần thiết để thiết lập các thông số lưới bảo thủ.
- My là một ngôn ngữ có thể được viết ở đây để có một tín hiệu.
- Đảm bảo rủi ro theo hệ thống delta động của các tùy chọn deribit
- Sử dụng SQLite để xây dựng cơ sở dữ liệu FMZ Quant
- Người mới bắt đầu, hãy kiểm tra nó
Đưa bạn đến giao dịch định lượng tiền điện tử (8) - Người mới bắt đầu, hãy kiểm tra nó
Đưa bạn đến giao dịch định lượng tiền điện tử (7) - Người mới bắt đầu, hãy kiểm tra nó
Đưa bạn đến giao dịch định lượng tiền điện tử (6) - Người mới bắt đầu, kiểm tra nó
đưa bạn đến giao dịch định lượng tiền điện tử (3) - Người mới bắt đầu, kiểm tra nó
đưa bạn đến giao dịch định lượng tiền điện tử (2) - Thời gian của nhà phát minh của tôi không đúng
- Hãy đưa ra ý tưởng để tìm ra chiến lược thay thế của Thiên Chúa!
- Người mới, hãy kiểm tra nó
Đưa bạn đến giao dịch định lượng tiền điện tử (4) - Thời gian tạo đơn đặt hàng và thời gian hoàn thành đơn đặt hàng
- Chiến lược mua hàng trực tiếp của Martin
- Các anh em hiểu ngôn ngữ của tôi, hãy giúp tôi giải thích đoạn mã này là gì: _TR:=MAX ((MAX (((HIGH-LOW),ABS ((REF ((CLOSE,1) -HIGH)),ABS ((REF ((CLOSE,1) -LOW));
- Các câu hỏi về báo cáo sai
- Người mới bắt đầu, kiểm tra nó
đưa bạn đến giao dịch định lượng tiền điện tử (1) - Có thể thêm hỗ trợ typescript không?
- Chiến lược phòng hộ giao ngay tiền điện tử (2)
- Chiến lược phòng hộ giao ngay tiền điện tử (1)
- Trong API Bitget, các giao dịch theo dõi ADA, AVAX, AXS, BCH, DOT, EOS, ETC, FIL, LINK, LTC, LUNA, MATIC, SOL, XRP gặp vấn đề khi được đặt chung.