Chiến lược kép Bollinger+RSI (Chỉ mua) v1.2

1
Follow
1779
Followers
Tên chiến lược
Chiến lược Bollinger + RSI
Chiến lược tổng quan
Chiến lược này sử dụng sự kết hợp của chỉ số đường Brin với chỉ số RSI, đặt nhiều khi cả hai đều hiển thị tín hiệu bán quá mức và đặt thấp khi cả hai đều hiển thị tín hiệu mua quá mức. So với chỉ số đơn lẻ, nó có thể xác nhận tín hiệu giao dịch một cách đáng tin cậy hơn và tránh tín hiệu sai.
Ba, nguyên tắc chiến lược
- Sử dụng chỉ số RSI để đánh giá quá mua quá bán
- RSI dưới 50 được coi là quá bán
- RSI cao hơn 50 được coi là quá mua
- Sử dụng đường Brinh để xác định giá bất thường
- Giá thấp hơn đường ray bị coi là bán quá mức
- Giá cao hơn đường ray là mua quá mức
- Khi RSI và đường Brin đồng thời cho thấy tín hiệu bán tháo, hãy đặt nhiều hơn
- RSI dưới 50
- Dòng giá thấp hơn đường ray Brin
- Khi RSI và đường Brin đồng thời hiển thị tín hiệu mua quá mức, thì lệnh tháo lỗ được thực hiện.
- RSI trên 50
- Đường sắt giá cao hơn đường sắt Brin
Bốn, lợi thế chiến lược
- Kết hợp hai chỉ số, tín hiệu đáng tin cậy hơn, tránh tín hiệu giả
- Chỉ tạo vị trí nhiều đầu, đơn giản hóa logic, giảm rủi ro giao dịch
V. Chiến lược, rủi ro và giải pháp
- Các tham số Brinline được đặt không đúng cách, giới hạn đường ray lên xuống quá rộng, làm tăng nguy cơ giao dịch sai
- Tối ưu hóa tham số đường bơm, thiết lập hợp lý chu kỳ đường bơm và chênh lệch tiêu chuẩn
- RSI được thiết lập không đúng, tiêu chuẩn đánh giá quá mua quá bán không đúng, tăng nguy cơ giao dịch sai
- Tối ưu hóa các tham số RSI, điều chỉnh chu kỳ RSI, thiết lập hợp lý các tiêu chuẩn quá mua quá bán
- Ravin không hiệu quả khi không có xu hướng
- Kết hợp các chỉ số xu hướng để tránh hành động chấn động
Sáng kiến tối ưu hóa
- Tối ưu hóa các thiết lập tham số Brinline và RSI
- Tăng hệ thống chống thiệt hại
- Kết hợp các chỉ số xu hướng như MACD
- Tăng khả năng kết hợp giữa đường ngắn và đường dài
VII. Kết luận
Chiến lược này kết hợp lợi thế của cả hai chỉ số Brinline và RSI, giao dịch khi cả hai đều hiển thị tín hiệu mua quá mức, tránh tín hiệu giả do chỉ số đơn lẻ tạo ra, do đó cải thiện độ chính xác của tín hiệu. So với phiên bản trước, chỉ thiết lập vị trí nhiều đầu, giảm rủi ro giao dịch.
Source
Pine
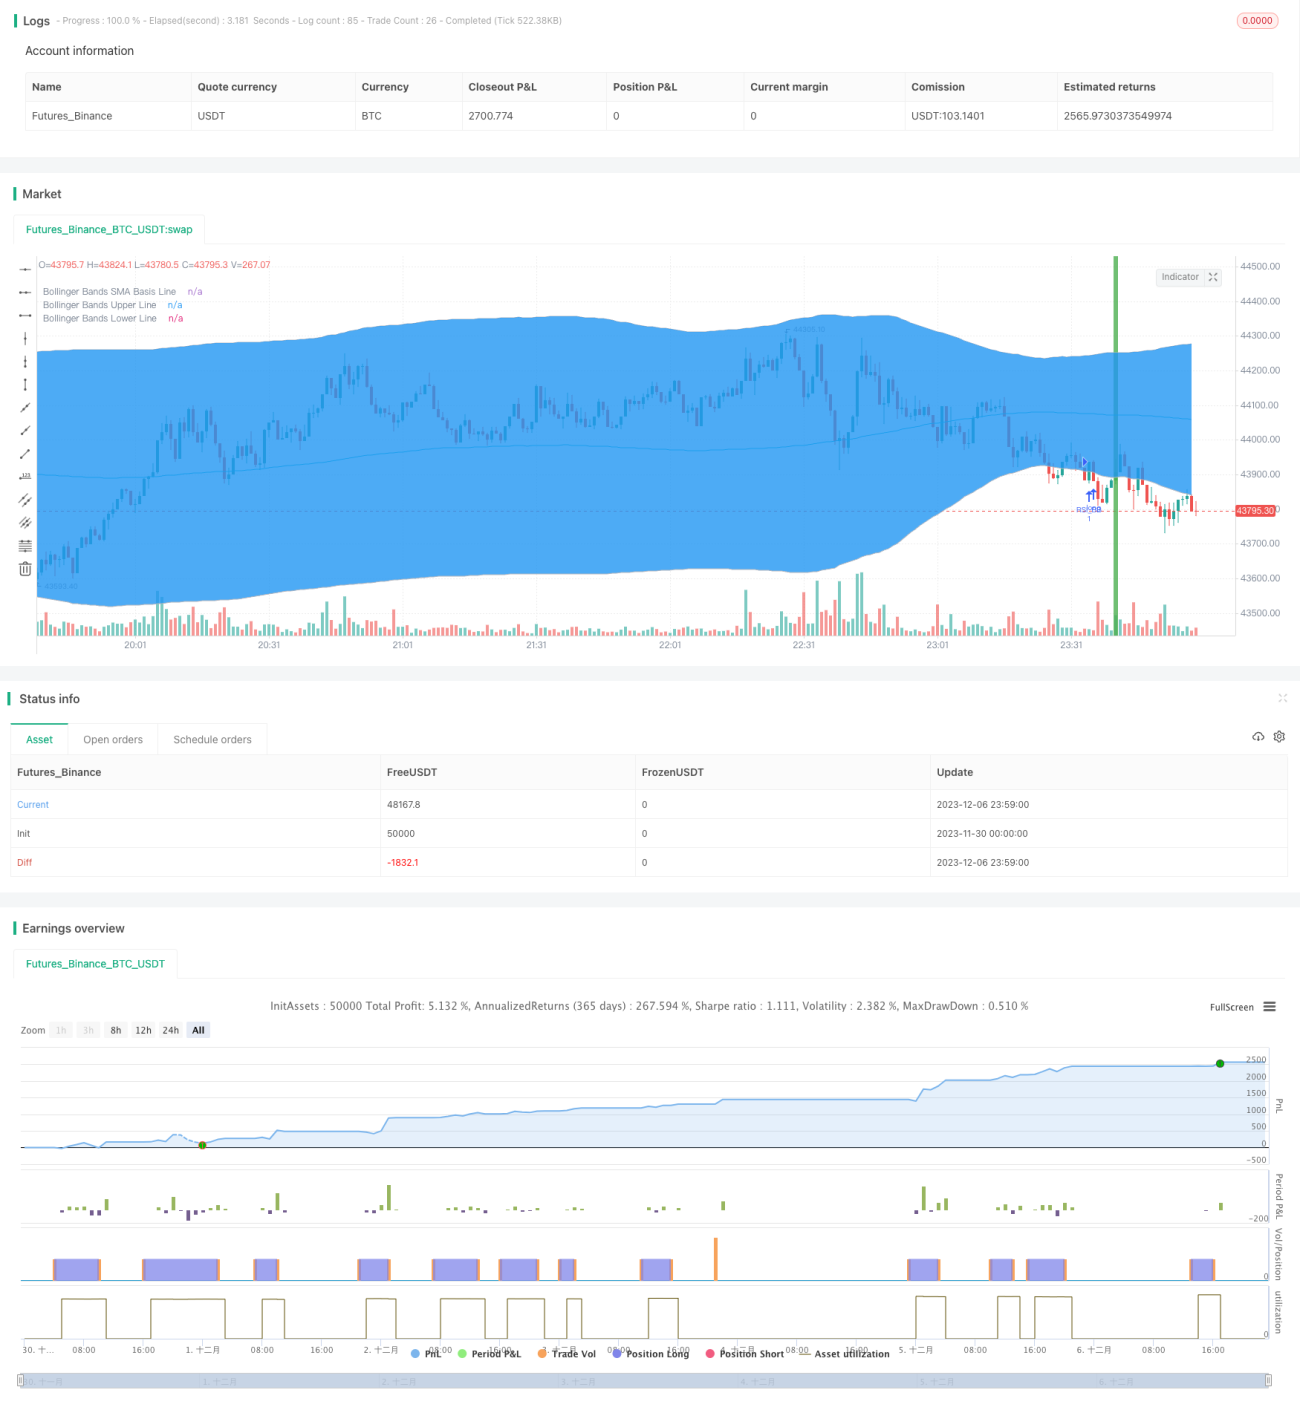
/*backtest
start: 2023-11-30 00:00:00
end: 2023-12-07 00:00:00
period: 1m
basePeriod: 1m
exchanges: [{"eid":"Futures_Binance","currency":"BTC_USDT"}]
*/

//@version=3
strategy("Bollinger + RSI, Double Strategy Long-Only (by ChartArt) v1.2", shorttitle="CA_-_RSI_Bol_Strat_1.2", overlay=true)

// ChartArt's RSI + Bollinger Bands, Double Strategy UPDATE: Long-OnlyStrategy parameters
Related strategies
Comment
All comments (0)
No data
- 1