Chiến lược tín hiệu giao cắt đường trung bình động
Ngày tạo:
2024-01-08 15:54:32
sửa đổi lần cuối:
2024-01-08 15:54:32
sao chép:
0
Số nhấp chuột:
799
1
tập trung vào
1750
Người theo dõi
Tổng quan
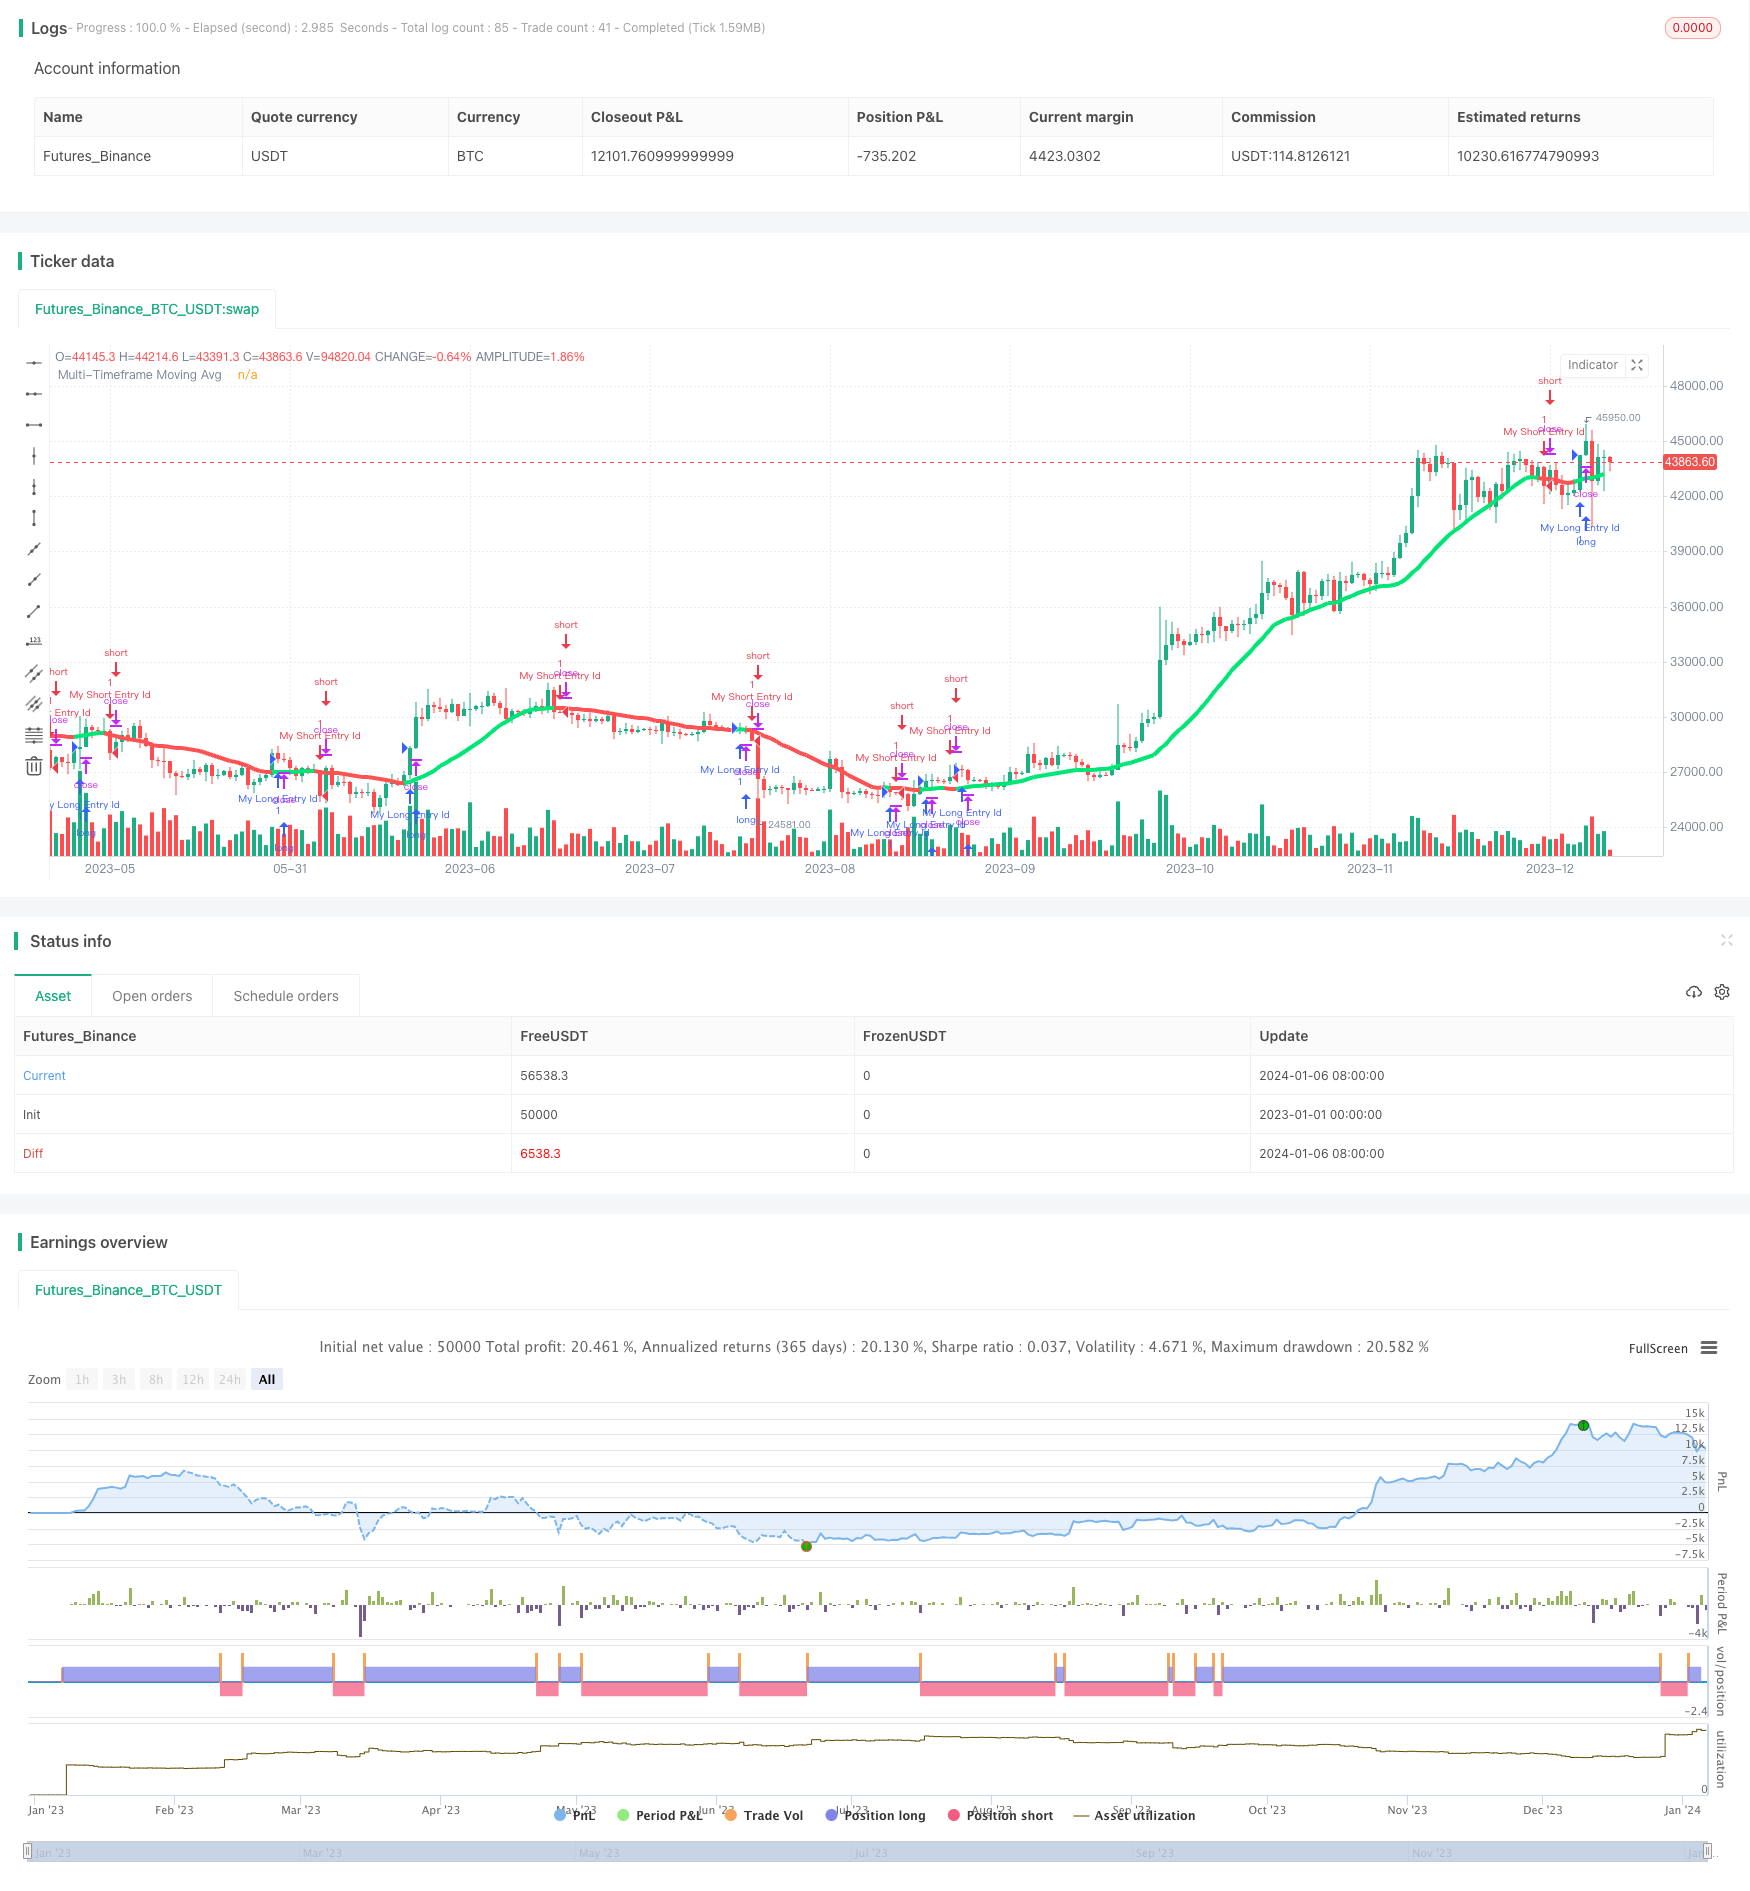
Chiến lược này thực hiện tín hiệu giao chéo giữa các moving average bằng cách tính toán và vẽ các loại moving average khác nhau để phát ra tín hiệu mua và bán.
Nguyên tắc chiến lược
- Chiến lược cho phép chọn các loại moving average khác nhau, bao gồm SMA, EMA, WMA, v.v.
- Chiến lược tính toán trung bình di chuyển chính, cũng cho phép chọn trung bình di chuyển thứ hai.
- Xác định trạng thái trống của thị trường bằng cách giao chéo giữa trung bình di chuyển chính và trung bình di chuyển thứ hai.
- Một tín hiệu mua được tạo ra khi một trung bình di chuyển trên đường trung bình di chuyển chính đi qua chu kỳ được chỉ định của nó; một tín hiệu bán được tạo ra khi một trung bình di chuyển dưới đường trung bình di chuyển chính đi qua chu kỳ được chỉ định của nó.
- Bằng cách này, thông qua sự giao thoa của các đường trung bình di chuyển, có thể đánh giá rõ ràng hơn về tình trạng trống rỗng của thị trường.
Lợi thế chiến lược
- Các loại moving average có thể tùy chỉnh để đáp ứng các nhu cầu khác nhau.
- Có thể thêm một đường trung bình di chuyển thứ hai để làm cho tín hiệu rõ ràng hơn.
- Chu kỳ trung bình di chuyển có thể tùy chỉnh, áp dụng cho các chu kỳ thời gian khác nhau.
- Màu sắc có thể được làm mịn để làm cho hình ảnh rõ ràng hơn.
- Sử dụng cơ chế tín hiệu chéo để xác định chính xác trạng thái đa không khí.
Rủi ro và tối ưu hóa chiến lược
- Đường trung bình di chuyển có độ trễ và có thể có tín hiệu sai. Bạn có thể chọn đường cong phù hợp với đường trung bình di chuyển.
- Việc thiết lập chu kỳ trung bình di chuyển không đúng cách có thể dẫn đến việc bỏ lỡ cơ hội giao dịch. Bạn có thể thử nhiều kết hợp hơn để tìm tham số tốt nhất.
- Xác minh được đề xuất kết hợp với các chỉ số khác như chỉ số năng lượng khối lượng giao dịch để giảm rủi ro.
- Có thể xem xét thay đổi trung bình di chuyển của tín hiệu lấy thành trung bình cuộn, có thể cải thiện độ chính xác của tín hiệu.
- Có thể kết hợp các mô hình học sâu như LSTM để tối ưu hóa chiến lược.
Tóm tắt
Chiến lược này có ý tưởng tổng thể rõ ràng, sử dụng nguyên tắc giao chéo trung bình di chuyển để đánh giá tình trạng thị trường trống rỗng, các tham số có thể được tùy chỉnh để đáp ứng nhu cầu khác nhau. Ngoài ra, có một số vấn đề, nhưng có thể được cải thiện bằng cách tối ưu hóa mô hình và tham số. Nhìn chung, chiến lược này là đại diện điển hình của chiến lược giao dịch dựa trên trung bình di chuyển.
Mã nguồn chiến lược
/*backtest
start: 2023-01-01 00:00:00
end: 2024-01-07 00:00:00
period: 1d
basePeriod: 1h
exchanges: [{"eid":"Futures_Binance","currency":"BTC_USDT"}]
*/

//@version=3
strategy("Moving averages-Strategy", overlay=true)
//Created by user ChrisMoody 4-24-2014
//Plots The Majority of Moving Averages
//Defaults to Current Chart Time Frame --- But Can Be Changed to Higher Or Lower Time Frames
//2nd MA Capability with Show Crosses Feature

//inputs
src = close
useCurrentRes = input(true, title="Use Current Chart Resolution?")
resCustom = input(title="Use Different Timeframe? Uncheck Box Above",defval="D")
len = input(20, title="Moving Average Length - LookBack Period")
atype = input(1,minval=1,maxval=7,title="1=SMA, 2=EMA, 3=WMA, 4=HullMA, 5=VWMA, 6=RMA, 7=TEMA")
cc = input(true,title="Change Color Based On Direction?")
smoothe = input(2, minval=1, maxval=10, title="Color Smoothing - 1 = No Smoothing")
doma2 = input(false, title="Optional 2nd Moving Average")
len2 = input(50, title="Moving Average Length - Optional 2nd MA")
atype2 = input(1,minval=1,maxval=7,title="1=SMA, 2=EMA, 3=WMA, 4=HullMA, 5=VWMA, 6=RMA, 7=TEMA")
cc2 = input(true,title="Change Color Based On Direction 2nd MA?")
warn = input(false, title="***You Can Turn On The Show Dots Parameter Below Without Plotting 2nd MA to See Crosses***")
warn2 = input(false, title="***If Using Cross Feature W/O Plotting 2ndMA - Make Sure 2ndMA Parameters are Set Correctly***")
sd = input(false, title="Show Dots on Cross of Both MA's")


res = useCurrentRes ? timeframe.period : resCustom
//hull ma definition
hullma = wma(2*wma(src, len/2)-wma(src, len), round(sqrt(len)))
//TEMA definition
ema1 = ema(src, len)
ema2 = ema(ema1, len)
ema3 = ema(ema2, len)
tema = 3 * (ema1 - ema2) + ema3

avg = atype == 1 ? sma(src,len) : atype == 2 ? ema(src,len) : atype == 3 ? wma(src,len) : atype == 4 ? hullma : atype == 5 ? vwma(src, len) : atype == 6 ? rma(src,len) : tema
//2nd Ma - hull ma definition
hullma2 = wma(2*wma(src, len2/2)-wma(src, len2), round(sqrt(len2)))
//2nd MA TEMA definition
sema1 = ema(src, len2)
sema2 = ema(sema1, len2)
sema3 = ema(sema2, len2)
stema = 3 * (sema1 - sema2) + sema3

avg2 = atype2 == 1 ? sma(src,len2) : atype2 == 2 ? ema(src,len2) : atype2 == 3 ? wma(src,len2) : atype2 == 4 ? hullma2 : atype2 == 5 ? vwma(src, len2) : atype2 == 6 ? rma(src,len2) : tema

out = avg
out_two = avg2

out1 = request.security(syminfo.tickerid, res, out)
out2 = request.security(syminfo.tickerid, res, out_two)

ma_up = out1 >= out1[smoothe]
ma_down = out1 < out1[smoothe]

col = cc ? ma_up ? lime : ma_down ? red : aqua : aqua
col2 = cc2 ? ma_up ? lime : ma_down ? red : aqua : aqua

circleYPosition = out2

plot(out1, title="Multi-Timeframe Moving Avg", style=line, linewidth=4, color = col)
plot(doma2 and out2 ? out2 : na, title="2nd Multi-TimeFrame Moving Average", style=circles, linewidth=4, color=col2)
plot(sd and cross(out1, out2) ? circleYPosition : na,style=cross, linewidth=5, color=yellow)


longCondition = crossover(out1, out1[smoothe])
if (longCondition)
    strategy.entry("My Long Entry Id", strategy.long)

shortCondition = crossunder(out1, out1[smoothe])
if (shortCondition)
    strategy.entry("My Short Entry Id", strategy.short)