Chiến lược đột phá dải Bollinger

Tổng quan
Chiến lược này sử dụng các dải Brinh làm tín hiệu mua bán, mua khi giá phá vỡ đường mòn xuống và bán khi nó phá vỡ đường mòn lên. Đồng thời sử dụng phương pháp gia tăng vị thế theo kiểu kim tự tháp, tiếp tục mua khi số vị trí nắm giữ thấp hơn giá trị thiết lập và bán khi giá trị thiết lập cao hơn. Chiến lược này áp dụng cho các hoạt động thị trường có xu hướng rõ ràng.
Nguyên tắc chiến lược
- Tính toán đường ray trên, đường trung và đường dưới của Brin. đường trung là trung bình di chuyển đơn giản của giá đóng cửa, đường trung là đường trung cộng với chênh lệch tiêu chuẩn của giá đóng cửa.
- Khi giá đóng cửa thấp hơn hoặc bằng đường ray xuống, tạo ra tín hiệu mua; cao hơn hoặc bằng đường ray lên, tạo ra tín hiệu bán.
- Nếu số lượng hiện tại của bạn ít hơn số lượng đặt cược của kim tự tháp, bạn sẽ tiếp tục mua; Nếu số lượng lớn hơn số lượng đặt cược, bạn sẽ bán.
- Hình vẽ các đường ray trên và dưới của vùng Brin trên biểu đồ.
Lợi thế chiến lược
- Brinbands có thể định lượng các khu vực dao động của giá, cung cấp tín hiệu mua bán rõ ràng và dễ dàng sử dụng.
- Các nhà đầu tư khác cũng có thể sử dụng phương pháp này để tăng lợi nhuận của thị trường.
- Brin có khả năng nhận biết xu hướng và kiểm soát rủi ro, phù hợp với người giao dịch xu hướng.
Rủi ro chiến lược
- Các tín hiệu mua và bán thường xuyên có thể dẫn đến tổn thất khi thị trường đang trong tình trạng biến động.
- Phương pháp tăng cường kim tự tháp làm tăng nguy cơ giảm giá nếu xu hướng đảo ngược.
- Lựa chọn tham số Brin cần được tối ưu hóa cho các thị trường và chu kỳ khác nhau, tham số không phù hợp có thể dẫn đến thất bại của chiến lược.
Hướng tối ưu hóa chiến lược
- Có thể kết hợp với các chỉ số khác như RSI, MACD, v.v. để xác nhận tín hiệu băng tần Brin lần thứ hai, cải thiện độ chính xác của tín hiệu.
- Kiểm soát số lượng và tỷ lệ đặt cược của kim tự tháp, thiết lập vị trí dừng lỗ, rủi ro giảm xuống.
- Thử nghiệm tối ưu hóa các tham số của Brin như chu kỳ, nhân, v.v. để chọn các tham số tốt nhất.
- Trong thị trường chấn động, bạn có thể xem xét sử dụng chiến lược đường băng Brin để thả và hút cao giữa đường ray lên và xuống.
Tóm tắt
Chiến lược phá vỡ Brin Belt sử dụng vị trí của giá so với Brin Belt để tạo ra tín hiệu theo dõi xu hướng, đồng thời tăng lợi nhuận theo xu hướng thông qua việc tăng cường kim tự tháp. Tuy nhiên, trong thị trường bất ổn, hoạt động kém và tăng cường kim tự tháp có thể làm tăng tổn thất. Do đó, trong ứng dụng thực tế, cần kết hợp với các tín hiệu xác minh chỉ số khác, kiểm soát rủi ro tăng cường và tối ưu hóa các tham số. Đồng thời điều chỉnh chiến lược linh hoạt theo đặc điểm của thị trường.
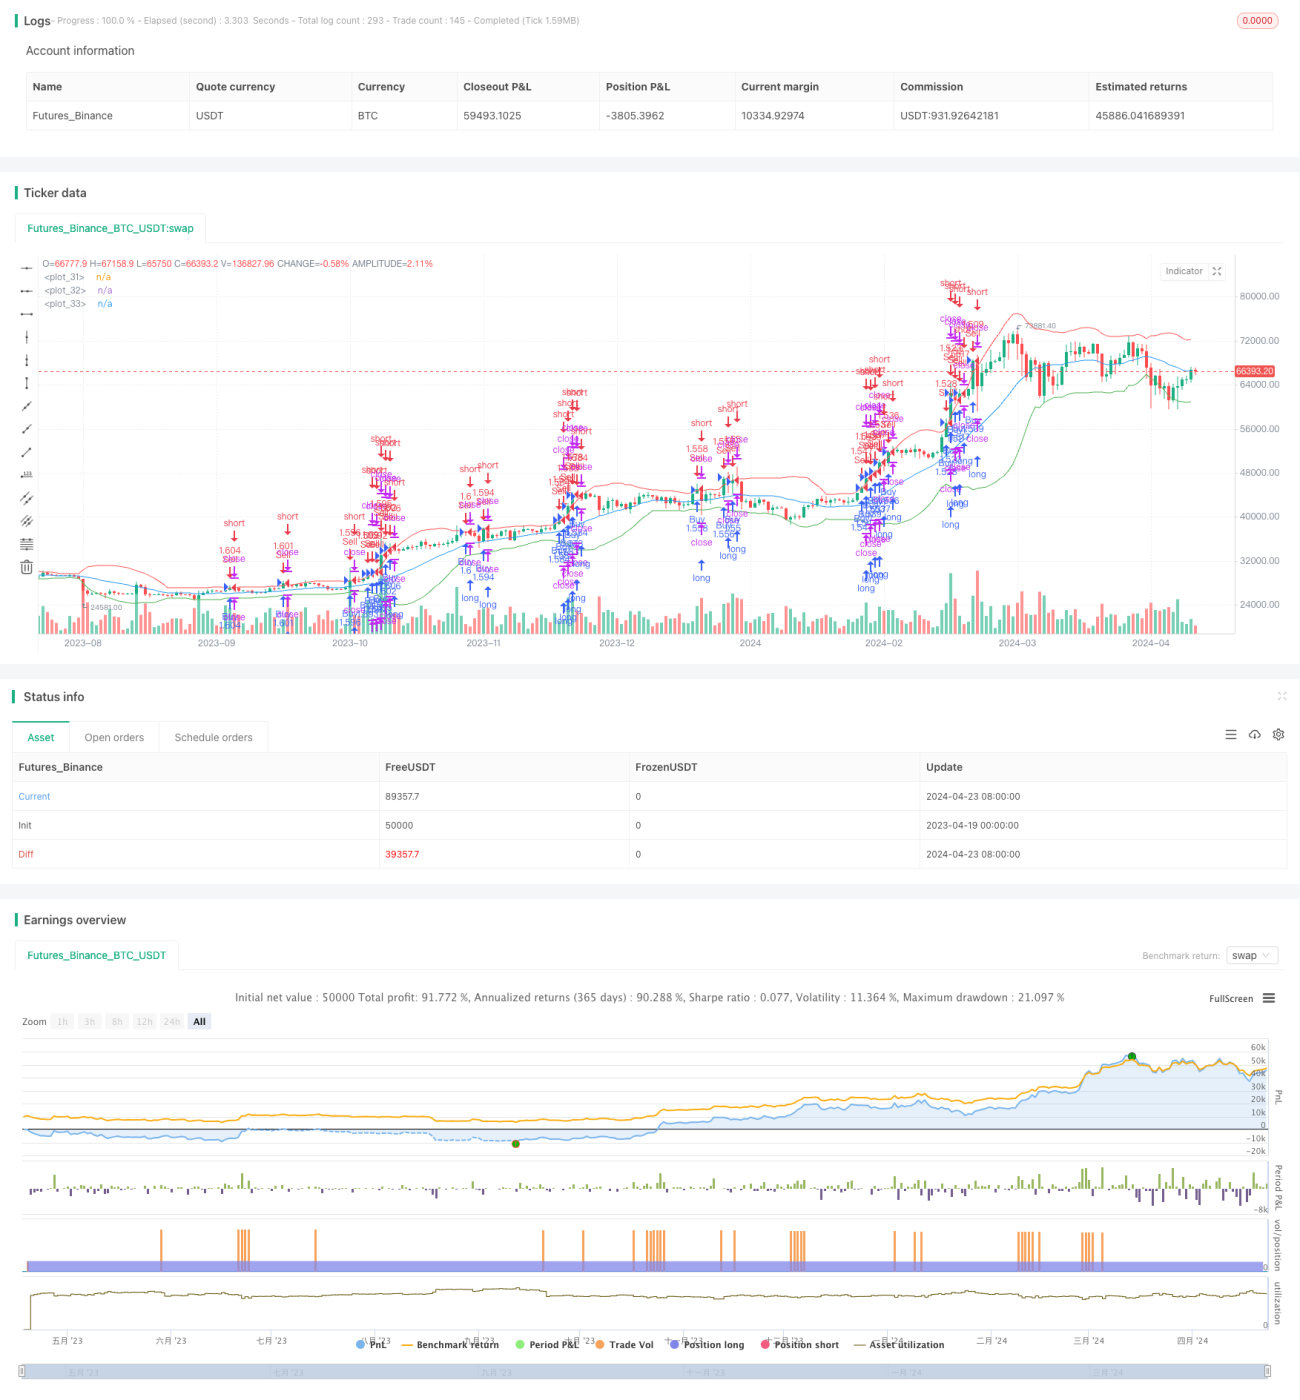
/*backtest
start: 2023-04-19 00:00:00
end: 2024-04-24 00:00:00
period: 1d
basePeriod: 1h
exchanges: [{"eid":"Futures_Binance","currency":"BTC_USDT"}]
*/

//@version=5
strategy("Bollinger Bands Breakout Strategy", overlay=true, initial_capital=100, default_qty_type=strategy.percent_of_equity, default_qty_value=100)

// Définition des paramètres- 1